Gate Valve Parametric Study
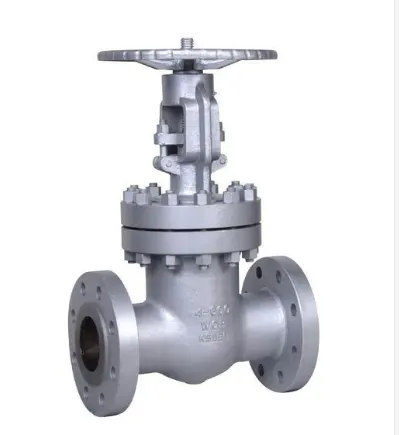
Gate valve:
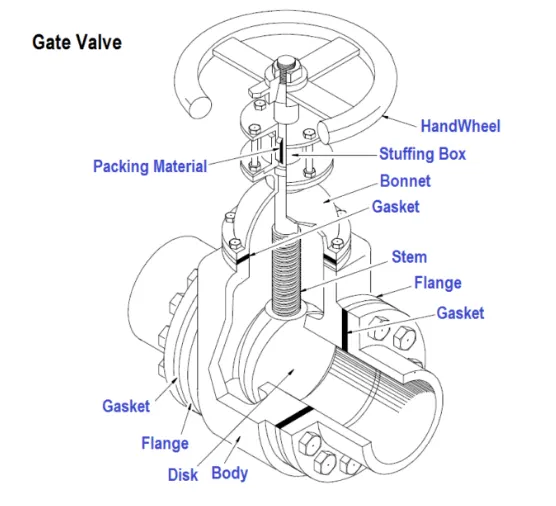
A gate valve is a linear motion valve used to start or stop the fluid flow; however, it does not regulate or throttle flow. The gate valve is used to control the fluid flow through lifting and descending the gate. A gate valve functions by lifting a rectangular or circular gate out of the path of the fluid. When the valve is fully open, gate valves are full bore, meaning there is nothing to obstruct the flow because the gate and pipeline diameter have the same opening.
Parametric study:
Parametric studies allow you to nominate parameters for evaluation, define the parameter range, specify the design constraints, and analyze the results of each parameter variation. A parametric study requires the following: Design Objective is set to parametric Dimensions.
Typically you can start a parametric analysis by varying just one input variable, the one you expect to be most important. Add other variables one at a time, in order of their expected importance. If a variable turns out to have little effect, you can restore it to its original value.
Analysis:
Geometry:
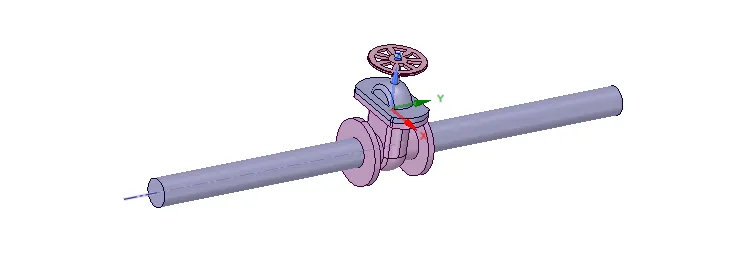
Insert the gate wall geometry. It consists of a bonnet, wheel, spindle, gate disc, and bottom. Hide bottom and select move option and select the component option < click on gate disc and move 10mm upwards and click on P(parameter) then it will be formed in groups < click on prepare and select volume extract < select edges and hide bonnet and click on both sides of the gate valve for 800mm.
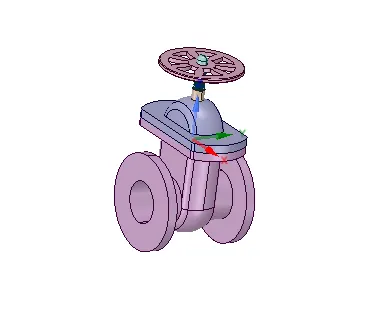
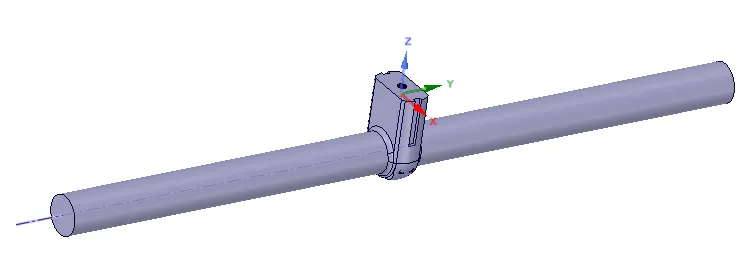
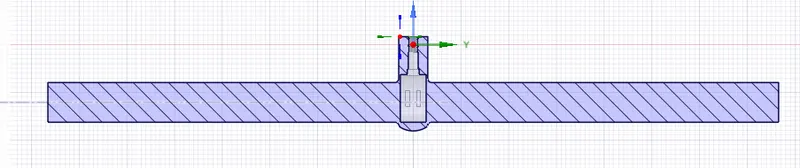
After the parametric study:
Right-click on the volume and click on update volume body in context.
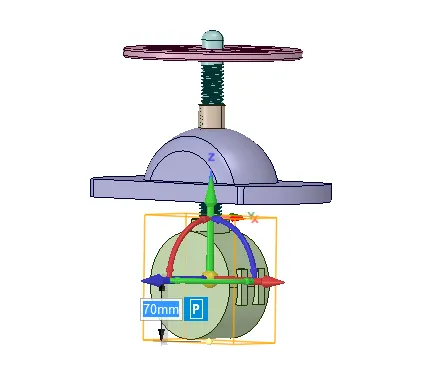
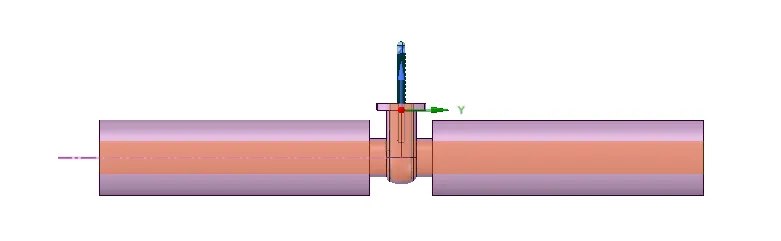
Mesh:
select face tool < click on the faces and name it as inlet and outlet.
Mesh element size = 10mm
Number of elements = 191131
After the parametric study:
Number of elements = 193419

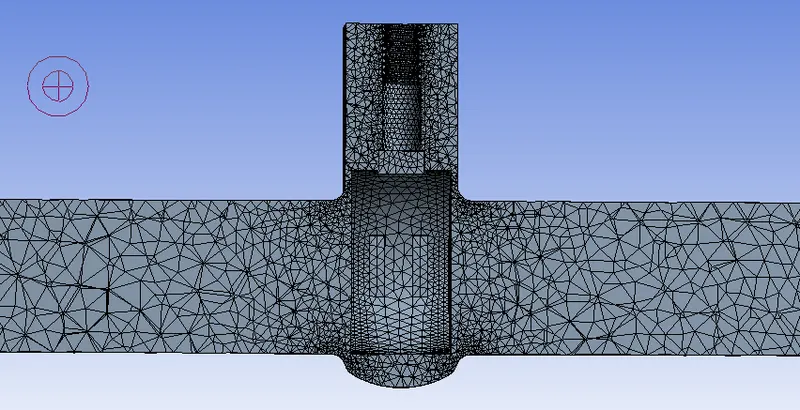
| S.No | Height | No. of Nodes |
| 1. | 10mm | 194423 |
| 2. | 20mm | 193416 |
| 3. | 30mm | 194092 |
| 4. | 40mm | 194669 |
| 5. | 60mm | 188929 |
| 6. | 70mm | 187592 |
10mm 20mm
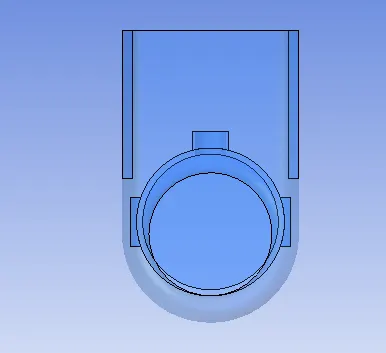
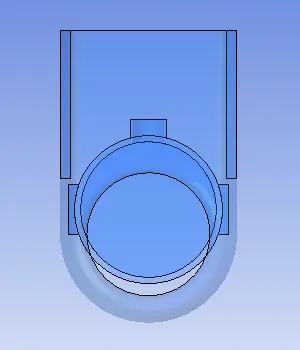
30mm 40mm
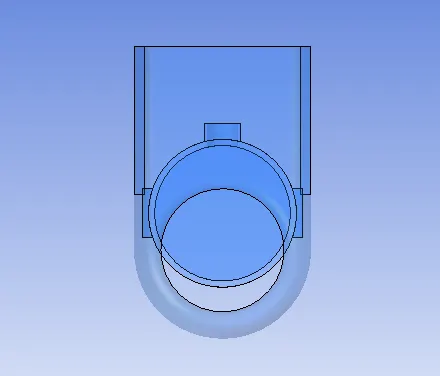
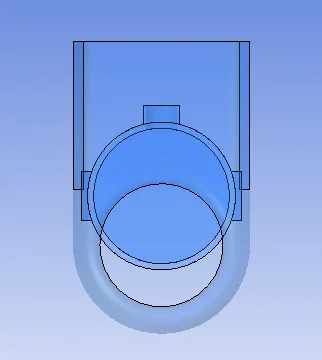
60mm 70mm
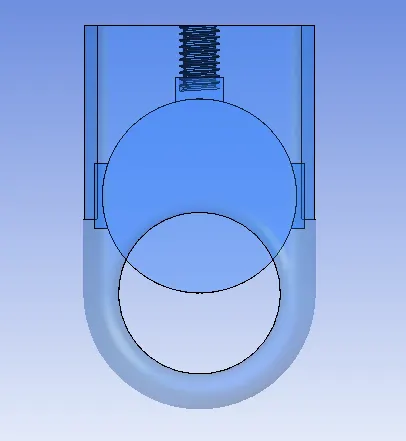
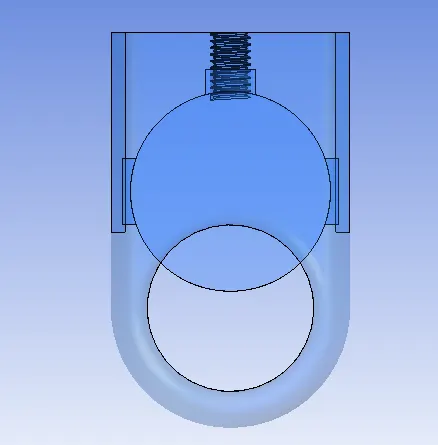
Fluent:
Gravity: Z = -9.81
Model : Reliazable, K-epsilon, Scalable wall functions.
Materials: Water. change the cell zones to the material water.
Boundary conditions: inlet - Type - pressure inlet and pressure = 10.
Methods: change momentum to the 1st order upwind.
Controls: momentum = 0.4, pressure =0.1.
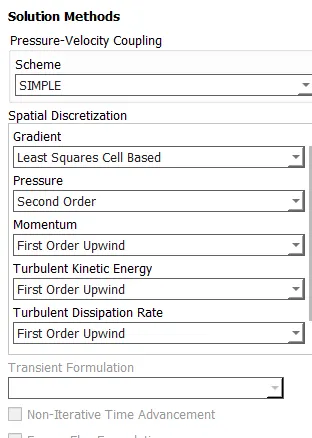
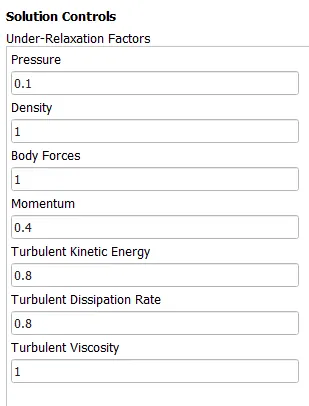
Uncheck the convergence in residuals < use standard method, compute from inlet and run calculate.
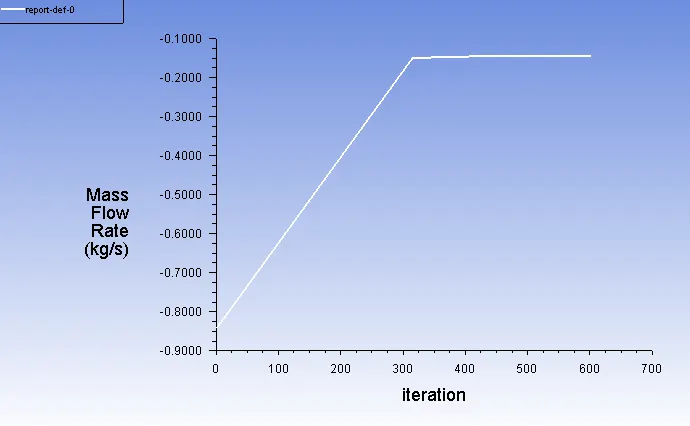
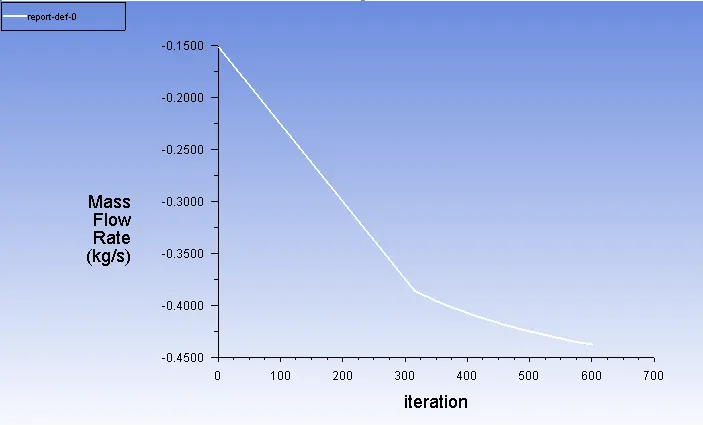
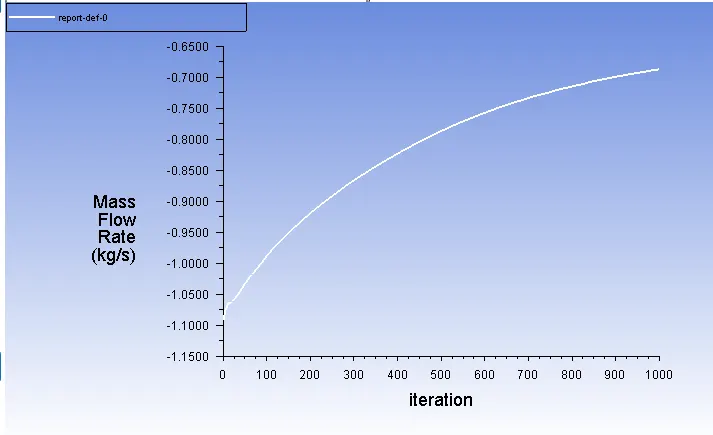
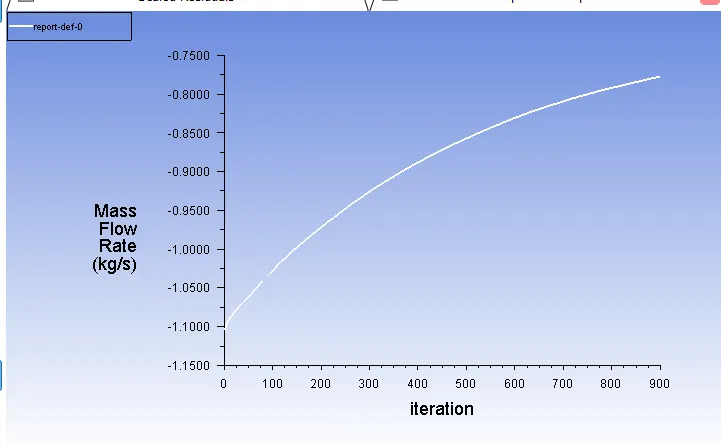
Mass flow rate:
10mm 20mm
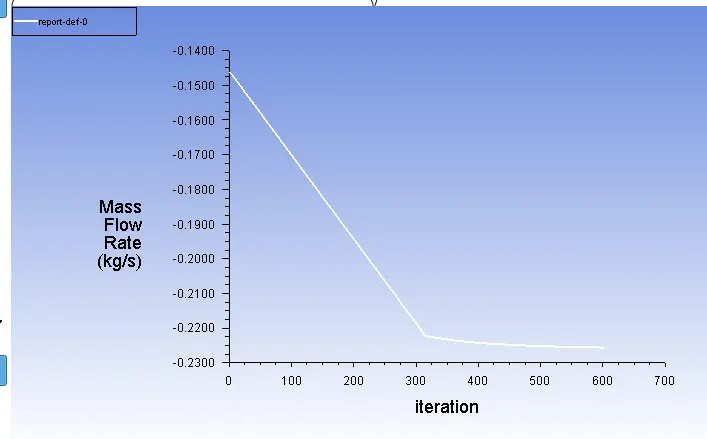
30mm 40mm
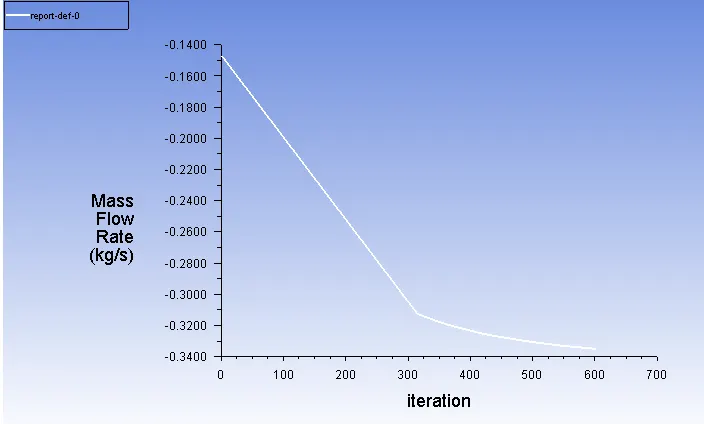
60mm 70mm
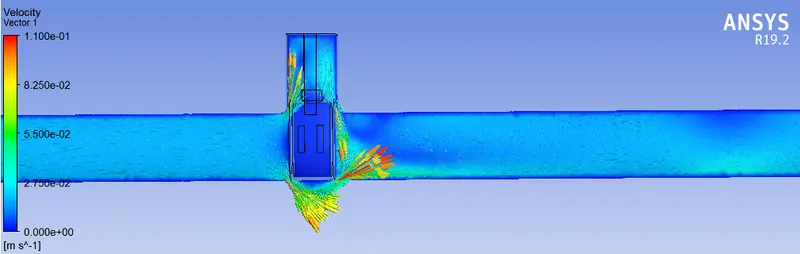
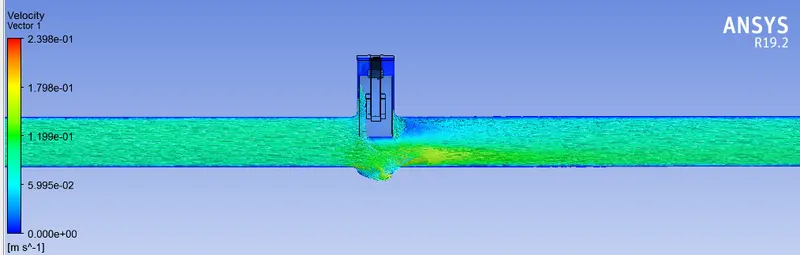
Velocity counters:
For 10mm:
For 20mm:
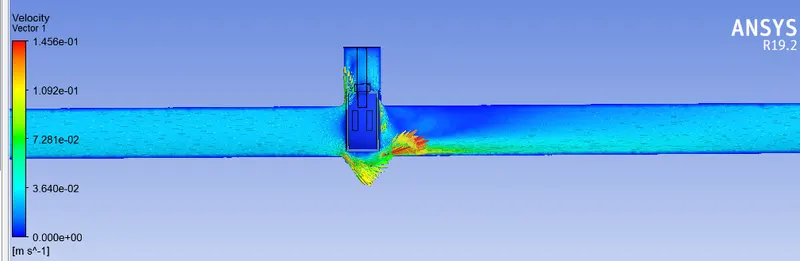
For 30mm:
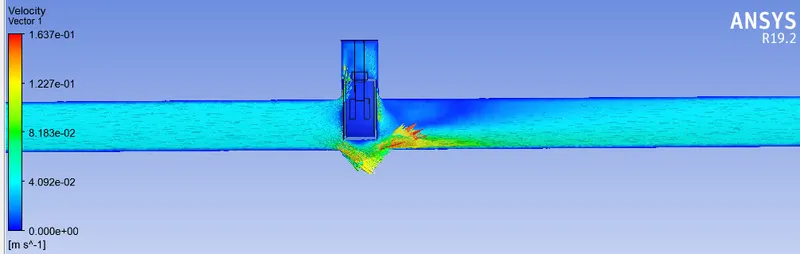
For 40mm:
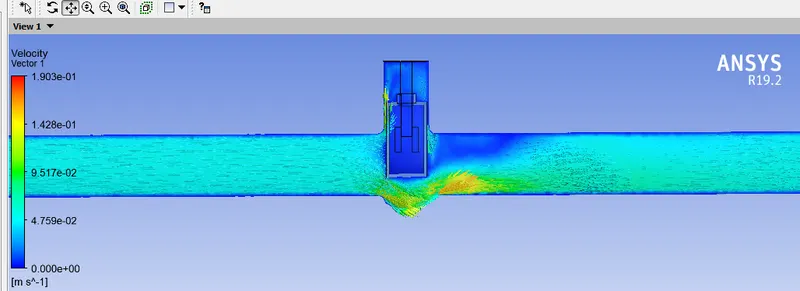
For 60mm:
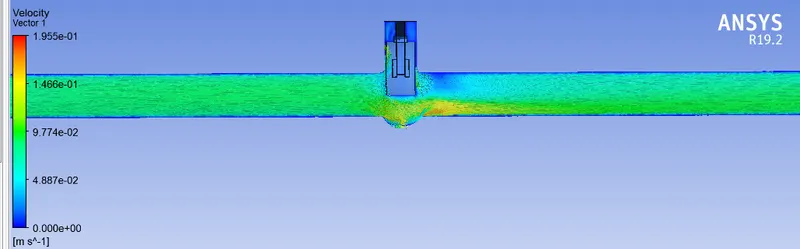
For 70mm:
Flow coefficient(`C_v`):
The flow coefficient of a device is a relative measure of its efficiency at allowing fluid flow. It describes the relationship between the pressure drop across an orifice valve or other assembly and the corresponding flow rate.
`C_v = Qsqrt((SG)/(DeltaP)`
Q = The rate flow(gallons per minute(gpm))
SG = Specific Gravity of the fluid(for water=1)
`DeltaP` = Pressure drop across the valve(expressed in psi)
pressure drop is the pressure inlet minus pressure outlet. So, in this challenge, the pressure inlet = 10 and outlet = 0. And the pressure drop is 10 psi.
The use of the flow coefficient offers a standard method of comparing valve capacities and sizing valves for specific applications that are widely accepted by the industry. The general definition of the flow coefficient can be expanded into equations modeling the flow of liquids, gases, and steam using the discharge coefficient.
For 10mm:
Q = 0.14456
SG = 1
`DeltaP` = 10
`C_v` = 0.14456*`sqrt(1/10)`
`C_v`= 0.04571
Flow factor(`K_v`):
The metric equivalent flow factor is calculated using metric units.
`K_v = Qsqrt((SG)/(DeltaP))`
Q = flow rate(`m^3/(hr)`)
OR Flow factor can be calculated from `C_v` using the equation.
`K_v = 0.865*C_v`
For 10mm:
`K_v` = 0.865*0.04571
`K_v`= 0.03954
Observation:
| DP | Height |
Mass flow rate(Q) (US gpm) |
Mass flow rate(Q) (kg/m) |
`DeltaP` | SG |
Flow coefficient (`C_v`) |
Flow factor (`K_v`) |
| 1 | 10 | 2.29 | -0.14456 | 10 | 1 | 0.04571 | 0.03954 |
| 2 | 20 | 3.58 | -0.22651 | 10 | 1 | 0.07162 | 0.06195 |
| 3 | 30 | 5.31 | -0.33482 | 10 | 1 | 0.10587 | 0.09158 |
| 4 | 40 | 6.93 | -0.43726 | 10 | 1 | 0.13827 | 0.11960 |
| 6 | 60 | 10.89 | -0.68756 | 10 | 1 | 0.21742 | 0.18807 |
| 7 | 70 | 12.20 | -0.78691 | 10 | 1 | 0.24884 | 0.21524 |
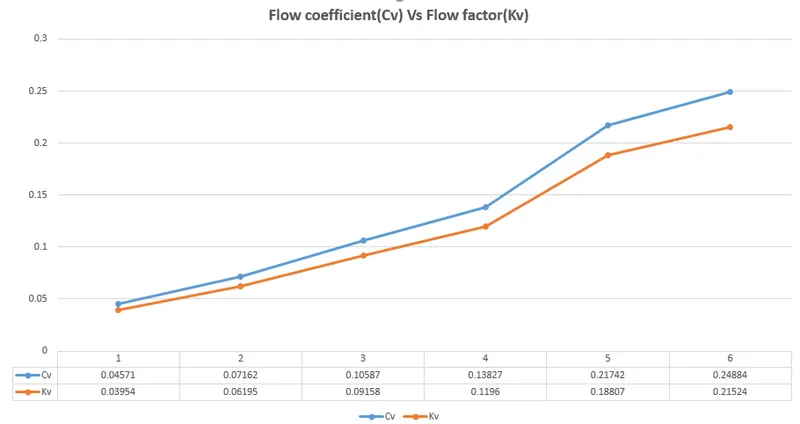
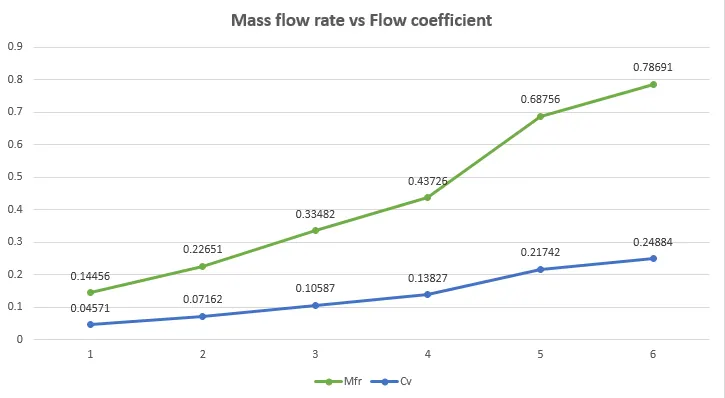
Conclusion:
From the above graph
The mass flow rate, flow coefficient and flow factor increases with the increase with the length parameters.
From the velocity counters, the velocity increases with the increases in the height parameters because there is a more pathway for the water to flow.