FSAE Car Project
OBJECTIVE: To clean up the geometry, flag the boundaries, create a virtual wind tunnel, and perform aero simulations for the FSAE vehicle to calculate the total downforce on individual components.
INTRODUCTION: Race cars, in general, have a peculiar shape that distinguishes it from any road car on the planet. This shape might be different in each one of the wide range of motorsport categories around the world, but some aspects are still present, regardless of category. Have you ever wondered why?. If you look back at the dawning of road racing and compare the race cars of the time with the representatives of each decade from then to now, you’re gonna see a range of different shapes and parts, but a single aspect will be common to all of them: the shapes concern with aerodynamics.
Aerodynamics is a study of the forces and moments created by the interaction of air with a solid body, such as an airfoil. It is a branch of fluid dynamics and relevant studies on the area began in the eighteenth century, but observations of the fundamental phenomena have been recorded much earlier. Most of the early efforts in understanding aerodynamics were directed to the development of heavier-than-air flight, which is the kind of flight that does not use buoyancy effects to generate lift forces. Since then, the use of mathematical analysis, wind tunnel tests, and computational simulation have evolved astonishingly, helping aerodynamics to become crucial in many other fields.
How Strong Can Air Be?
You might be wondering how important aerodynamic forces maybe since it is created only by air, which doesn’t even seem to have weight (although it has). You can feel how much aerodynamic impact is when you stick your hand outside of the moving car’s window. If the car has enough speed, it might be rather difficult for you to keep your hand pointing forward.
Also, you have to keep in mind that aircraft, that can weight tenths of tons, are kept in the air solely by the interaction between air the plane’s wings and control surfaces. Furthermore, you probably have heard of the disastrous consequences of tornadoes and hurricanes, which in short, are caused by wind interactions with solid objects.
A practical example of how important aerodynamic forces might be in a motorsport environment can be observed by comparing the cross-section of suspension wishbones of open-wheel race cars in the 70s and nowadays. The recent cars have streamlined, airfoil-shaped wishbones, while the cars in the 70s have a roughly circular cross-section. Figure 1 shows the comparison between a small cylinder and 10 times larger airfoil. It might be hard to believe, but both these shapes have the same drag.

Figure 1. Round tube cross-section and much larger airfoil cross-section have the same drag.
To help improve your understanding of aerodynamics, let us first discuss some force definitions. Figure 2 shows a racing car with the three aerodynamic forces that arise around it.

Figure 2. Aerodynamic forces on a race car.
Drag is the resultant of aerodynamic forces that act in the longitudinal axis of the car, opposing its movement. This is a crucial element of aerodynamics study, and it is of primary concern in road cars aerodynamic design. It must be overcome by the tractive force generated by the engine.
Lift is the resultant of aerodynamic forces that acts upward. Lift reduces the vertical forces of the car, and its reduction is of primary concern in racing car aerodynamics study. The opposite of lift is downforce, which is the resultant of aerodynamic forces that push the car against the ground.
Side Force is the resultant of aerodynamic forces that push the car sideways. This force is generated by lateral winds acting upon the vehicle. It is important for stability studies on-road cars, but since lateral wind components are relatively small in racing vehicles, its importance is reduced in the motorsport environment.
A Racing company is looking to perform Aero Simulations for its FSAE vehicle. The suspension team wants a detailed report on the total downforce on individual components. They have two races in this upcoming season.
Race details are as follows
Race-1
- Racing track conditions - Straights
- Average lap speed - 75kmph
Race-2
- Racing track conditions - Lot of turns
- Average lap speeds - 45kmph
- 70% turns at 45 degrees
- 20% turns at 80 degrees
- 10% turns at 20 degrees
GEOMETRY CLEANUP: A diagnosis test was run on the.STL file of FSAE car to check errors. As seen below, the geometry had 48 Non-Manifold Problems. This error exists when a single edge of the geometry is being shared by more than two triangles. Using the Delete and Patch tool, the error was resolved.
BOUNDARY FLAGGING: The front wings, rear wings, tires, and suspension links are flagged as separate boundaries.
VIRTUAL WIND TUNNEL: The wind tunnel was created in such a way that it captures the wake region properly, the distance from the inlet to the front of the car is about 5 times the length of the car, the distance from the outlet to the rear end of the car is about 10 times the length of the car, the width of the wind tunnel about 1 times the length of the car, the height of wind tunnel is about 2 times the length of the car. For race-2, the car is rotated about 48.3° as shown in Figure b.
Figure a. Wind Tunnel For Straight Track
Figure b. Wind Tunnel For Lot of Turns Track
CASE SETUP OR PRE-PROCESSING: This stage involved choosing simulation parameters, setting appropriate boundary conditions to the assigned boundaries, initializing regions, selecting the right turbulence model, choosing grid size, and finally selecting the number of files and variables to post-process.
- Run Parameters: Transient solver with Full-Hydrodynamic mode was chosen.
- Simulation Time Parameters: The end time was chosen as ~2 times of the flow-through time. The flow-through time is `32.5/12.5=2.6s` and the end time is chosen as 5.2 seconds.
- Regions and Initialisation: Inlet velocity is also specified. Temperature is taken as 300K and Pressure as 101325 Pascals. Oxygen with a concentration of 0.23 and Nitrogen with a concentration of 0.77 is pulled inside the region.
- Boundary Conditions: At Inlet, a Dirichlet Boundary condition is assigned with an inlet velocity of 12 m/s at a Temperature of 300K. At Outlet, a Dirichlet Boundary condition is assigned to a pressure of 101325 Pascals. Top and side Walls are assigned to the Symmetry Boundary condition and all the parts of the car are assigned to the Law of Wall Boundary condition at Temperature of 300K.
- Turbulence Model: `k-omega`SST turbulence model was chosen for simulating the Gas turbine, external flow, and low Re flows as `k- omega`SST turbulence has a good resolution for flow near the wall. The transport equations Reynolds-Averaged Navier-Stokes with standard `k-omega` SST 2006 turbulence model having automatic wall function are solved to simulate the flow.
- Mesh: The base grid is chosen based on the wall spacing value calculated from the desired Y+ value.
A non-dimensional wall distance for a wall-bounded flow can be defined in the following way:
Where
 is the friction velocity at the nearest wall,
  is the distance to the nearest wall and is the local kinematic viscosity of the fluid.
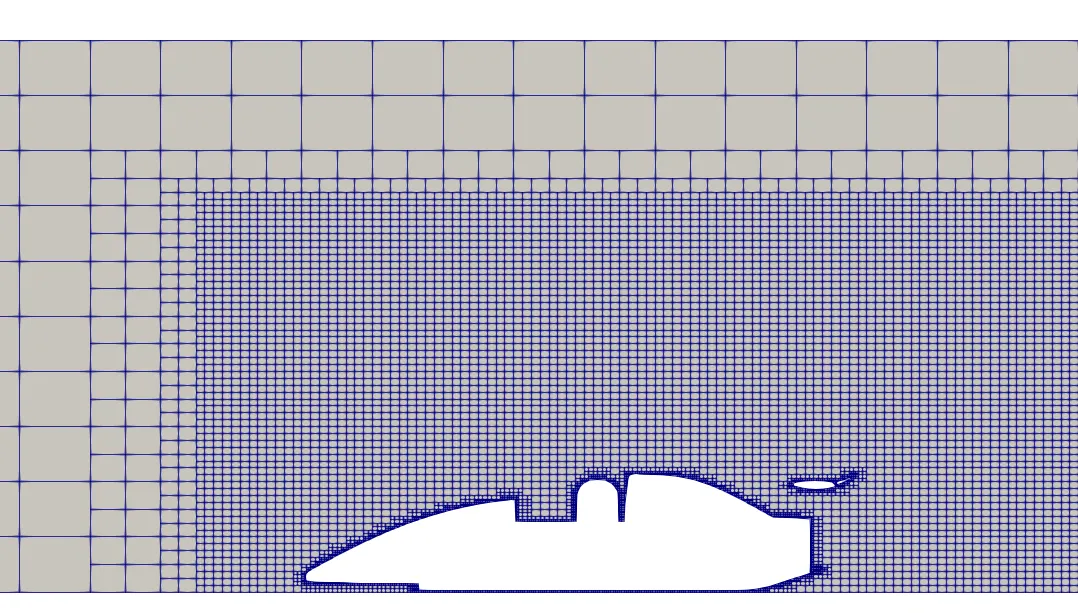
Base grid size is dx= 0.32m, dy= 0.25m, dz= 0.25m. Box embedding with a scale of 3 is made. All the parts of the car are having boundary layer embedding with 1 embed layer and a scale of 3. is often referred to simply as y plus and is commonly used in boundary layer theory and in defining the Law of the Wall. Based on these calculations,

POST-PROCESSING AND VISUALISATION: In this phase, the important objectives are to obtain the lift and drag force on every component of the car using pressure force plots, and obtain velocity and pressure contours to visualize the flow around the car and visualize the wake at the rear end of the car.
Calculating the Lift and Drag Force using Paraview:
Drag Force acts parallel to the wind flow and opposes the relative motion of the object. A high drag force is an undesirable phenomenon that can lead to the car working to overcome drag forces thus ending up to the usage of fuel. The aerodynamic design of a car is a very big contributor to how much the drag force would oppose the motion of the object. Drag Co-efficient, which is normalized using the drag force indicates how aerodynamic a certain object is.
The drag Co-efficient is calculated as:
`Cd=(2*Fd)/(rho*V^2*A)`
`Cd` is the drag coefficient,
`Fd` is the drag force,
`rho` is the density of the fluid in which the object is moving
`V` is the freestream velocity
`A` is the Frontal Area of the object
Lift Force acts perpendicular to the wind flow and it helps to generate downforce on the object. Cars, on the other hand, are designed in such a way that they produce a negative lift or downforce. This negative lift force helps the car to maintain contact with the ground surface even at very high speeds. The lift coefficient is normalized using a lift force
The lift coefficient is calculated as:
`Cl=(2*L)/(rho*V^2*A)`
`Cl` is the lift co-efficient
`L` is the lift force
RESULTS:
RACE 1: Straight Track
- Downforce and Drag Force Contours
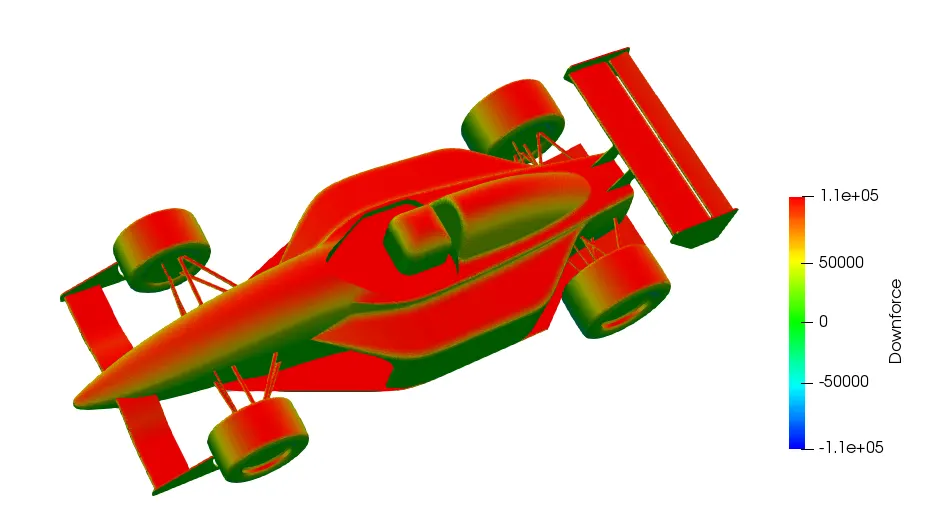
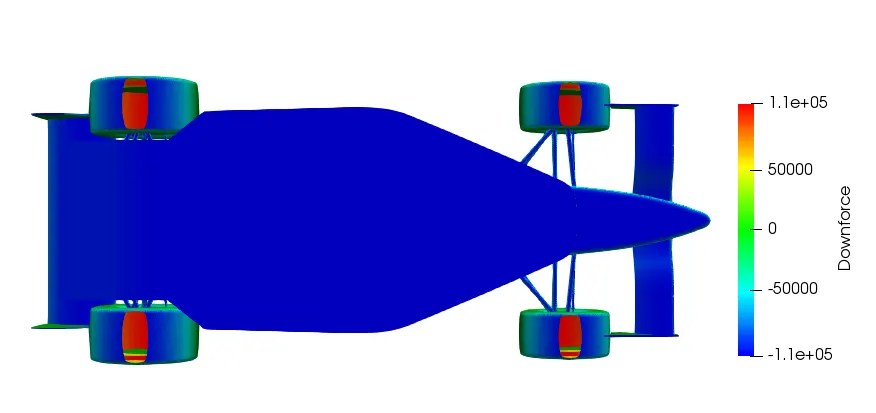
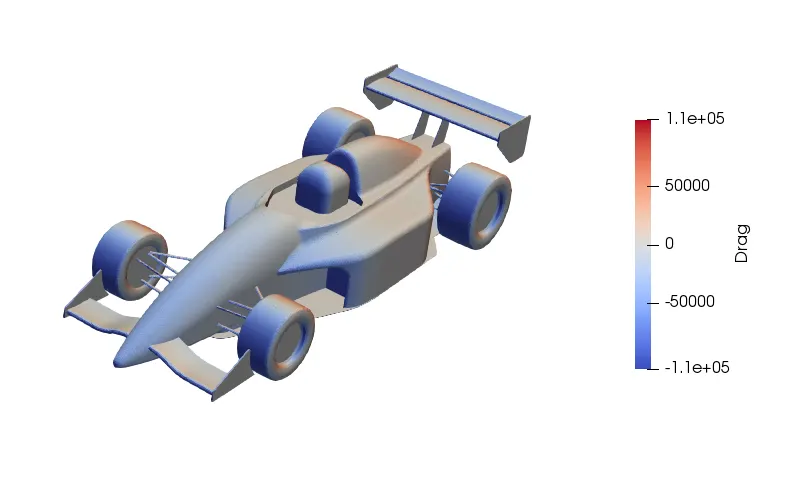
- Drag and Downforce were calculated from ParaView
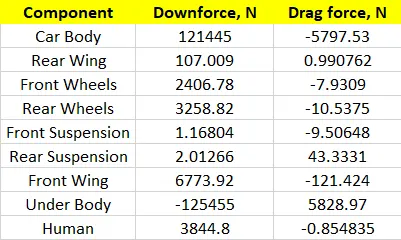
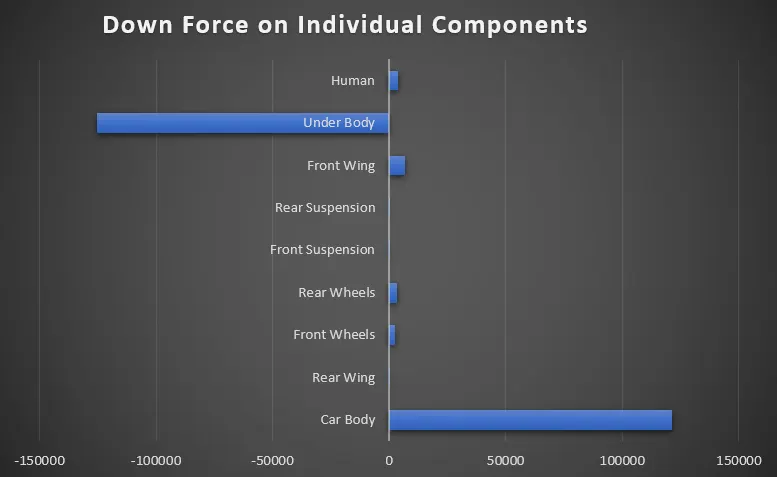
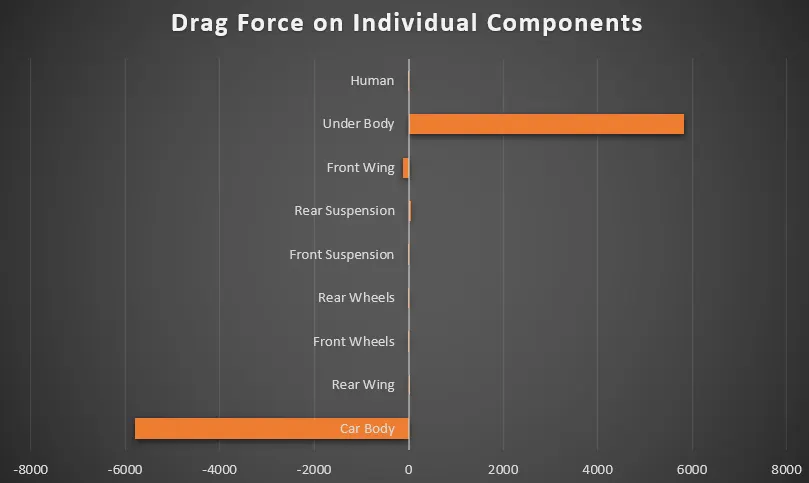
- Graph of distribution of downforce and drag force on individual components
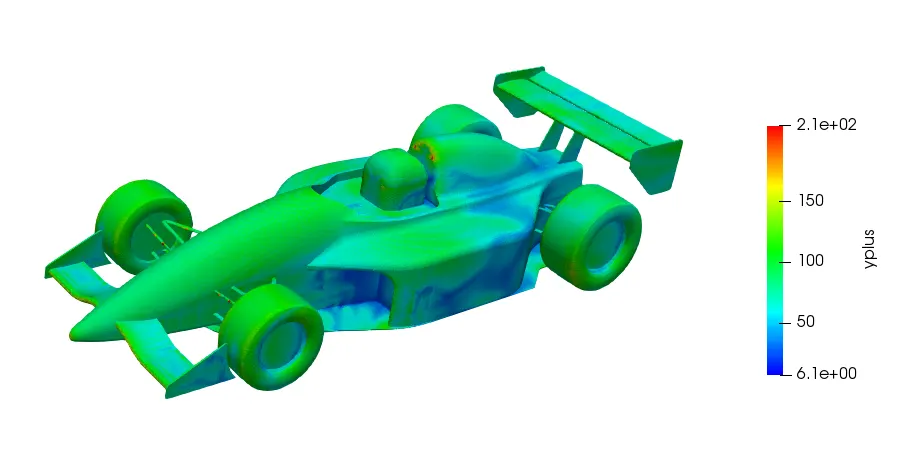
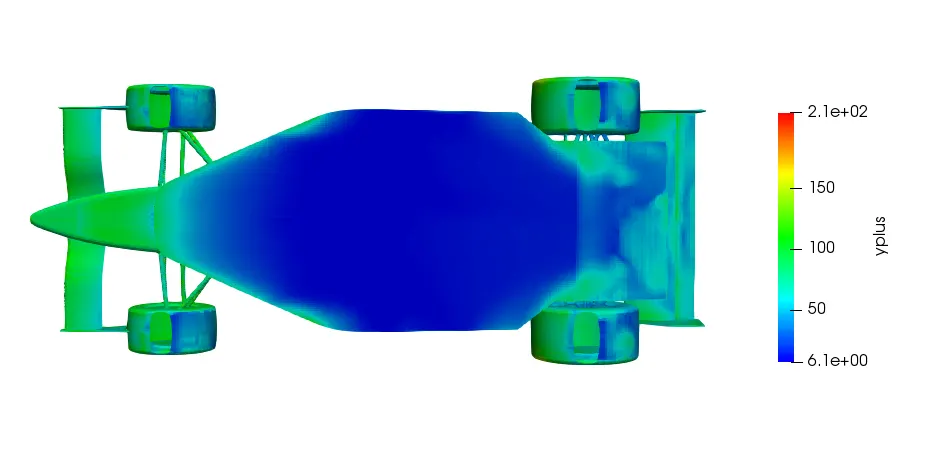
Y+">Y+ Visualization: For Law of the Wall Model, Y+">Y+ should be between 30-100 which indicates that the first cell is in the log-law region. A value lower than that would mean that the cell is in a viscous sub-layer. The below image shows that Y+">Y+ isn't uniform throughout the body. It is high on the top of the body and low at the bottom of the body.
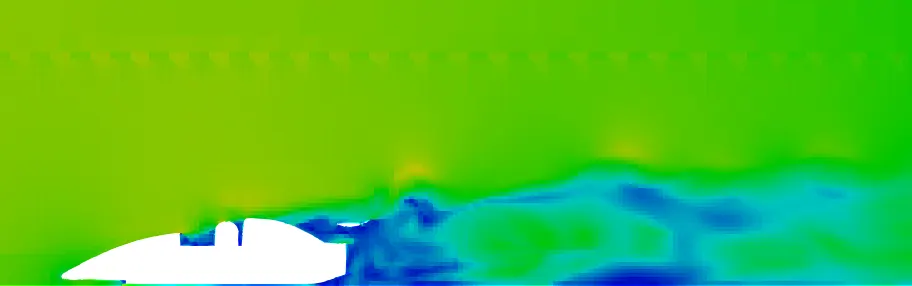
- Formation of Wakes
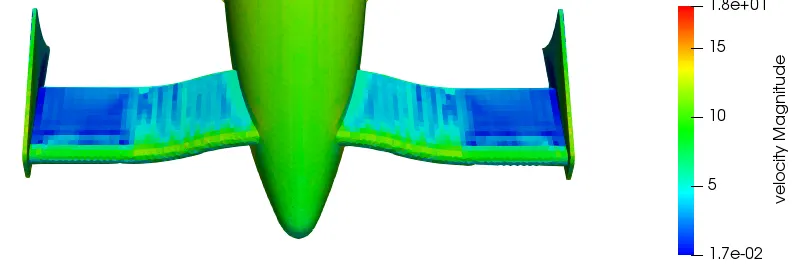
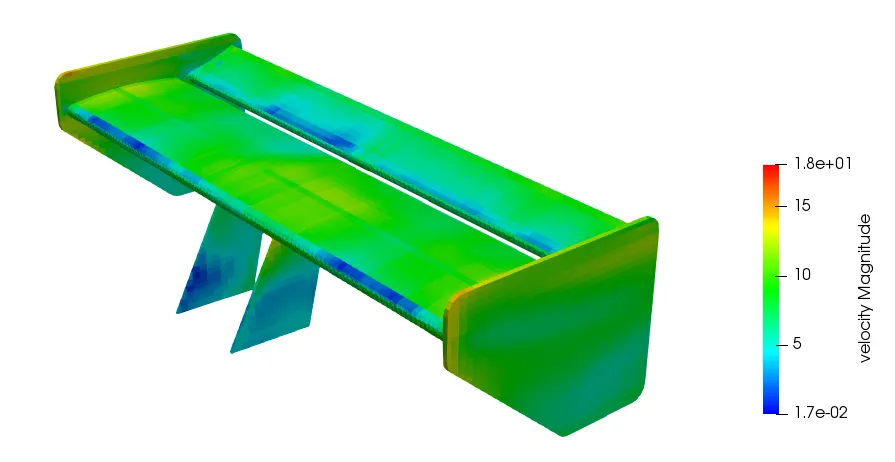
- Flow Visualization Over Front and Rear Wings
- Streamline flow over the car
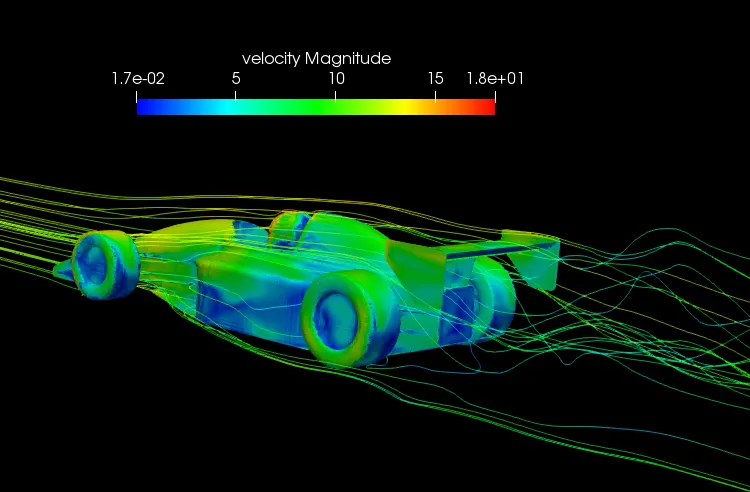
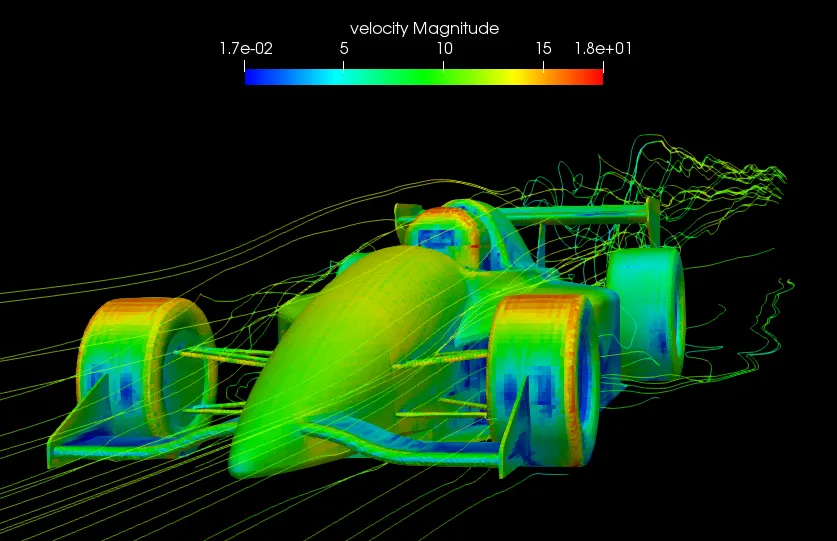
RESULTS:
RACE 2: The car was rotated at an angle of 48.3°
- Pressure Contour
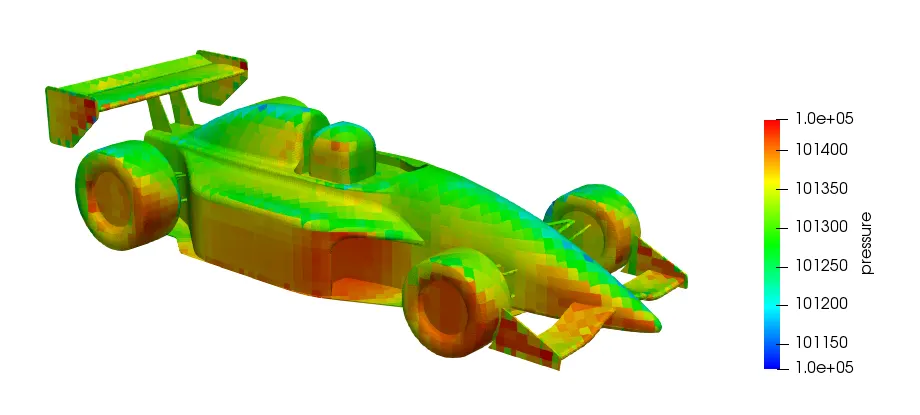
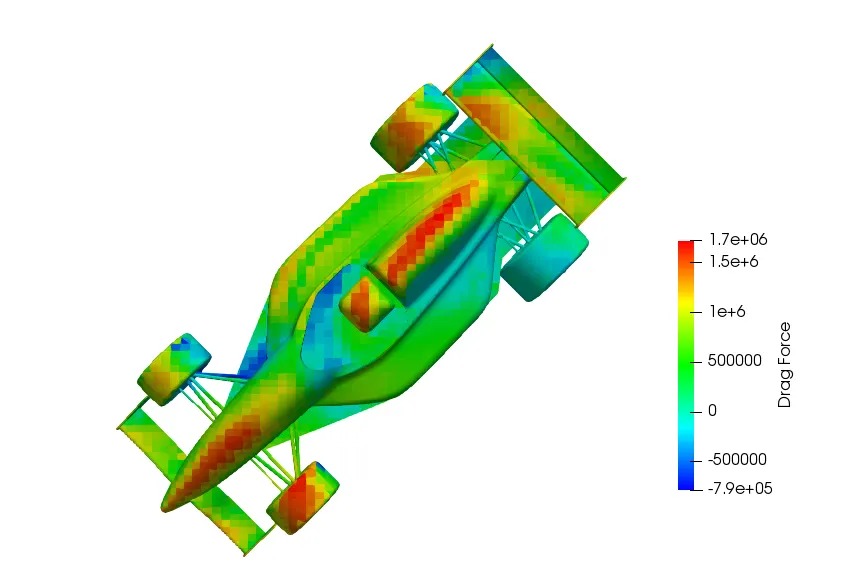
- Downforce and Drag force Contours
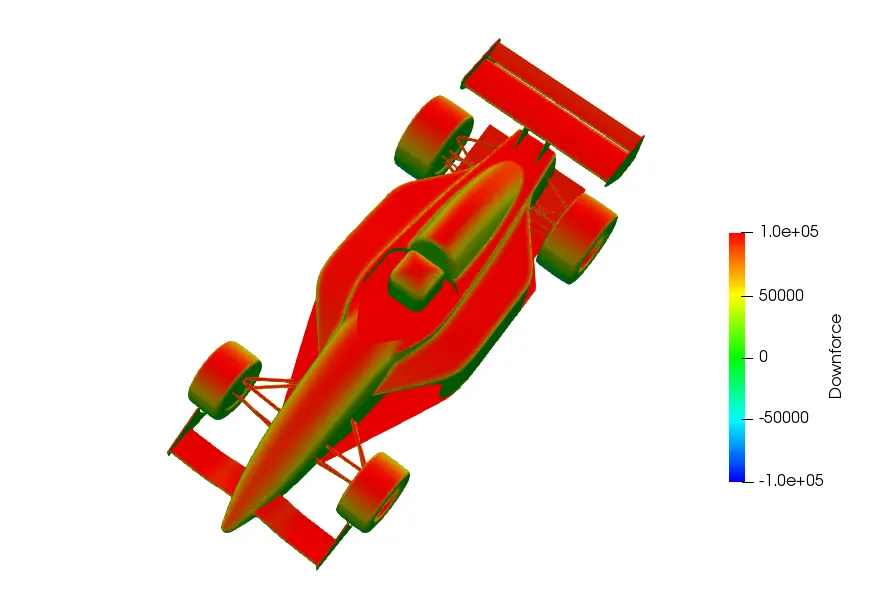
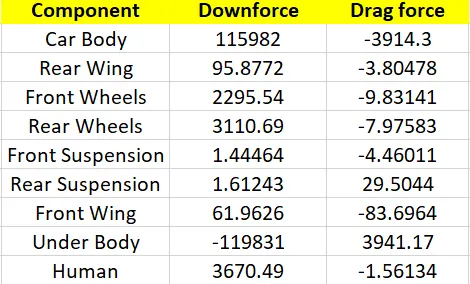
- Drag and Downforce were calculated from ParaView
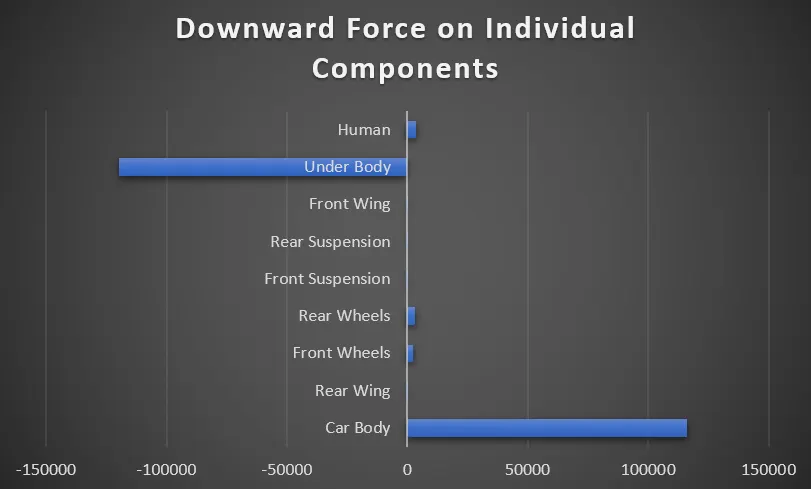
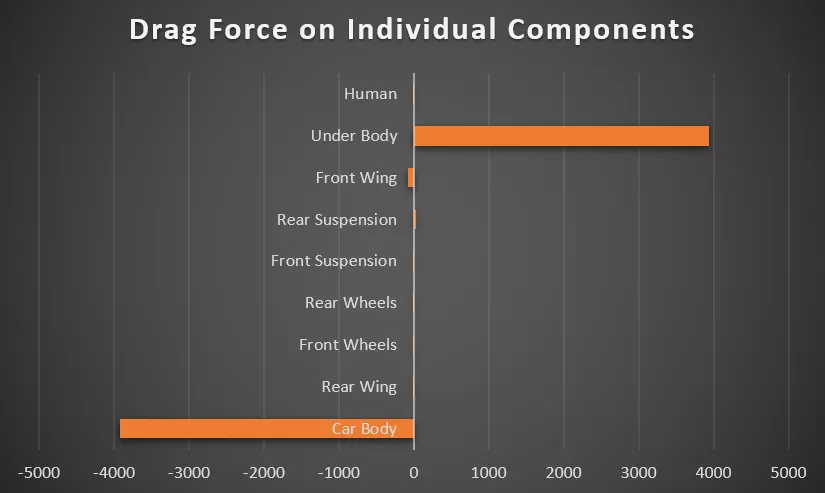
- Graph of distribution of downforce and drag force on individual components
- Animation of flow over FSAE Car
CONCLUSIONS:
- From the bar graphs, it is observed that the body contributes to the maximum downforce generated and the rear wing hardly contributes to the downforce generation, therefore to make the rear wing contribute to the downforce generation the angle of the rear wing can be increased.
- Since the front wheels cause a lot of pressure drag and contribute a lot to aerodynamic quality, the front wing design can be modified to create vortices that deflect the flow away from the wheels.
- Since the suspension links are small they won't contribute to the pressure drag which is good.