Frequency Analysis of a rotating shaft
Frequency Analysis of Rotating Shaft
Objective:
To perform frequency analysis on rotating shaft for a given material.
Introduction:
Simulation is the process of predicting the component’s behavior under given set of boundary conditions.
Solid works simulation
SOLIDWORKS Simulation offers an easy to use of stress analysis tool. Simulation can help you reduce cost and time by testing designs on the computer instead of expensive and time-consuming field tests. It also highlights critical areas of stress or deformation and safety levels at various regions. Based on these results strengthening of unsafe regions and removal of material from overdesigned areas can be done.
The accuracy of these results depends on fixtures, loads, and material properties. For results to be valid or accurate, the specified material properties must accurately represent the part material, and the fixtures and loads must accurately represent the part working conditions.
Types of Simulation in Solidworks:
- Static simulation
Static studies provide tools for the linear stress analysis of parts and assemblies which are loaded by static loads. Stress or static analysis calculates the displacements, strains, and stresses in a part based on material properties, fixtures, and loads. A material fails when the stress reaches beyond strength of material given in analysis. Different materials fail at different stress levels. Simulation uses linear static analysis, based on the Finite Element Method, to calculate stresses.
- Buckling simulation
Buckling studies analyze the performance of the thin parts loaded in compression to undergo sudden large lateral deformation at certain load levels. Buckling can also occur before the material fails due to high buckling stresses.
Buckling can occur globally or locally. SOLIDWORKS Simulation helps you avoid buckling failure by calculating minimum loads that cause buckling.
- Frequency simulation
Frequency studies in Solidworks offer tools for the analysis of the natural modes of vibration and frequencies. This is essential in the design of many components that are loaded in both static and dynamic ways.
A body disturbed from its rest position tends to vibrate at certain frequencies called natural, or resonant frequencies. For each natural frequency, the body takes a certain shape called mode shape
Resonance is the excessive response that occurs when a body is subjected to a dynamic load vibrating at one of its natural frequencies. For example, a car with an out-of-balance tire shakes violently at a certain speed due to resonance. The shaking decreases or disappears at other speeds.
Frequency analysis calculates the natural frequencies and the associated mode shapes. Frequency analysis can help you avoid resonance by calculating the resonant frequencies.
- Thermal simulation
Heat transfer is the transmission of thermal energy from one region to another as a result of a temperature difference. Thermal studies in solidworks offer tools for the analysis of the heat transfer by means of conduction, convection, and radiation. Temperature changes can induce significant stresses in the body. Thermal stress analysis calculates thermal stresses, thermal strains, and displacements due to temperature difference.
- Drop test
Drop test studies are used to analyze the stress of moving parts or assemblies impacting an obstacle. Drop test studies will evaluate the effect of dropping the model on a rigid floor. You specify the dropping height or the velocity at the time of impact in addition to gravity, and SOLIDWORKS Simulation solves the dynamic problem as a function of time. After the analysis, plots and graphs of the response of the model as a function of time can be done.
- . Optimization Studies
Optimization studies are applied to improve (optimize) for the initial design based on a set of selected criteria such as maximum stress, weight, optimum frequency, etc
- Fatigue Analysis
Fatigue studies analyze the resistance of parts and assemblies loaded repetitively over long periods of time. Repeated loading and unloading weakens objects over time, even when the induced stresses are considerably less than the allowable stress limits. Fatigue analysis evaluates the effect of cyclic loads on the model.
- Nonlinear Analysis
Nonlinear studies in solidworks will provide tools for analyzing stress in various parts and assemblies that experience severe loadings and/or large deformations. Nonlinear analysis can be used when the assumptions of linear static analysis are not valid.
For example, if the material behavior is nonlinear, deformations are large, or loads or fixtures vary with respect to time.
- Dynamic analysis
Dynamics studies analyze objects forced by loads that vary in time. Use dynamic analysis when inertial or damping effects must be considered.it perform linear (small structural deformations, basic material models) and nonlinear (large structural deformations, severe loadings, and advanced materials) of systems subjected to dynamic loading environment, including base excitations.Typical examples could be shock loads of components mounted in vehicles, turbines loaded by oscillatory forces, aircraft components loaded in random fashion, etc.
Steps Involved in an Analysis:
The basic steps involved in any finite element analysis consist of the following
Preprocessing Phase: Preprocessing also called as Meshing is the first step in solving a problem in Finite Element Analysis.
- Create and discretize the solution domain into finite elements (subdividing the problem into nodes and elements).
- Assume a shape function which represent the physical behavior of an element. An approximate continuous function is assumed to represent the solution of an element.
- Develop mathematical equations for an element.
- Assemble the elements to present the entire problem and construct the global stiffness matrix.
- Apply boundary conditions, initial conditions, and loading.
Solution (Processing) Phase:
- Solve a set of linear or nonlinear algebraic equations simultaneously to obtain nodal results, such as displacement values at different nodes in static problem or temperature values at different nodes in a heat transfer problem.
Post processing Phase:
- Obtain the other important information like values of principal stresses, heat fluxes, strains, etc.
Frequency Analysis:
The Frequency Analysis simulation type allows the computation of natural (under no external load excitation) frequencies of oscillation of a structure and the corresponding oscillation mode shapes. The resulting frequencies and deformation modes are dependent on the geometry and material distribution of the structure, with or without the displacement constraints.
The results from a frequency analysis enable to evaluate the overall rigidity of the structure, as well as the rigidity of local regions. The lower frequencies of oscillation can be used as input for the seismic or wind load assessment and computation of structures. Also, in parts and structures subjected to variable frequency loads, the fundamental frequencies are used to avoid resonance between the natural oscillation modes and the applied load.
Resonance Frequency:
Sound is an acoustic wave that causes molecules to vibrate. When projected from a source, the vibration traverses through the air onto the physical structure of the glass. If the acoustic frequency of the sound matches the natural frequency of the glass, the latter starts to vibrate at a larger amplitude, potentially disintegrating its structure.
In other words, the glass could possibly break when it’s vibrating at its resonant frequency. The resonant frequency can also be defined as the natural frequency of an object where it tends to vibrate at a higher amplitude
E.G. Structural Vibration and Resonance Structural vibration occurs when dynamic forces generated by compressors, pumps, and engines because the deck beams to vibrate. This vibration leads to piping failures, poor equipment reliability, and safety concerns. The vibration is due to the structure being mechanically resonant. The term “resonance” occurs when dynamic forces coincide with the natural frequencies of the supporting structure. At resonance, the forces are amplified up to 20 times, and cause deck beams to vibrate above safe operating limits.
Analysis Setup:
The simulation is carried out using following setup:
- A bearing support is applied at both ends of the shaft.
- The material used for this simulation is Alloy Steel.
Properties of Alloy Steel:
|
Property |
Value |
|
Elastic Modulus |
210 GPa |
|
Shear Modulus |
79 GPa |
|
Tensile Strength |
724 MPa |
|
Yield Strength |
620 MPa |
|
Poisson’s Ratio |
0.28 |
Volumetric Properties of Rotating Shaft:
|
Property |
Value |
|
Mass (Kg) |
0,397785 |
|
Weight (N) |
3,89829 |
|
Volume (m3) |
5,16603e-05 |
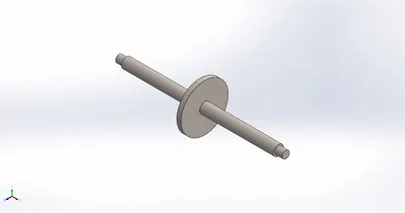
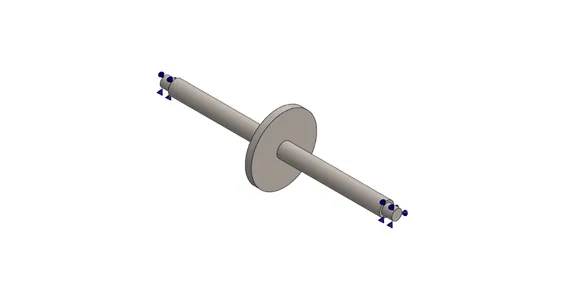
Rotating Shaft
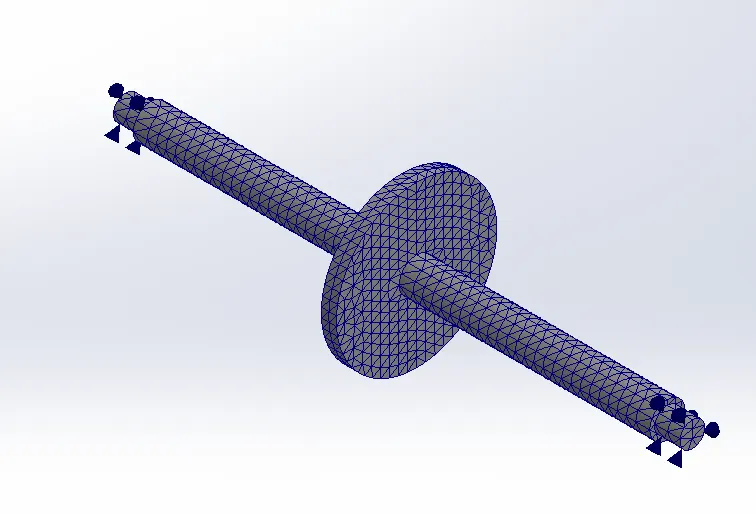
Mesh Properties:
|
|
Shaft |
|
Mesh type |
Solid Mesh |
|
Total Nodes |
12404 |
|
Jacobian points for High quality mesh |
16 |
|
Total Elements |
7267 |
|
Element Size |
3,72559 mm |
|
Tolerance |
0,18628 mm |
Mode Shapes:
|
Name |
Type |
Min |
Max |
|
Amplitude1 |
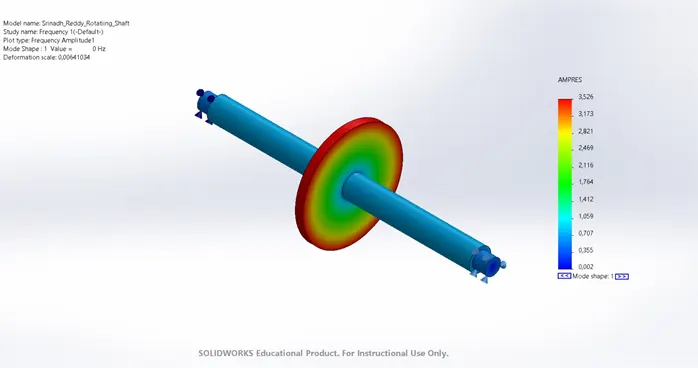
AMPRES: Resultant Amplitude Plot for Mode Shape: 1(Value = 0 Hz) |
0,002 Node: 1340 |
3,526 Node: 279 |
 |
|||
|
Name |
Type |
Min |
Max |
|
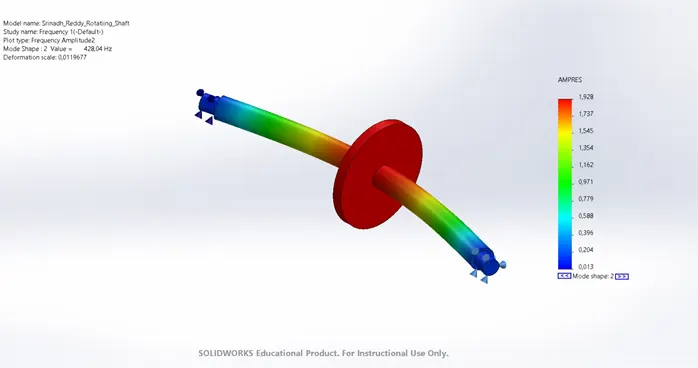
Amplitude2 |
AMPRES: Resultant Amplitude Plot for Mode Shape: 2(Value = 428,036 Hz) |
0,013 Node: 1738 |
1,928 Node: 1302 |
 |
|||
|
Name |
Type |
Min |
Max |
|
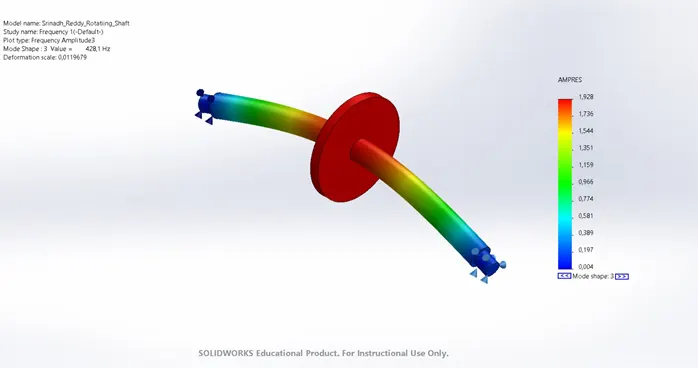
Amplitude3 |
AMPRES: Resultant Amplitude Plot for Mode Shape: 3(Value = 428,102 Hz) |
0,004 Node: 651 |
1,928 Node: 1302 |
 |
|||
|
Name |
Type |
Min |
Max |
|
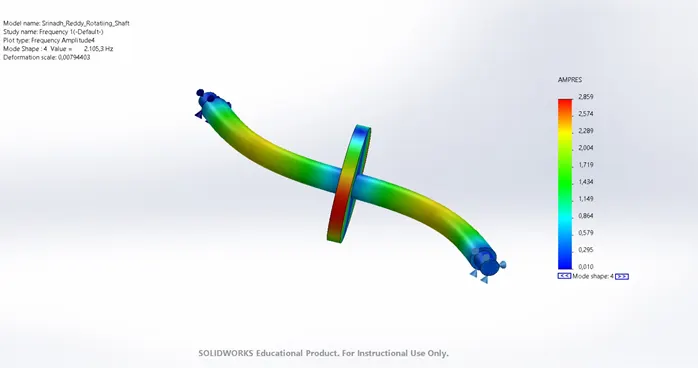
Amplitude4 |
AMPRES: Resultant Amplitude Plot for Mode Shape: 4(Value = 2.105,3 Hz) |
0,010 Node: 2721 |
2,859 Node: 756 |
 |
|||
|
Name |
Type |
Min |
Max |
|
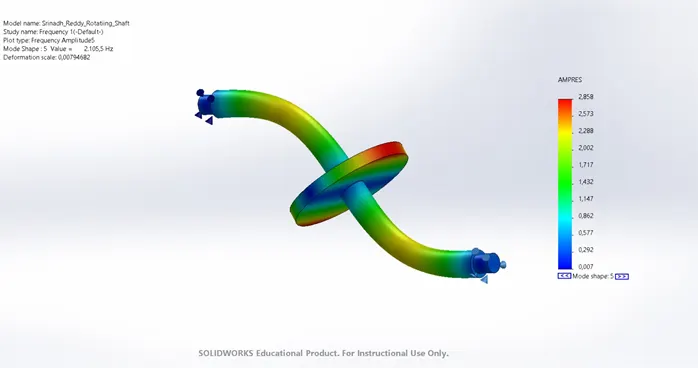
Amplitude5 |
AMPRES: Resultant Amplitude Plot for Mode Shape: 5(Value = 2.105,51 Hz) |
0,007 Node: 2109 |
2,858 Node: 6353 |
 |
|||
Mode List:
|
Frequency Number |
Rad/sec |
Hertz |
Seconds |
|
1 |
0 |
0 |
1e+32 |
|
2 |
2.689,4 |
428,04 |
0,0023363 |
|
3 |
2.689,8 |
428,1 |
0,0023359 |
|
4 |
13.228 |
2.105,3 |
0,00047499 |
|
5 |
13.229 |
2.105,5 |
0,00047495 |
Mass Participation:
The effective mass participation factor represents the percentage of the system mass that participates in a particular mode. It provides a measure of the energy contained within each resonant mode. A mode with a large EMPF is usually a significant contributor to the dynamic response of a system.
|
Mode Number |
Frequency(Hertz) |
X direction |
Y direction |
Z direction |
|
1 |
0 |
9,5145e-32 |
2,9879e-10 |
2,2516e-10 |
|
2 |
428,04 |
5,5011e-12 |
0,035356 |
0,8245 |
|
3 |
428,1 |
1,8671e-10 |
0,82451 |
0,035357 |
|
4 |
2.105,3 |
8,0856e-10 |
3,6113e-10 |
4,107e-10 |
|
5 |
2.105,5 |
9,865e-09 |
3,0759e-09 |
1,8161e-12 |
|
|
|
Sum X = 1,0866e-08 |
Sum Y = 0,85987 |
Sum Z = 0,85986 |
Conclusion:
From the simulation, the resonance frequencies are found to be 0, 428,04 Hz, 428,1 Hz, 2105,3 Hz, 2105,5 Hz.