Flow over a cylinder
EXTERNAL FLOW SIMULATION OF A SOLID PIPE USING SOLIDWORKS
1. INTRODUCTION
Computational Fluid Dynamics
Computational Fluid Dynamics (CFD) is presented as a powerful tool to support the design and optimization of microfluidic reactors. It is a fast, accurate, and reliable method of analyzing the variation of hydrodynamic properties of the flow over and within a body. Computational Fluid Dynamics (CFD) is a branch of fluid mechanics that uses numerical methods and algorithms to solve complex problems involving fluid flow.
CFD simulation was applied to analyze the dynamic behavior of stirred systems with different impeller geometries. An offline video processing method was developed to compute the mixing time and validate simulation results. The CFD simulation results and the video processing based mixing times were compared to the naked eye experiment.
Reynold's Number
Reynolds number can reveal whether the flow is laminar or turbulent. The transition from laminar to turbulent flow depends on the surface roughness, flow velocity, geometry, surface temperature, and type of fluid, among others.
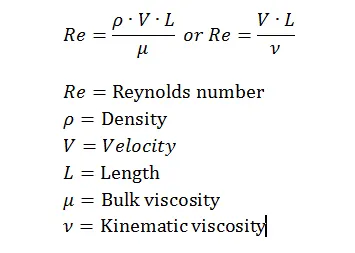
The present study aims to analyze the fluid flow over a cylinder and calculate Reynold's number for baseline simulation and increase the calculated Reynolds number to a factor of 20%, 40%, & 100% and perform the simulation for all the three values of Reynold's number and create an animation file for velocity-pressure.
2. AIM
To do a CFD analysis of a cylinder in which external flow takes place by running a baseline simulation and then calculating the Reynolds number and the simulation end time. During this study, the Reynolds number is increased by a factor of 20%, 40%, and 100% then runs the transient flow simulation.
3. 3D MODEL
In this study, a cylinder of 0.04m diameter is created in SOLIDWORKS software. The design parameters are as follows
Diameter of the cylinder = 0.04 m
Length of the cylinder = 0.2 m
4. BASELINE SIMULATION PARAMETERS
Initially, I considered the baseline velocity of air to be 10m/s. On the basis of initial velocity, Reynolds number is calculated.
Parameters
|
INPUTS |
VALUES |
|
Diameter |
0.04 |
|
Initial Velocity |
5 m/s |
|
Density |
1.225 kg/m3 |
|
Dynamic Viscosity |
18.14x10⁻⁶ Ns/m2 |
Re = rho*V *D/µ
Re = rho*V*D/mu
D = cylinder diameter
µ = dynamic viscosity
Rho = density
By substituting the above values we get, the baseline case Reynolds number,
Re = 13506.06
Similarly, Reynold's number at 20, 40 and 100 % is calculated,
At 20% Re = 16207.27
At 40% Re = 18908.48
At 100% Re = 27012.12
Conducting the Baseline simulation
Table 1.2: Baseline simulation condition
|
INPUT |
VALUES |
|
Analysis type |
External Flow |
|
Fluid |
Air |
|
Time-Dependent |
Total Analysis Time: 0.1s |
|
Output time step: 0.01s |
|
|
Inlet Velocity |
10 m/s |
|
Global Mesh Level |
3 |
5. CALCULATING SIMULATION END TIME
Velocity = Distance / time
Time = Distance / velocity i.e. Time = 0.4/5 = 0.08 sec
The length of the domain along the X axis is 0.40 m
When the Velocity is 5 m/s for Re = 13506.6
Given that the end time should be 2 times the flow-through time
Then Simulation end time = 0.16 sec
- At Baseline for V = 5 m/s, Re = 13506.6, Simulation end time = 0.16sec
- At 20% For V = 6 m/s, Re =16207.27, Simulation end time = 0.133 sec
- At 40% For V = 7 m/s, Re = 18908.48, Simulation end time = 0.114 sec
- At 100% For V = 10 m/s, Re = 27012.12, Simulation end time = 0.08 sec
From this we can see that the Velocity increases the time decreases.
6. RESULTS
Flow over a cylinder at Baseline Velocity 5m/s
- Cut Plot of Velocity contour
Animation
- Cut Plot for Pressure
Animation
Case 1: Flow over a cylinder at 20% of Reynolds Number (i.e. at 6 m/s)
- Cut Plot of Velocity contour
Animation
- Cut Plot of Pressure contour
Animation
Case 2: Flow over a cylinder at 40% of Reynolds Number (i.e. at 7m/s)
- Cut Plot of Velocity contour
Animation
- Cut Plot of Pressure contour
Animation
Case 3: Flow over a cylinder at 100% of Reynolds Number (i.e. at 10m/s)
- Cut Plot of Velocity contour
Animation
- Cut Plot of Pressure contour
Animation
7. CONCLUSION(OBSERVATION)
- Velocity increases and the flow-through time decreases as Reynold's number increases.
- The flow-over the cylinder becomes steady as the velocity or Renold's number increase and the velocity plot at 20% and 40% exhibit a slight unsteady plot whereas at 100% the flow is steady and we can draw a clear understanding of the flow when velocity is increased.
- It is found that the pressure is mainly acting of the frontal area of the cylinder and there is no significant change in the pressure plot.