Flow over a bicycle
Objective: To write a Matlab program to calculate drag force against a cyclist
Description:
Drag Coefficient:
The drag coefficient quantifies the resistance of an object in a fluid environment. It is not an absolute constant for a body’s shape because it varies with the speed and direction of flow, object shape and size, and the density and viscosity of the fluid.
The lower the drag coefficient of an object, the less aerodynamic or hydrodynamic drag occurs. In terms of a car, the lower the drag coefficient, the more efficient the car is. As well as affecting the top speed of a vehicle, the drag coefficient also affects the handling. Cars with a low drag coefficient are sought after, but decreasing the drag drastically can reduce the downforce and lead to loss in road traction and a higher chance of car accidents.
`F_d = 1/2 * rho A V^2 * C_d`
where, Cd= Drag coefficient
Fd= Drag force
ρ= Density
A= Area
V= Velocity
Let us consider,
The upright position is frequently used during utility cycling gives a frontal area of 0.5 m2 and a drag coefficient of 1.1 with a cycling speed of 2.77m/s.
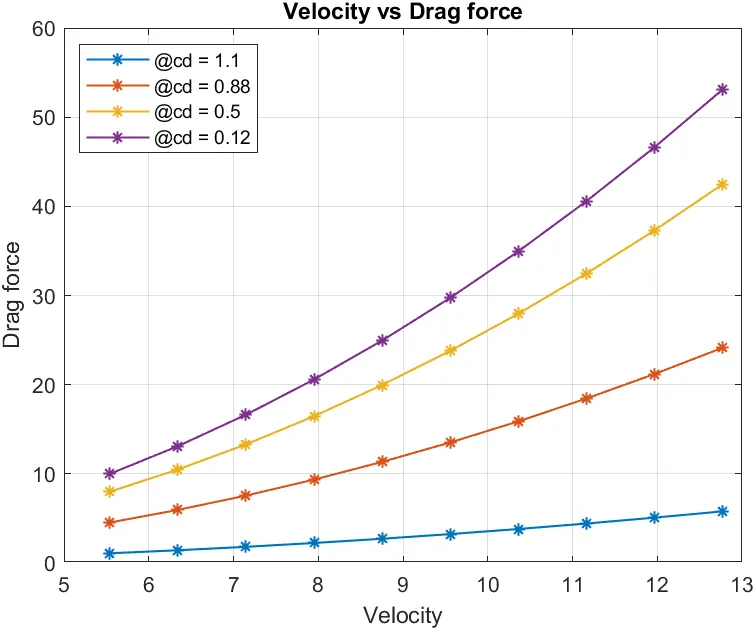
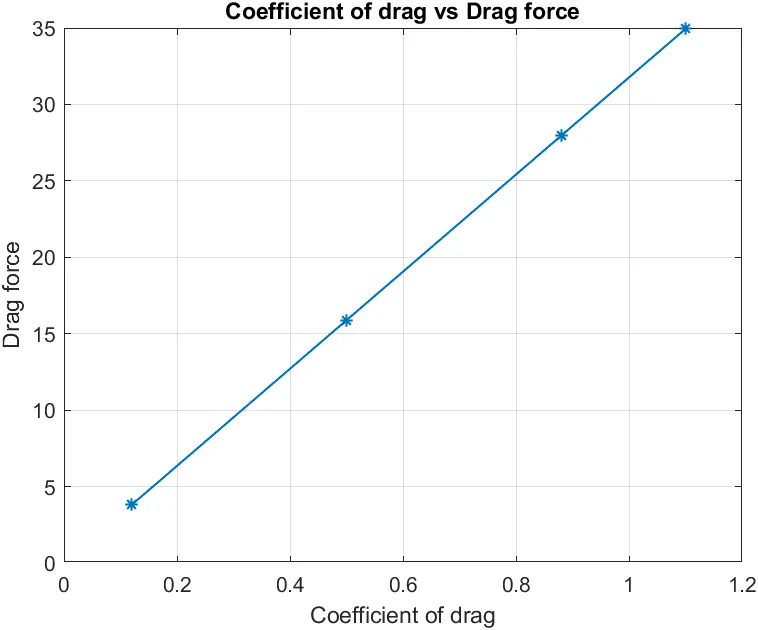
To find the change in drag force with respect to velocity and Drag coefficient let us take different velocities and drag coefficients with same frontal area.
Say,
v = [2.7700, 3.6933, 4.6167, 5.5400] &
cd= [1.1, 0.88, 0.5, 0.12]
MATLAB code with explanation:
%Flow over bicycle

%Initial conditions
cd = [0.12,0.5,0.88,1.1];           %Coefficient of drag
rho = 1.1839;                       %Density of air at 25°C (Kg/m^3)
a = 0.5;                            %Frontal area of Rider+Cycle (m^2)
v = linspace(12.7700,5.5400,10);     %Velocity of cycle (m/s)

for i=1:length(cd)
%Formula to calculate Drag force
Fd = 0.5*cd(i)*rho*a*v.^2
figure(1)
plot(v,Fd,'-*','linewidth',1)
hold on
grid on
xlabel('Velocity')
ylabel('Drag force')
title('Velocity vs Drag force')
legend('@cd = 1.1','@cd = 0.88','@cd = 0.5','@cd = 0.12','location','northwest')
end

for i=1:length(cd)
%Formula to calculate Drag force
Fd = 0.5.*cd*rho*a*v(j)^2
figure(2)
plot(cd,Fd,'-*','linewidth',1)
grid on
xlabel('Coefficient of drag')
ylabel('Drag force')
title('Coefficient of drag vs Drag force')
end
Output:
Conclusion:
1. As the velocity is increasing, Drag force is increasing in a parabolic manner.
2. As the Drag coefficient is decreasing, Drag force is decreasing.