Final Project: Electric Rickshaw modelling
Aim:-
To study Electric rickshaw modelling
Software used:
MATLAB R2021a_simulink
Objective:
Create a detailed MATLAB model of an electric rickshaw (three wheel passenger vehicle) as per details below:
Rear wheels driven by PM brushed type motor
Assume efficiency points of motor controller and motor
Make an excel sheet of all input and assumed data
Results: For any three standard driving cycles show energy consumption, temperature rise of motor and controller for 100 km constant speed driving at 45 kmph.
Introduction:
- The electric E- rickshaw is aslo know as the electric tuk-tuk e-rickshaw and aslo auto tgis are becoming popular in the indain market
- This E- rickshaw is the best alternative to the petrol or CNG gas auto rickshaw because of there low fuel cost zero emissions and less human effort
- The electric system mainly designed in the indian is 48v Dc which can run 90-100km/full charge
- The top speed is 25km/hr and this electric motor power ranging from the 650-1400w
- The battery takes 8-10hrs to fully charged the seating capacity is driver+ 4 passengers so total 5
- Here our main objective of this project is to obtain the speed by the driver to estimate the temperature of the motor and controller to calculate the SOC and distance travel by the vehicle
- Here we have SOC block to calculate the sate of charge of the battery distance is calculated by speed and time paramter for all the three drive cycles
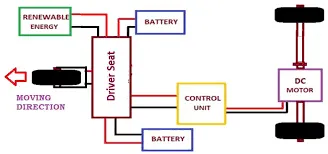
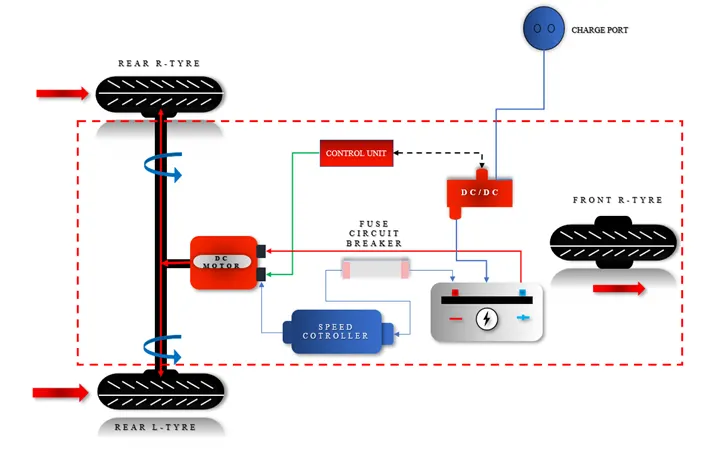
Electric rickshaws (also known as electric tuk-tuks or e-rickshaws or toto or e-tricycles) are small 3-wheeled vehicles powered by an electric motor and battery ranging from 650 to 1400 Watts. They save on fuel costs compared to auto rickshaws while offering greater ease-of-use than pulled rickshaws.
This has led to their popularity and widened-acceptance in some cities since 2008.If introduced in a systematic manner, electric rickshaws could be a low-emitter complementary transport for low-income people who suffer most from a lack of transport facility.
They are mostly manufactured in India and China.vElectronic rickshaws have now transitioned from being a market entrant in the automobile industry of India to a leading short-distance transport solution.This segment gained popularity between 2015 and 2018
Vehicle Parameters :
Drive train : Pure Electric Vehicle
Vehicle Type : E-Auto
Battery Pack : Li-ion Battery Pack (7.37 kWh)
Nominal Voltage : 48 V
Motor : 8 kW (Rated Power) DC Motor
Vehicle Kerb Weight : 377 Kg
Payload : 300 Kg
Width : 1.765 m
Height : 1.595 m
Dimensions - Length x Width x Height : 2.769 x 1.35 x 1.75 m
MATLAB / Simulink Model:-
The MATLAB model has five components :
1. Vehicle Body : It includes the vehicle body, tires and gear
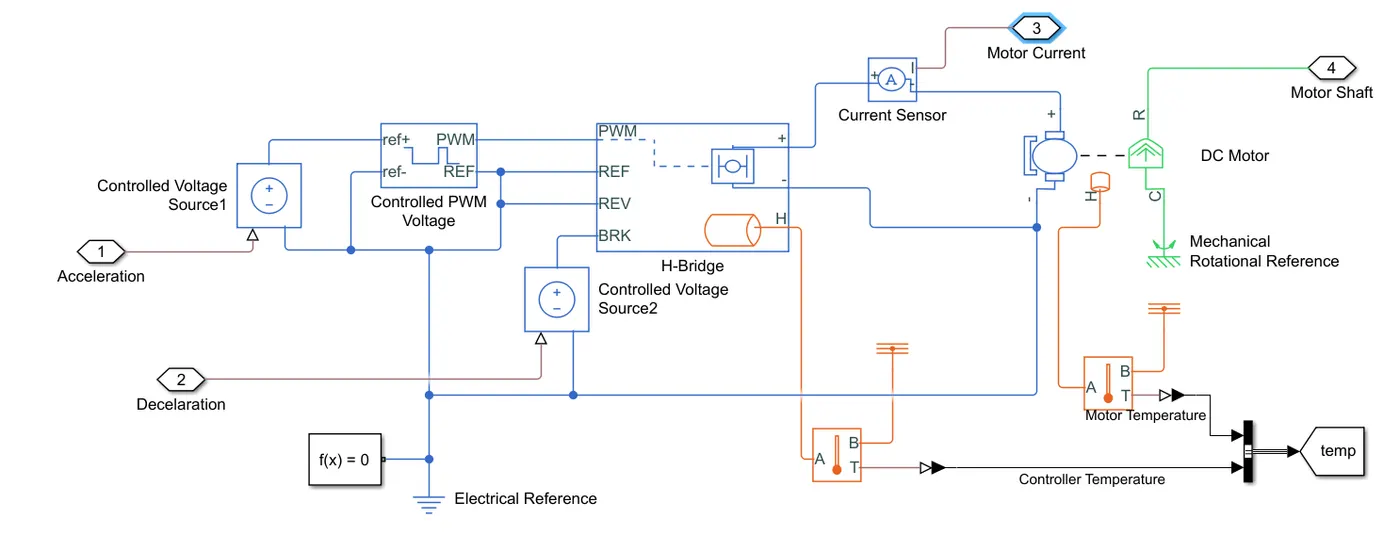
2. Electrical System: It includes the power converter and dc motor
3. Battery : It includes calculation of State of Charge and battery model
4. Driver: It includes the control of throttle based on driving cycle
5. The drive cycle.
MATLAB model: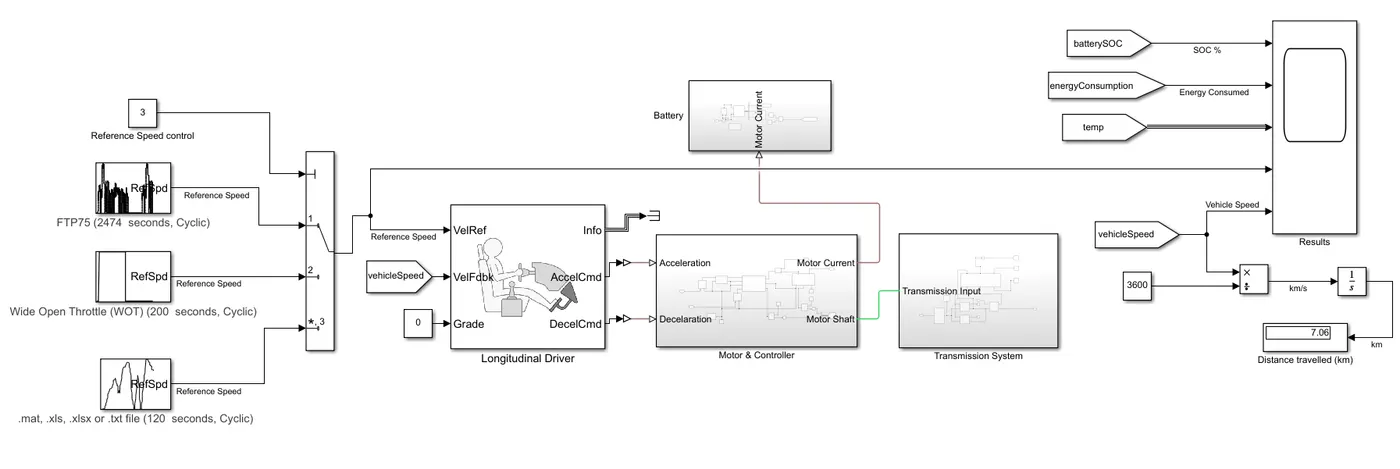
1. Vehicle Dynamics
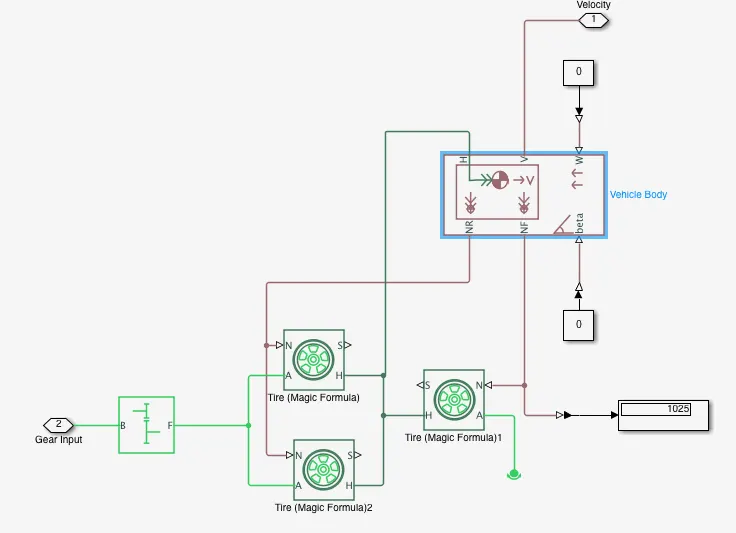
The vehicle body has the total mass of 377 Kg. There is one rear axel connected to the gear with two wheels. The front wheel is free to rotate. The frontal area of the vehicle is 2.365 m^2 for the calculation of drag force. H is the connection or horizontal movement of vehicle. W is the road incline angle, which we have taken as 0. The outputs are V or the velocity, in m/s. NF and NR are the front wheel and rear wheel force.
Block Diagram:
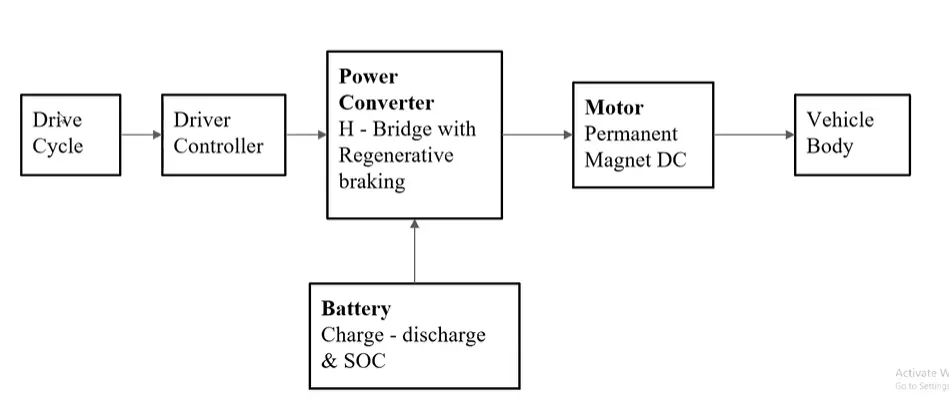
In the designed Electric Rickshaw main blocks are Battery, drive cycle, controller, DC Motor, Vehicle body & Transmission system. Drive cycle is the input data like how a human drive his actual vehicle here FTP75, WOT & Excel (Manually Prepared in Excel sheet) drive cycles are used to make the designed vehicle to give the output how it reacts to the drive cycle.
The main objective is to obtain the speed by the driver, to estimate the temperature of Motor and Controller, to estimate the sates of charge (SOC), distance travelled by the vehicle. There is a SOC block that will estimate the state of charge of a battery, distance is calculated by speed and time parameters for all the three Drive cycles.
Drive Cycle:
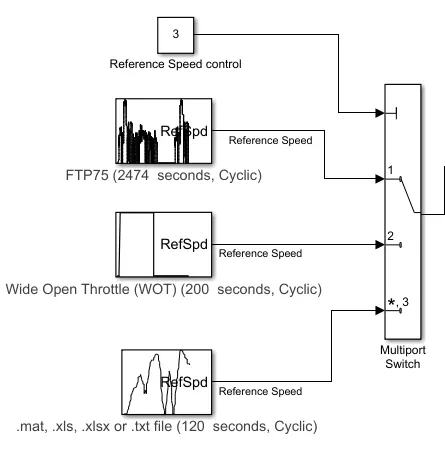
Drive cycle is assumed as the driver's input of a vehicle, it replaced how a driver will drive a vehicle. Here I have used three drive cycles which is used to test the vehicle performances. These drive cycle will have high speed, low speed, braking conditions in it. There are different drive cycles like WOT, FTP75 etc., Here in this model I have used FTP 75, WOT & Manually prepared in excel Drive Cycle source.
Motor & Controller:
Battery:
SOC Battery:
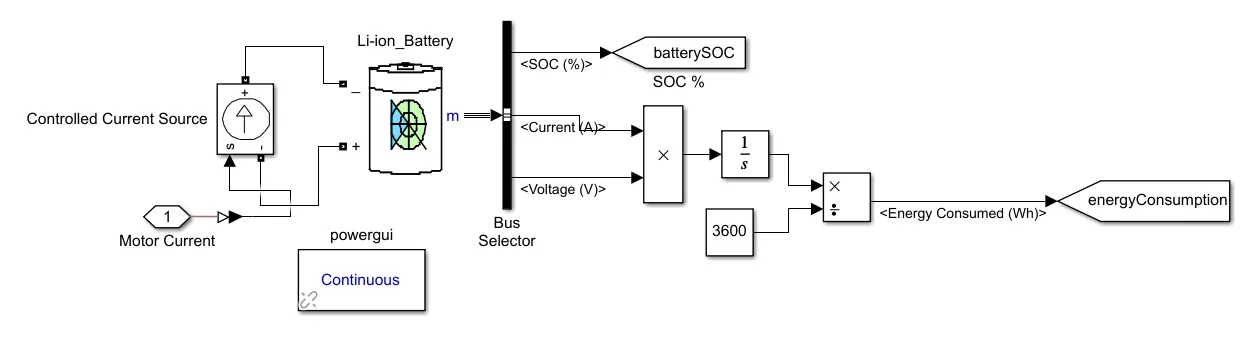
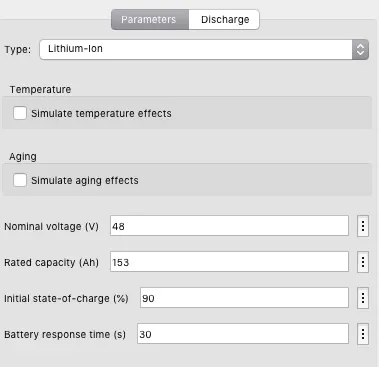
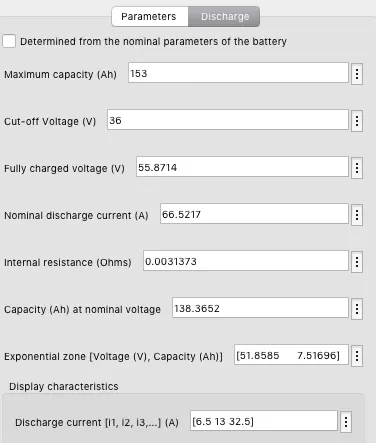
Here a rechargeable Li-ion battery pack is used. The battery SOC is calculated using the current flow through the battery.
This is represented by a current source. The nominal voltage of the Li-ion battery as calculated to be 48 V at 90% SOC. The rated capacity of the battery is 153 Ah. The battery parameters can be seen in Fig 12.
5. Drive Cycle :
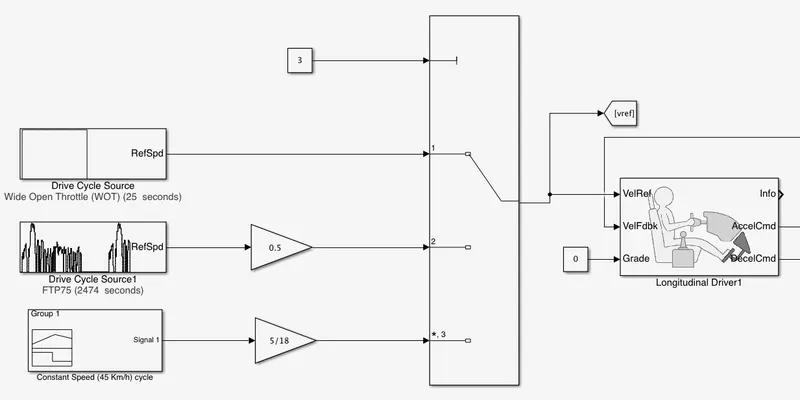
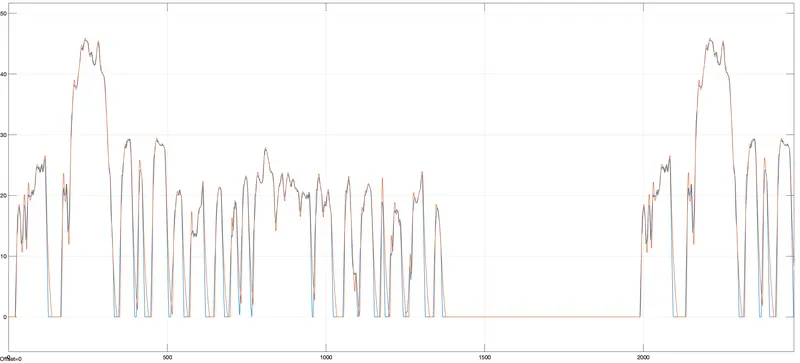
Here three driving cycles are considered. A manual switch is used to change the driving cycles. First Wide Open Throttle (WOT) cycle is tested. Next, Modified FTP75 drive cycle is used for simulation. This cycle runs for 2474 sec. The maximum speed is 45.6 Km/h and average speed is 12.9 Km/h. There are 22 stops in the cycle.
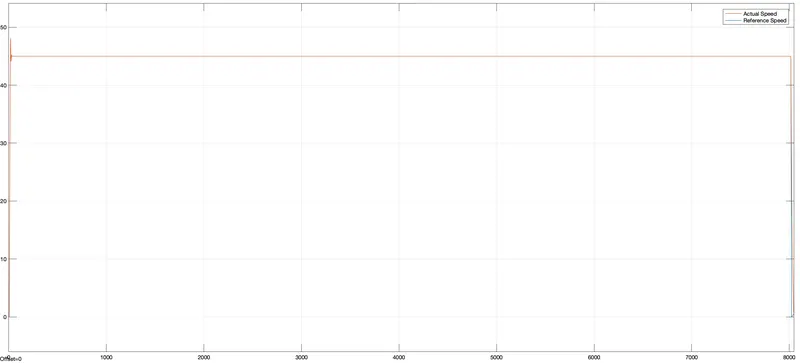
Final cycle tested is the constant speed driving cycle of 45 Kmph. For this the input is created using a signal builder block.
RESULTS
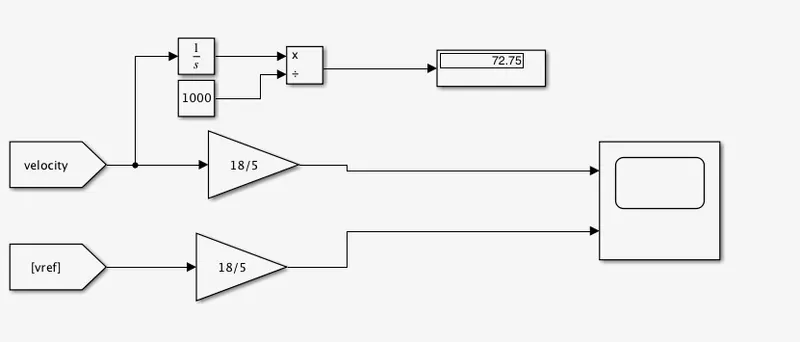
The actual speed and the reference speed from drive cycle are compared here in Kmph. For each driving cycle, the distance covered is measured in Km as shown in Fig 15. The controller is working for most of the driving cycle.
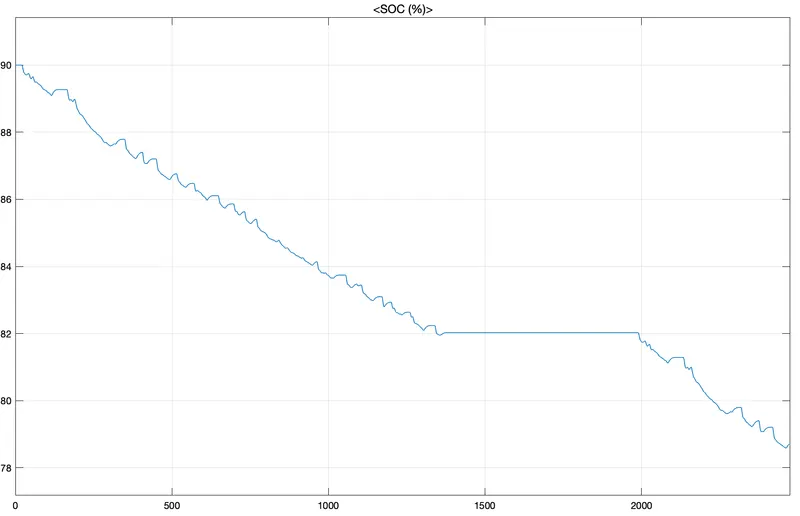
The controller needs to be further tuned for better speed control. Moreover, physical brakes have not been implemented in the model, so, the vehicle takes more time to decelerate. Further, foe each driving cycle, the battery SOC% and voltage are also plotted.
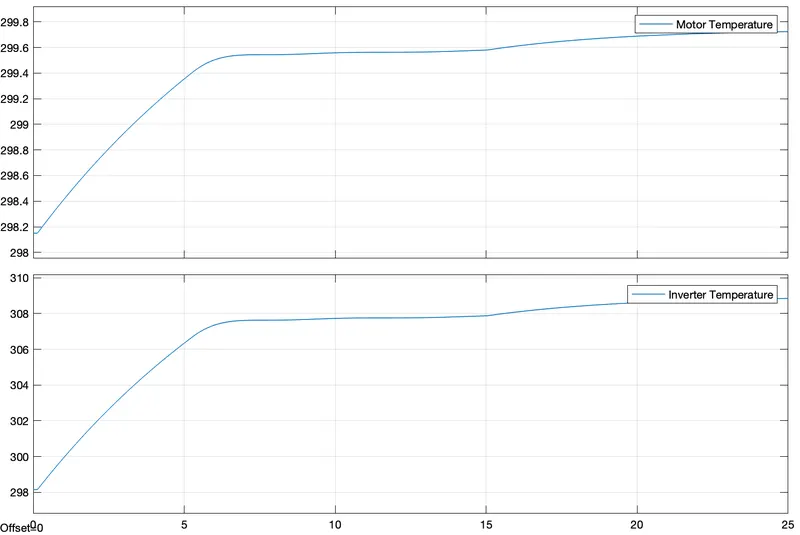
The energy consumption and the motor and controller temperature variation are also shown for each driving cycle.
1. Wide Open Throttle (WOT) Test
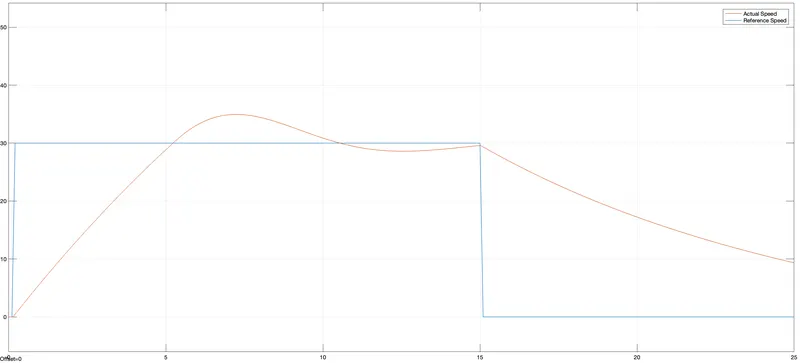
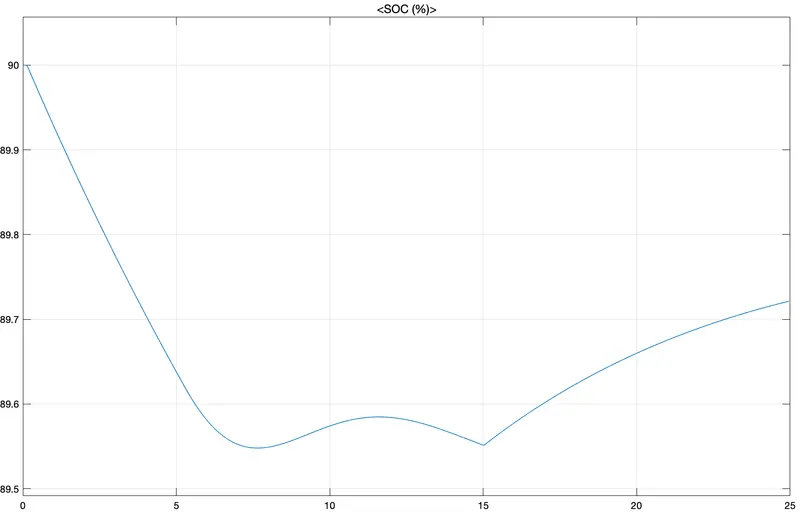
Velocity profile for WOT driving cycle
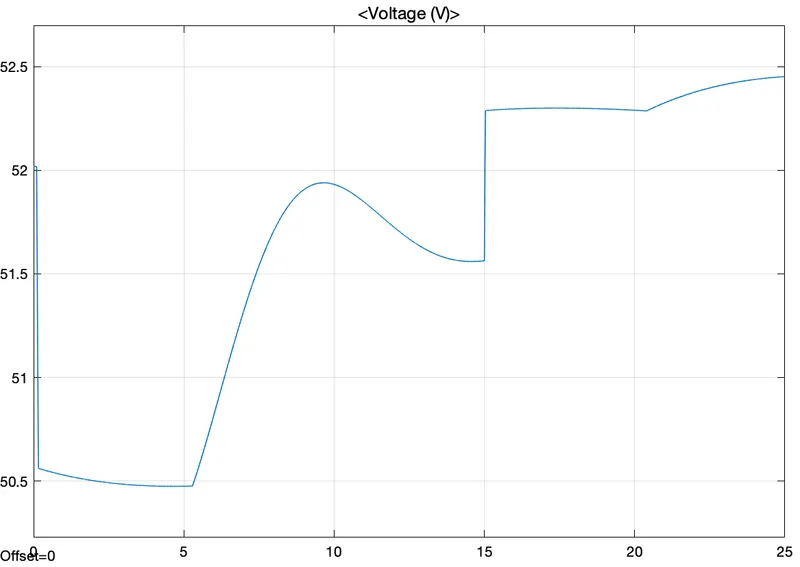
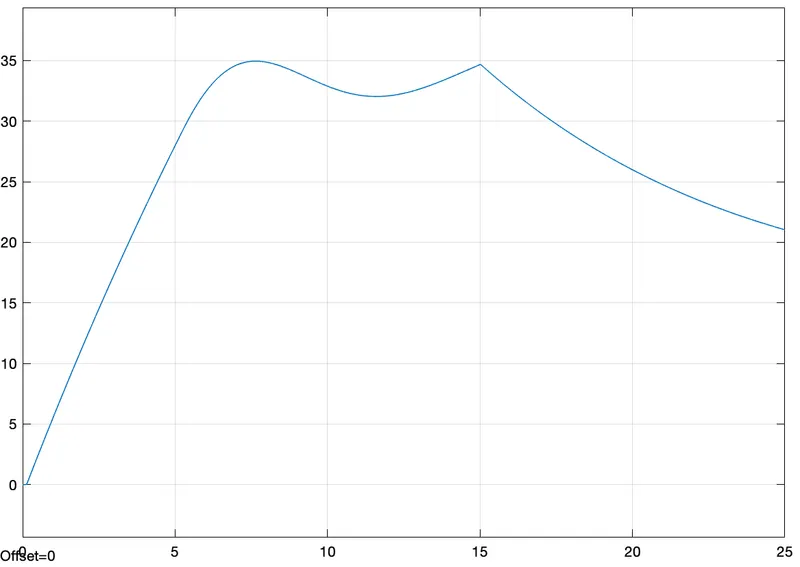
Battery voltage for WOT driving cycle
2. FTP75 Driving Cycle
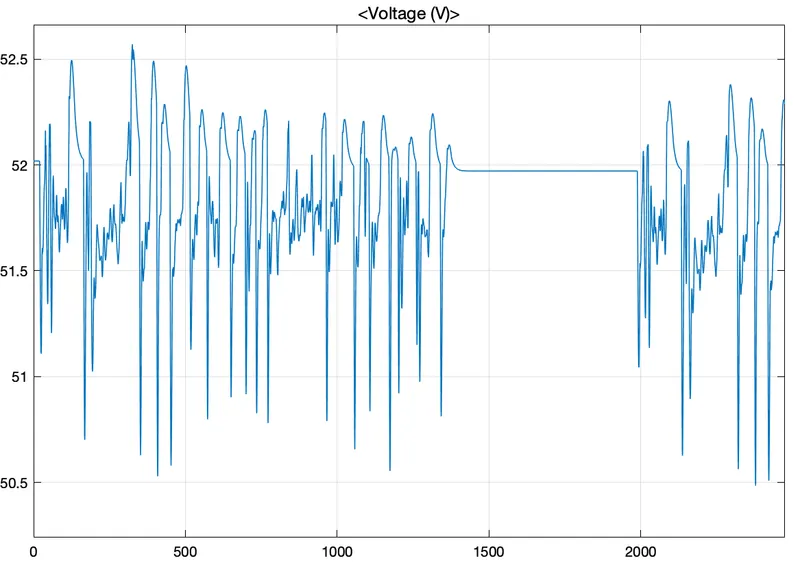
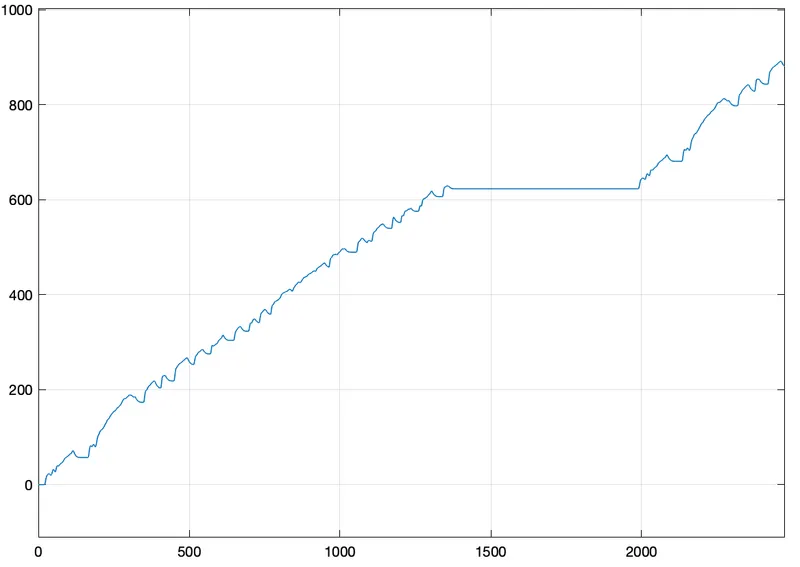
Battery voltage for FTP75 driving cycle
3. Constant Speed Driving Cycle
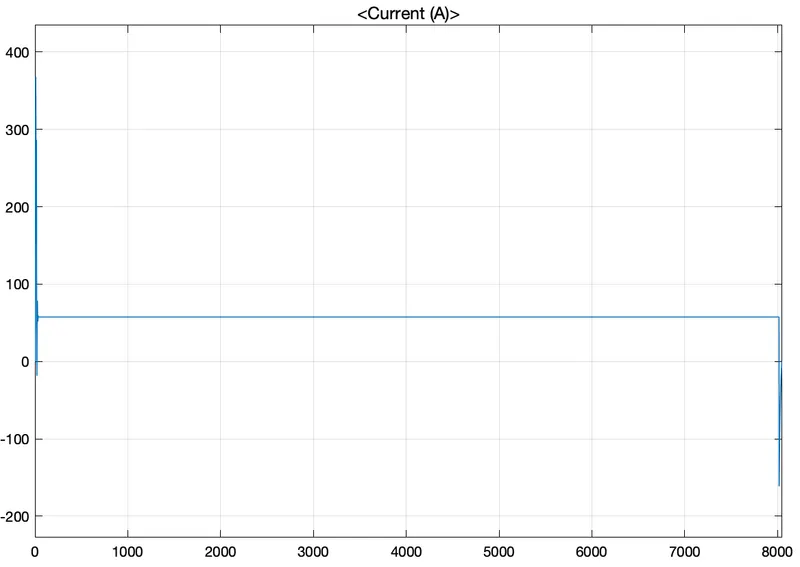
Battery current for constant speed driving cycle
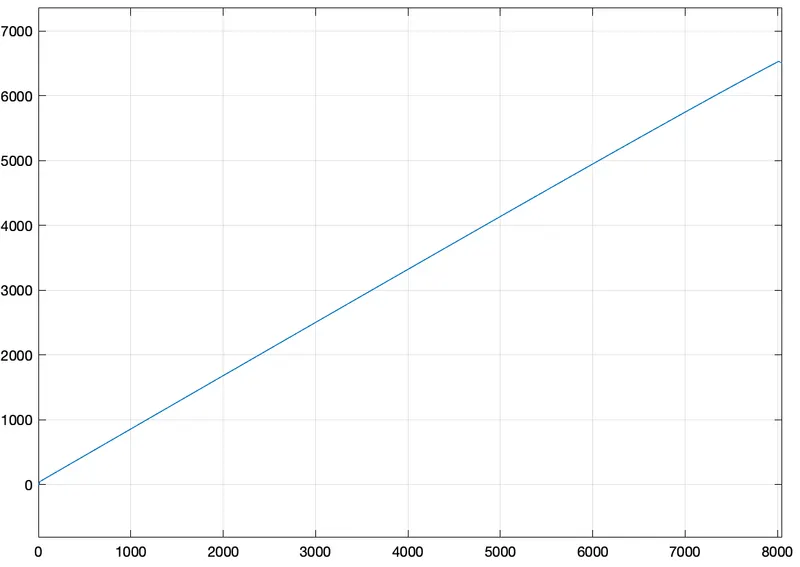
Energy consumption (Wh) for constant speed driving cycle
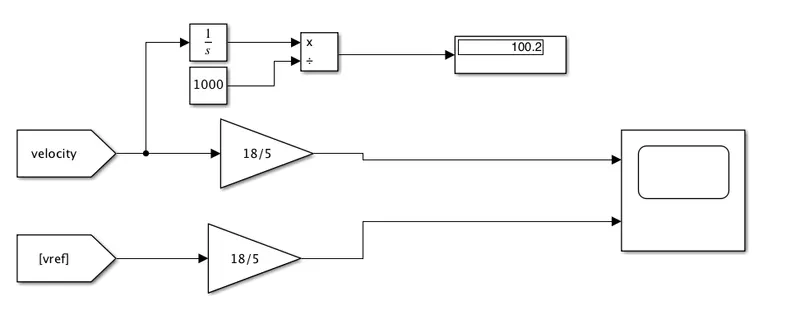
Total Distance of 100 Km at constant speed of 45 Kmph
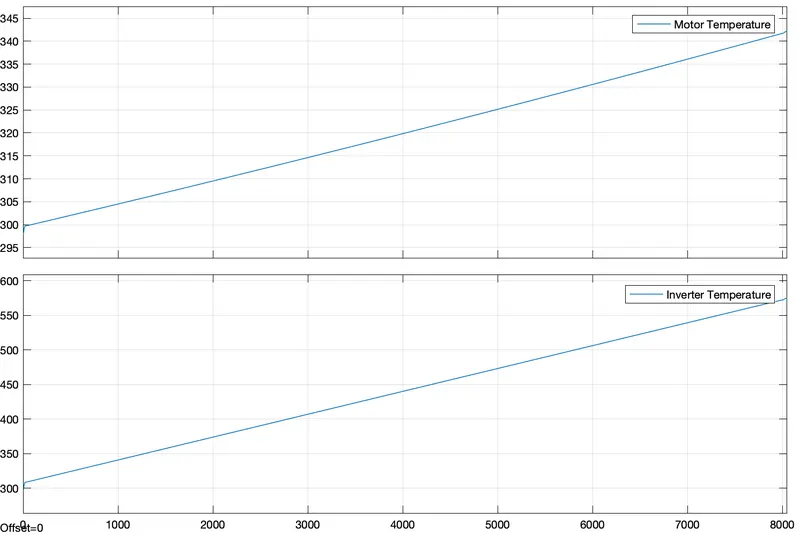
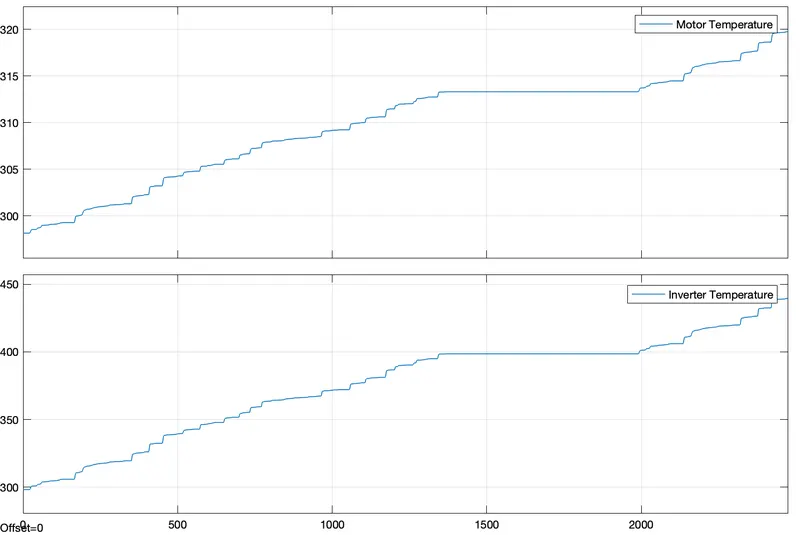
Motor and Controller temperature for constant speed driving cycle
Conclusion:-
The Simulink Model of an electrical vehicle is presented here. Powertrain blockset is used here, which simulates the real world electrical and mechanical systems. This is done using the motor rating and simple parameters obtained using excel sheet. Then the modified FTP drive cycle is evaluated. Finally the constant speed test done, where the vehicle covers 100 Km at a constant speed of 45 Kmph.
It is observed that acceleration is faster than the deceleration. This is true in real world as well since the discharge rate of battery is generally more than the charging rate. Mechanical brakes and current limiter circuit are needed better braking action and faster response. Speed of simulation depends on the solver configuration., thus it should be chosen carefully.
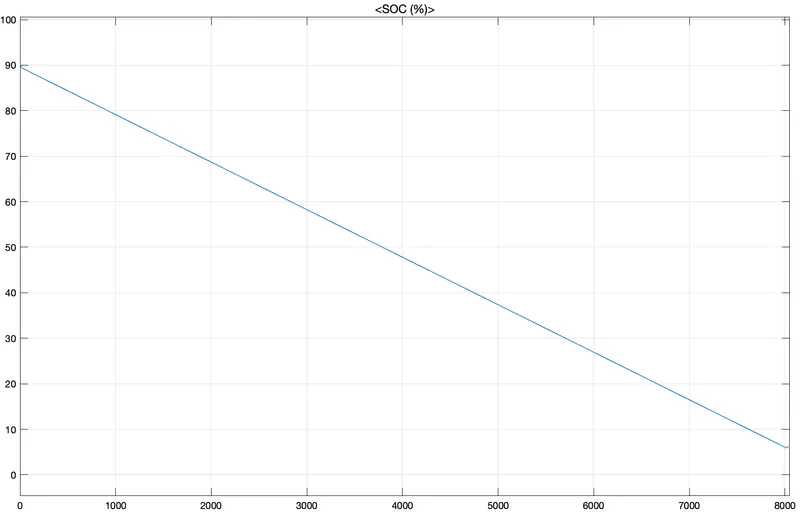
The model is simulated to complete 100 Km drive at a constant 45 Kmph speed. The SOC % of the battery drops from 90% at the stant to 7% at the end of 100 Km. 6500 Wh is used during the complete journey.