Final Project: Electric Rickshaw modelling
Question:
Create a detailed MATLAB model of an electric rickshaw (three wheel passenger vehicle) as per details below:
Rear wheels driven by PM brushed type motor.
Assume efficiency points of motor controller and motor.
Make an excel sheet of all input and assumed data.
Results: For any three standard driving cycles show energy consumption, temperature rise of motor and controller for 100 km constant speed driving at 45 kmph.
(Note- The simulink model file should be compulsorily attached)
AIM:
To create the MATLAB model of an Electric Rickshaw (Three Wheeler Passenger Vehicle).
Theory:
Electric rickshaws have been becoming more popular in some cities since 2008 as an alternative to auto rickshaws and pulled rickshaws because of their low fuel cost and less human effort compared to pulled rickshaws. They are being widely accepted as an alternative to petrol/diesel/CNG auto rickshaws. They are three-wheelers powered by an electric motor ranging from 650 to 1400 watts. They are mostly manufactured in India and China. Only a few other countries manufacture these vehicles. Battery-run rickshaws could be a low-emitter complementary transpoort for the low-income people, who suffer most from a lack of transport facility, if introduced in a systematic manner according to experts.
These rickshaws have a M.S. (mild steel) tubular chassis, consisting of three wheels with a differential mechanism at the rear wheels. The motor is brushless DC motor manufactured mostly in India and China. The electrical system used in Indian versions is 48V and Bangladesh is 60V. The body design from most polpular chinese version is of very thin iron or aluminium sheets. Vehicles made in fibre are also polpular because of their strength and durability, resulting in low maintenance, especially in India. Body design is varied from load carriers, passenger vehicles with no roof to full body with windshield for drivers comfort. It consists of controller unit. They are sold on the basis of voltage supplied and current output, also the number of mosfets (metal ooxide field effect transistors) used. The battery used is mostly lead acid battery with life of 6-12 months. Deep cycle batteries designed for electric vehicles are rarely used. Weight of the electric car has also been a recurring design difficulty in them.
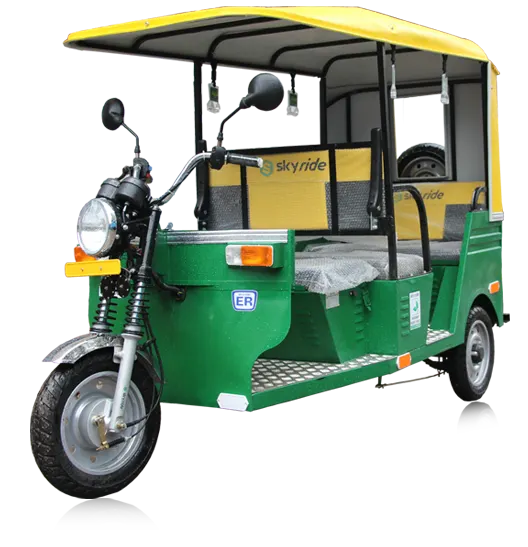
Fig01: Electric rickshaw.
Matlab model for electric rickshaw:
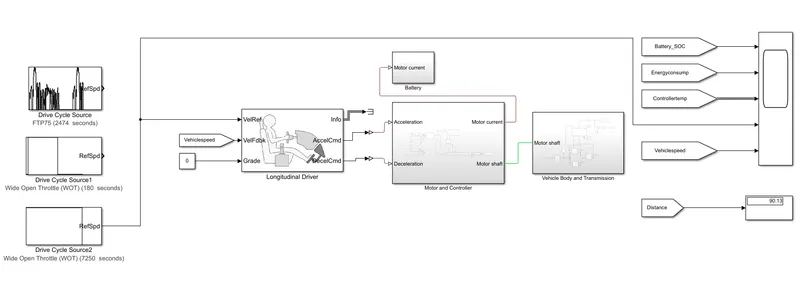
Fig02: Matlab model for Electric rickshaw.
Link for Matlab Model: Matlab model for electric three wheeler.
Initially the current flows to DC motor from the battery through the DC-DC power converter to drive the motor. The required voltage will be controlled in the controller. The controller will follow the given drive cycle reference and run the motor in the required rpm. Then the motor power is transmitted to the wheels of a vehicle through the gear box and the controller will take the vehicle speed and compare thus the control is initiated.
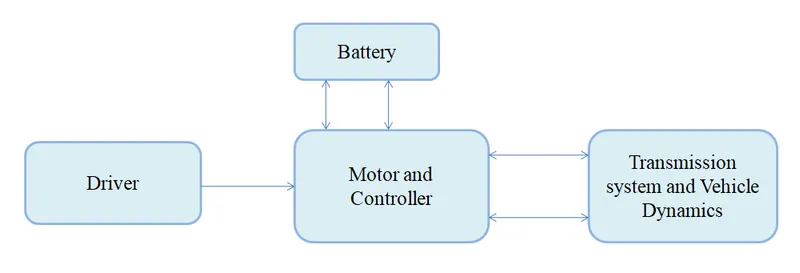
Fig03: Block diagram for internal arrangement of electric rickshaw.
The model mainly consists of following subsystems:
- Driver.
- Motor and Controller.
- Battery.
- Vehicle Body and Transmission.
Now, let's study one by one in detail.
Driver:
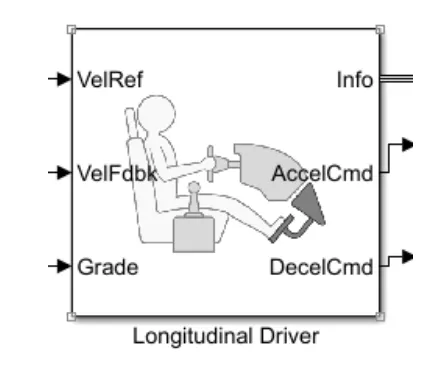
Fig04: Subsystem_Driver controller.
A parametric longitudnal speed tracking controller for generating normalized acceleration and braking commands based on reference and feedback velocities.
Use the external actions to input signals that can disable, hold or override the closed-loop commands determined by the block. The block uses this priority for the input commands: disable, hold, override.
Drive cycle is connected to a longitudnal driver, it has six ports namely velocity reference, velocity feedback, grade, info, acceleration and deceleration.
VelRef is given by the drive cycle data and VelFdbk is given by the output of the motor. These two will get compare and the acceleration or deceleration output will be given to the motor controller. Accelcmd is given the PWM generator block and deccelcmd is given to the regenerative port of the H-bridge which uses to generate regenerative braking. Info is used to get any other data from a longitudnal drive block. The grade is to give the input of gradeability to the driver block. This block helps to generate driver's conditions of the vehicle using the driver cycle block.
Default parameters and PI type control is used in our model for the simulation.
Motor and Controller:
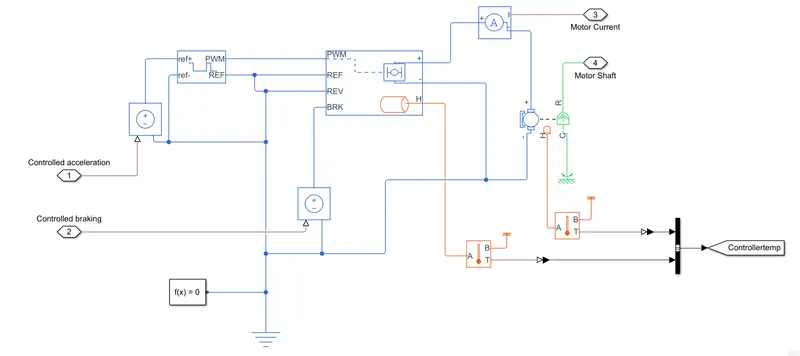
Fig05: Subsystem_Motor and Controller.
01. DC Motor (PM brushed type):
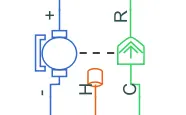
Fig06: Electric Motor.
This block represents the electrical and torque characteristic of a DC motor includes Thermal port to sense the temperature of Motor.
The block assumes that no electromagnetic energy is lost and hence the back-emf and troque constants have the same numerical value when in SI units. Motor parameters can either be specified directly or derived from no-load speed and starting torque. If no information is available on armature inductance, this parameter can be set to some small non-zero value.
When a positive current flow the electrical + to - ports, a positive torque acts from the mechanical C to R ports. Motor torque direction can be changed by altering the sign of the back-emf or torque constants.
| Motor parameters | Magnitude |
| Armature Inductance | 12e-6 |
| No-load speed | 3000 rpm |
| Rated speed | 1500 rpm |
| Rated load | 1 KW |
| Rated DC supply voltage | 48V |
| Rotor Inertia | 0.01 |
| Thermal Mass | 20 KJ/K |
| Initial Temperature | 298.15K |
Table01: Specifications of Motor.
The motor controller will get input from the longitudnal driver. It's tasks are to control the speed of the motor and drive according to the input of the driver. Majorly motor controlled we designed had two main parts named PWM volatge generator and H-bridge.
Input is getting from the accelmd of a longitudnal driver and it is given to a controlled voltage source block where it is input to the controlled PWM voltage. Controlled PWM voltage will generate a PWM siganl in such a way that H-bridge will generate the required voltage to operate the DC motor for the given driver input. PWM voltage block negative reference and REF are grounded and REF of H-bridge respectively. H-bridge is a motor controller that has IGBT components aligned in the shape of H and will operate only two at a time respectively to the input of the signal from the PWM block. When deceleration occur this H-bridge will give an output from the positive and negative terminals of it. These negative and positive terminals are later connected to the DC motor and battery. All these components are the simscape electrical components so they need a connection to the solver configuration block which helps to solve the simulation.
02. Controlled PWM Voltage source:
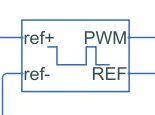
Fig07: Controlled PWM voltage source.
This block creates a Pulse-Width Modulated (PWM) voltage across the PWM and REF ports. The output voltage is zero when the pulse is low and is equal to the output voltage amplitude parameter when high. Duty cycle is set by the input value. Right-click the block and select Simscape->block choices to switch between electrical +ref/-ref ports and PS input to specify the input value.
At time zero, the pulse is initialized as high unless the duty cycle is set to zero or the pulse delay time is greater than zero.
The simulation mode can be set to PWM or Averaged. In PWM mode, the output is a PWM signal. In Averaged mode, the output is constant with value equal to the averaged PWM signal.
Select simulation mode as Averaged.
03. Power Converter (H-Bridge):
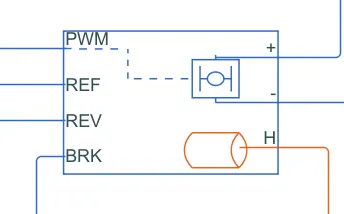
Fig08: H-Bridge used as DC-Dc converter.
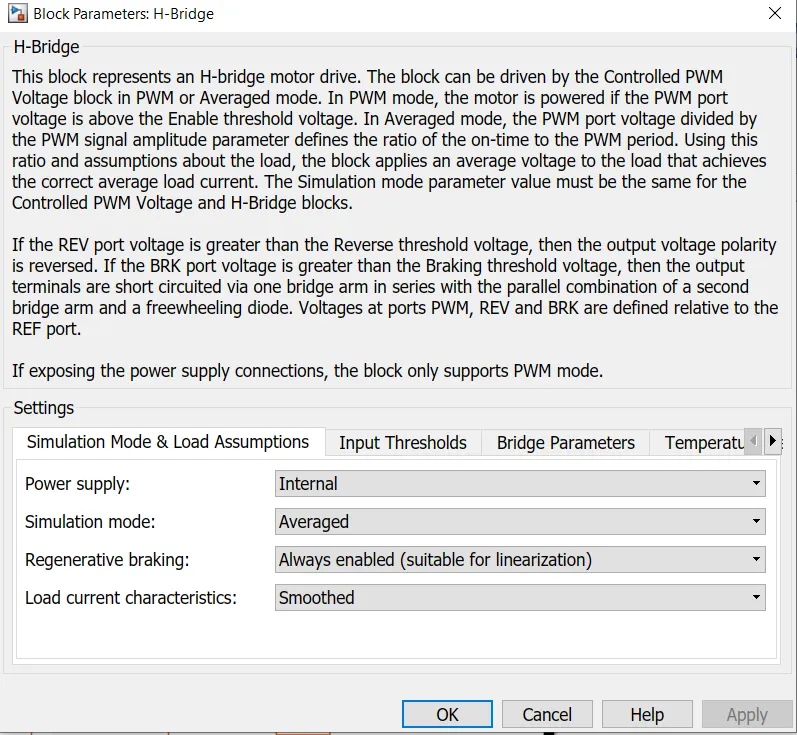
Fig09: Parameters of H-Bridge.
This block represents an H-bridge motor drive. The block can be driven by the Controlled PWM Voltage block in PWM or Averaged mode. In PWM mode, the motor is powered if the PWM port voltage is above the Enable threshold voltage. In Averaged mode, the PWM port voltage divided by the PWM siganl amplitude parameter defined as the ratio of the on-time to the PWM period. Using this ratio and assumptions about the load, the block applies an average voltage to the load that achieves the correct average load current. The simulation mode parameter value must be the controlled PWM voltage and H-bridge blocks.
In the REV port voltage is greater than the Reverse threshold voltage, then the output voltage polarity is reversed. If the BRK port voltage is greater than the Braking threshold voltage, then the output terminals are short circuited via one bridge arm in series with the parallel combination of a second bridge arm and a freewheeling diode. Voltages at ports PWM, REV and BRK are defined relative to the REF port.
If exposing the power supply connections, the block only supports PWM mode.
| Motor Controller parameters | Magnitude |
| Threshold voltage | 2.5V |
| PWM amplitude | 5V |
| Reverse Threshold | 2.5V |
| Braking voltage | 2.5V |
| Output voltage | 200 |
Table02: Specifications of Motor controller.
04. Temperature sensor:
Temperature sensor is used to measure the temperature of H-bridge and Motor.
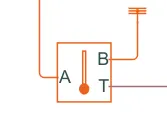
Fig10: Temperature sensor.
This block measures temperature in a thermal network. There is no heat flow through the sensor. The physical signal port T reports the temperature difference across the sensor. The measurement is positive when the temperature at port A is greater than the temperature at port B.
05. Solver configuration:
Fig11: Solver configuration.
Defines solver settings to use for simulation.
06. References:
- Electrical reference: Used to ground all the electrical connections.
- Mechanical rotational reference: Used to ground all the mechanical rotational parts.
- Thermal reference: Used to ground the thermal sensor.
Battery:
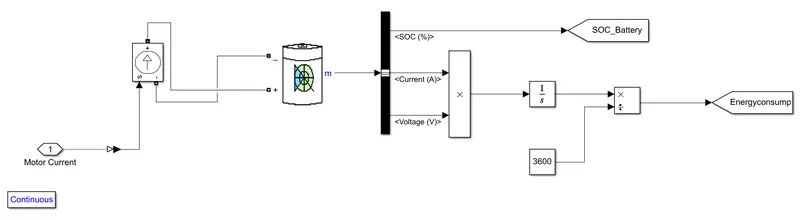
Fig12: Subsystem_Battery.
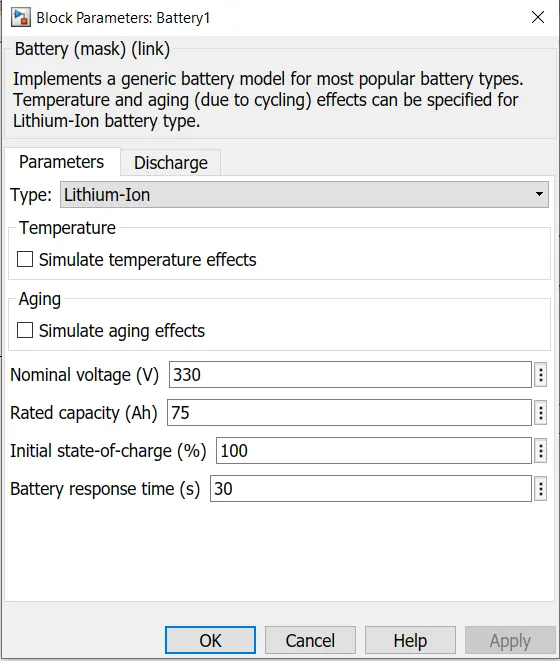
Fig13: Battery parameters.
| Battery parameters | Magnitude |
| Battery type | Lithium ion |
| Nominal voltage | 330V |
| Rated capacity | 75Ah |
| Initial SOC% | 100 |
| Internal resistance | 0.0012 ohm |
Table03: Specifications of Battery.
The battery is required to power the controller and motor. The controller uses the battery power according to produce the input given by the motor to obtain maximum speed. The battery is also used to power every electrical component in the vehicle. The battery has two states one is charging and the another one is discharging state. The battery is of 75Ah capacity.
The nominal voltage of the battery is 330V.
Initial SOC is of 100%.
The battery as a series internal resistance plus a charge-dependent voltage source defined by:
`V = frac(Vnom *SOC)(1-beta*(1-SOC))`
where SOC is the state of charge and Vnom is the nominal voltage. Coefficient beta is calculated to satisfy a user-defined data point [AH1,V1].
The battery has a positive and negative terminal which is given the voltage-controlled source where the battery consumption is controlled by the motor controller and then it is given to the SOC block.
State of Charge (SOC):
SOC is the percentage or level of battery presents after certain travel or consumption of battery charge by the vehicle. In the designed vehicle battery charge or SOC is calculated by the giving it to the rate transition and then to gain where 1 (nominal battery capacity) then to a discrete time integrator and it will get minus from the 1 as it is considered a 100% of battery and it is multiplied with 100 to get percentage of the battery.
The majority of blocks are simscape blocks where physical to simulink converter is used to convert the physical signal from simscape block to simulink signal.
Vehicle Body and Transmission:
Motor will produce the rotational output which will be given to the vehicle body and transmission system. The rotational output is taken by the gear system here to maintain the constant speed throughout the transmission without any loss in speed from the motor to tires. Below is a diagram that is how it is inside the vehicle body and transmission syatem and in the main design, it is referred just only as a transmission system.
Here we created a rear wheel drive transmission system.
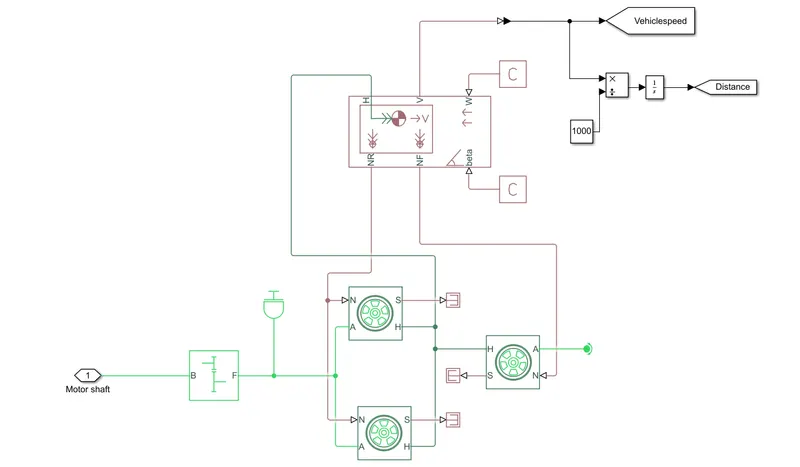
Fig14: Subsystem_Vehicle body and Transmission.
The gear output is given to axles of Rear tires, in the circuit it is shown that gear is connected to rear wheels and front tire is free to rotational motion, thus vehicle moves forward. N is the normal force caused by the tires and it is given to the vehicle body normal force port. The vehicle body has an H-Hub, S-Tire Slip, N-Normal force, A- Axle connection, wind velocity and inclination angle. The tires hub is connected as a common node to the vehicle body. The vehicle body wind velocity is connected to a constant block and the beta inclination angle is connected to another constant block where we can assign wind and inclination angle as per requirement. Velocity is the output port where we can get at which velocity the vehicle is moving. The velocity is taken out to get the distance travelled and SOC.
01. Vehicle Body:
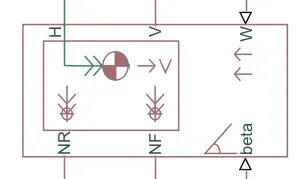
Fig15: Vehicle body.
| Vehicle body parameters | Magnitude |
| Mass | 615kg |
| No. of wheels per axle | 2 |
| Frontal area | 1.48m^2 |
| Drag coefficient | 0.5 |
| Air density | 1.18kg/m^3 |
Table03: Specifications of Vehicle body.
02. Wheels:
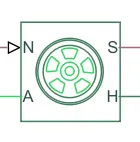
Fig16: Wheel.
Represents the longitudnal behaviour of a highway tire characterized by the tire Magic formula. The block is built from Tire-Road Interaction (Magic Formula) and simscape Foundation Library Wheel and Axle blocks. Optionally, the effects of tire inertia, stiffness and damping can be included.
Connections S is the mechanical rotational conserving port for the wheel axle. Connectiion H is the mechanical translational conserving port for the wheel hub through which the thrust developed by the tire is apllied to the vehicle. Connection N is the physical signal input port that applies the normal force acting on the tire. The force is considered as positive if it acts downwards. Connectioin S is a physical signal output port that reports the tire slip. Optionally expose the physical signal port M by setting Parameterize bt to physical signal Magic Formula coefficients. Physical signal port M accepts a four element vector corresponding to the B,C,D and E Magic Formula coefficients.
| Parameters of wheel | Magnitude |
| Wheel radius | 0.306m |
| Vertical load | 3000N |
| Peak longitudnal force at rated load | 3500N |
| Slip | 10 |
Table04: Specifications of Wheel.
03. Inertia:

Fig17: Inertia.
Inertia 0.01kgm^2
The block represents an ideal mechanical rotational inertia.
The block has one mechanical rotational conserving port. The block positive direction is from it's port to the reference point. This means that the inertia torque is positive if the inertia is accelerated in the positive direction.
04. Simple Gear box:
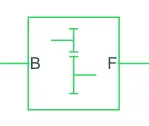
Fig17: Simple gear box.
Gear ratio represents a fixed-ratio gear or gear box. No inertia compliance is modeled in this block. You can optionally include gear meshing and viscous bearing losses.
Connections B (base) and F (follower) are mechanical rotational conserving ports. Specify the relation between base and follower rotation directions with the output shaft rotates parameter. Optionally include thermal effects and expose thermal conserving port H by right-clicking on the block and selecting simscape block choices to switch between varients.
Output shaft rotates in the same direction of the input shaft.
Base is connected to the motor shaft and the follower is connected to the rear wheel drive.
Drive Cycle:
Drive cycle is assumed as the driver's input of a vehicle, it replaces how a driver will drive a vehicle. Here I have used three drive cycles which are used to test the vehicle performances. These drive cycle will hhave high speed, low speed, braking conditions in it. There are different drive cycles like WOT, FTP75, etc. Here in this model I have used FTP75, WOT and drive cycle with constant speed 12.5 m/s for 7200 seconds (i. e. 45 kmph for 2 hours).
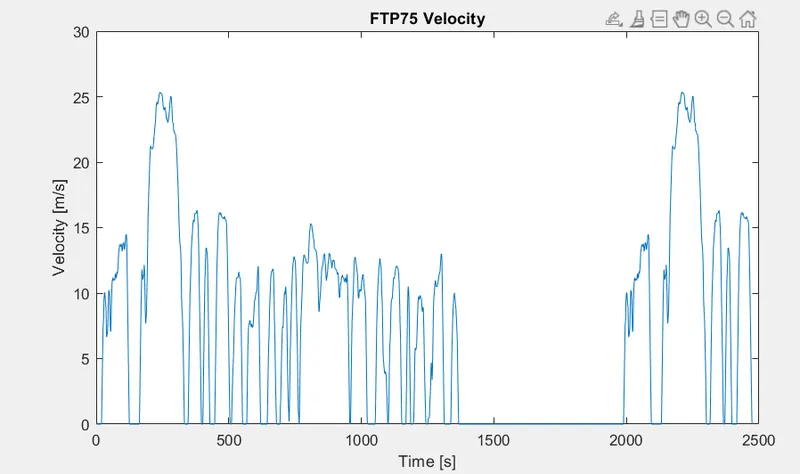
Fig18: Plot of FTP75 drive cycle.
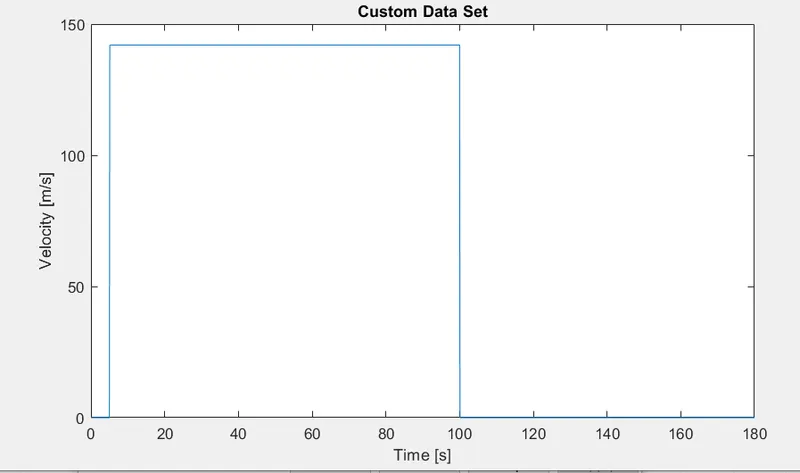
Fig19: Plot of WOT drive cycle.
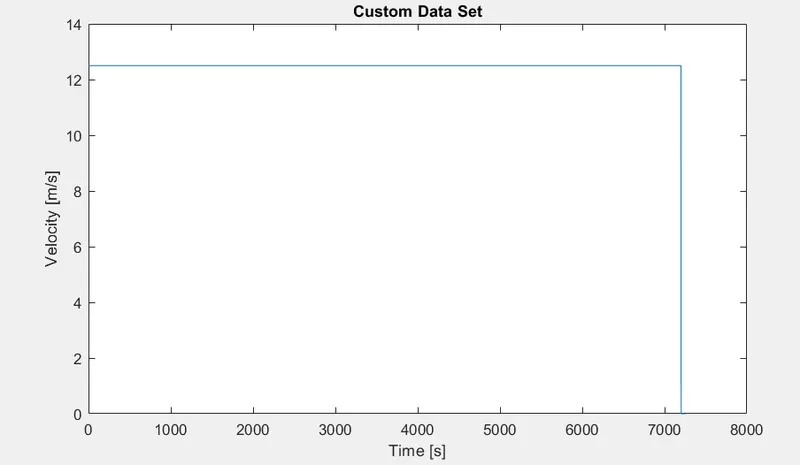
Fig20: Plot of WOT drive cycle at 12.5 m/s for 7200 seconds.
Results:
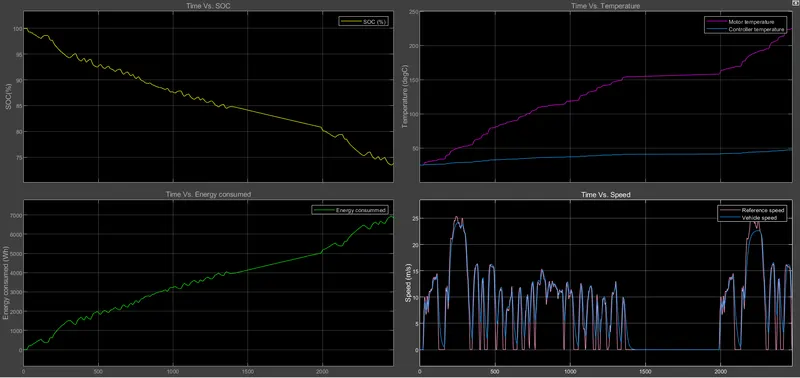
Fig21: Results for drive cycle FTP75.
- The actual speed approximately followed the 90% of the reference speed. During braking a delay is observed which can be further improved with the study.
- Energy consumed by the battery is 6.9*10^3 Wh at the end of the cycle.
- The SOC of the battery is reduced to 73%.
- The temperature of the motor is increased upto 227°C.
- The temperature of the controller is increased upto 49°C.
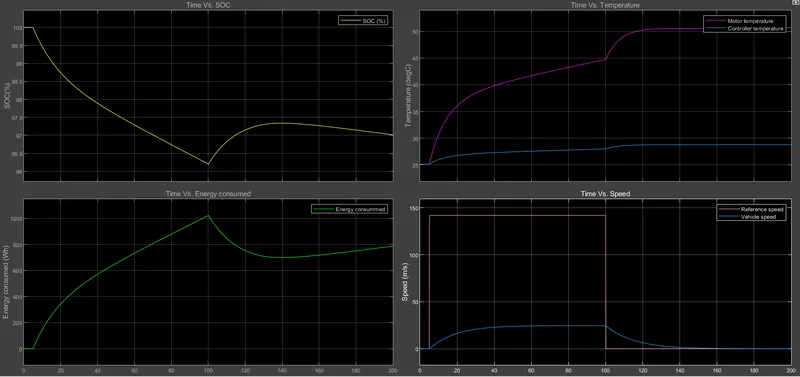
Fig22: Results for drive cycle WOT-I.
- For such a short duration of time i. e. 200 seconds the actual speed did not match upto even 60% of the reference speed. This indicates improvement in resolution and response of the controller.
- Energy consumed by the battery is 0.8*10^3 Wh at the end of the cycle.
- The SOC of the battery is reduced to 97%.
- During regenerative action SOC starts improving. And the lesser consumption of energy can also be observed simultaneously.
- The temperature of the motor is increased upto 51°C.
- The temperature of the controller is increased upto 29°C.
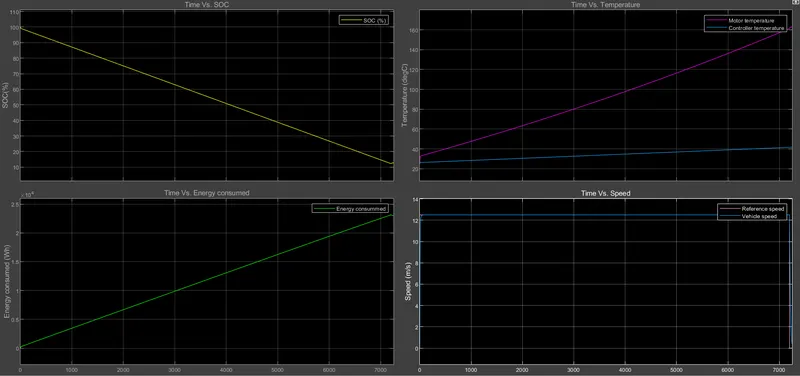
Fig23: Results for WOT drive cycle at 12.5 m/s for 7200 seconds.
- For such a long duration of time i. e. 7250 seconds the actual speed matches upto even 95% of the reference speed.
- Energy consumed by the battery is 2.3*10^3 Wh at the end of the cycle.
- The SOC of the battery is reduced to 12%.
- During regenerative action SOC starts improving. And the lesser consumption of energy can also be observed simultaneously.
- The temperature of the motor is increased upto 163°C.
- The temperature of the controller is increased upto 42°C.
Conclusion:
- Here the temperature of the motor has been compromised in order to achieve the reference speeds. Since we did not use any cooling system for the motor and it's controller in the model whereas in real time application the temperature of the motor must be below 100°C.
- In real time applications the temperatures of motor, controller and battery are controlled by the air cooling units. Hence the temperatures of these components are not increased upto this extent.
- We created the MATLAB model for electric rickshaw showing the behaviour of crucial performance parameters of the battery and controller such as SOC, motor temperature, controller temperature and energy consumption in order to achieve the reference speeds and other vehicle dynamics requirements.