Final Project: Design of an Electric Vehicle
INTRODUCTION:
We are asked to simulate an entire electric vehicle which is powered by a battery & a DC motor. We are also asked to explain the EV's system parameters.
SYSTEM LAYOUT:
The entire model is shown below. We will explain how we selected the blocks & the parameters of the block.
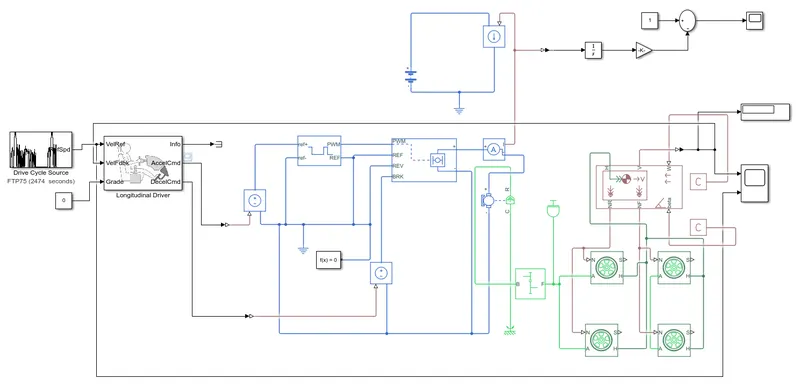
In order to simulate the EV system, we need the following:
1). A drive cycle.
2). A driver system.
3). A power source to drive the EV.
4). A DC motor.
5). A motor controller to control the cuurent & voltage to the DC motor according to the drive cycle requirements.
6). A vehicle body & wheels.
Now we will explain the contents of the entire system.
DRIVE CYCLE:
A drive cycle is nothing but a velocity plot. It shows velocities w.r.t time. This can be achieved in simulink using a drive cycle source block. The block is shown below.
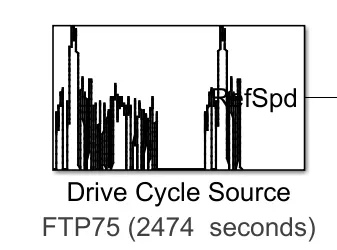
This block can create a drive cycle for a certain period of time. The block parameters are shown below.
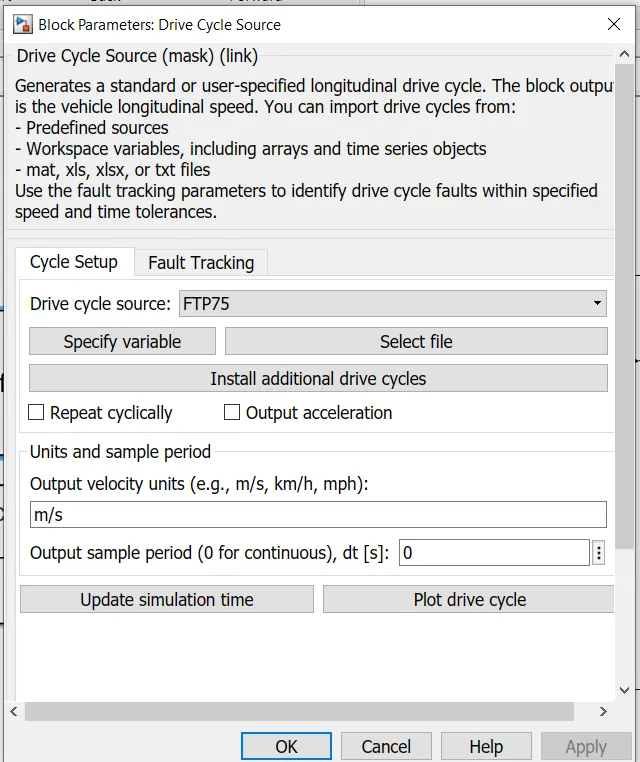
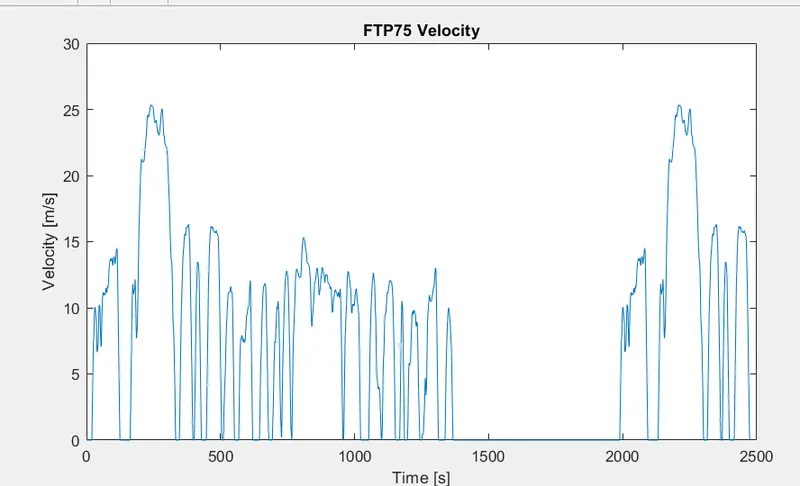
We have chosen the FTP-75 drive cycle, which is the standard drive cycle followed for every EV simulation. The FTP is known as the Federal Test Procedure, and it plots a drive cycle for 2474 seconds. The drive cycle plot is shown below.
This block contains only one output called the ref.speed, which can be connected to the driver system.
DRIVER SYSTEM:
The driver system simulates a driver controlling the steering, acceleration & deceleration of the vehicle. This can be done by using the longitudinal driver block. The block is shown below.
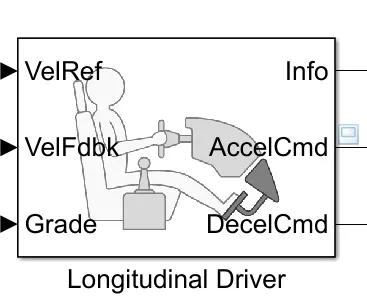
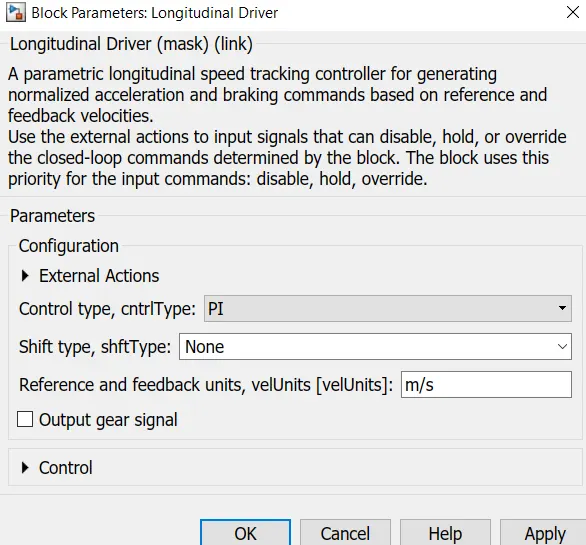
This uses a PI controller, which is used to minimize the error difference between the actual speed & the ref.speed of the vehicle.
This contains three input ports, the vel.ref which is the drive cycle reference speed connected from the drive cycle source. The vel.fdbk which is the output signal fedback as the input for the driver system. This will be helpful in comapring the actual speed of the system with the reference speed. The grade port is the grade angle at which the vehicle is climbing. This is zero as we are not considering any hill climbing angle for the system.
The accel.cmd & decel.cmd are the outputs of the driver system, which is the equivalent of the accelerator & brake pedal of a car. They are connected to the controlled voltage sources, which are connected to the motor controllers to supply power according to the drive cycle requirements.
POWER SOURCE:
As we already know, the power source for an EV is the battery. The battery block in simulink represents the conventional battery. The block is shown below.
The battery parameters are shown below.
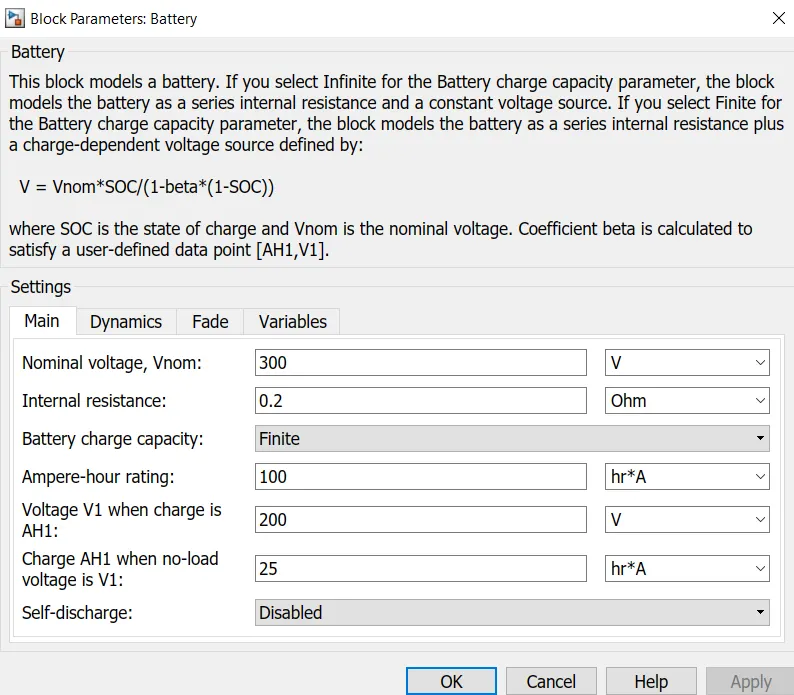
The battery capacity, nominal voltage, the internal resistance of the battery are all keyed in. The parameters mentioned above are some real values used in EV's today. The battery pack in an EV has a nominal voltage between 200-800V, while the battery capacity is between 50-100 Ah for today's battery packs. The charge capacity is kept as finite.
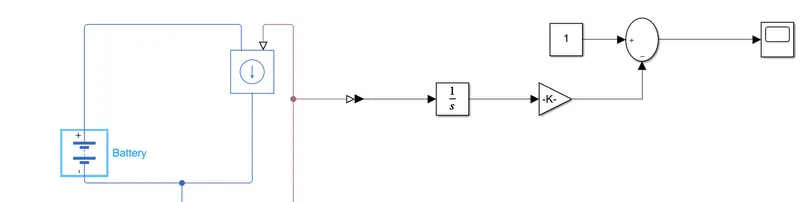
The above block diagram represents the SOC system. The battery powers the vehicle, while we measure the capacity of the current present in the battery after discharge starts. The SOC is defined as the ratio of present capacity of the battery to the max.available capacity. We use the current sensor & the controlled current source block to measure the current coming out from the motor. Then we use the couloumb-counting method, which is the most popular method of estimating SOC. We measure the current coming out from a device, and we integrate it with time. The integrated values are then subtracted from the initial SOC of the battery to find the present battery capcity of the system. This is the couloumb counting method. The formula is given below.
SOC = 1 - (integral)[1/C(rated)]. Here the Crated is the battery's ampere-hour rating. This rated current is then converted into amperes.(multiply the rated current by 3600)
We use the integrator block to integrate current & the gain block is used to convert the rated current. Then it is passed on to the add block, where we subtract the integrated current from the initial SOC which will be 100% initially.
These outputs are then linked to a scope window to view the SOC during simulation.
MOTOR CONTROLLERS:
Battery current is not passed directly to the motors. Instead they are passed through controllers which effectively use the current & voltage for the motor without any wastage in energy. We will look at the controller system we used in this EV simulation.
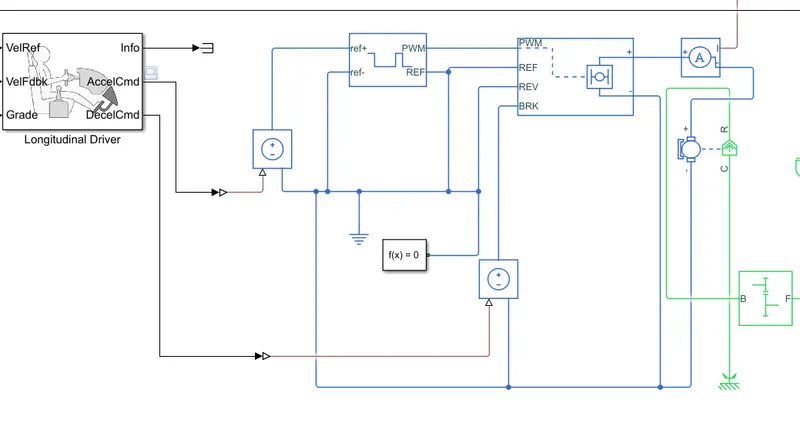
The controller used for the motor is the H-bridge. The H-bridge is a type of controller, which contains 4 sets of transistor switches & motor arranged in the shape of the alphabet H. An example is shown below.
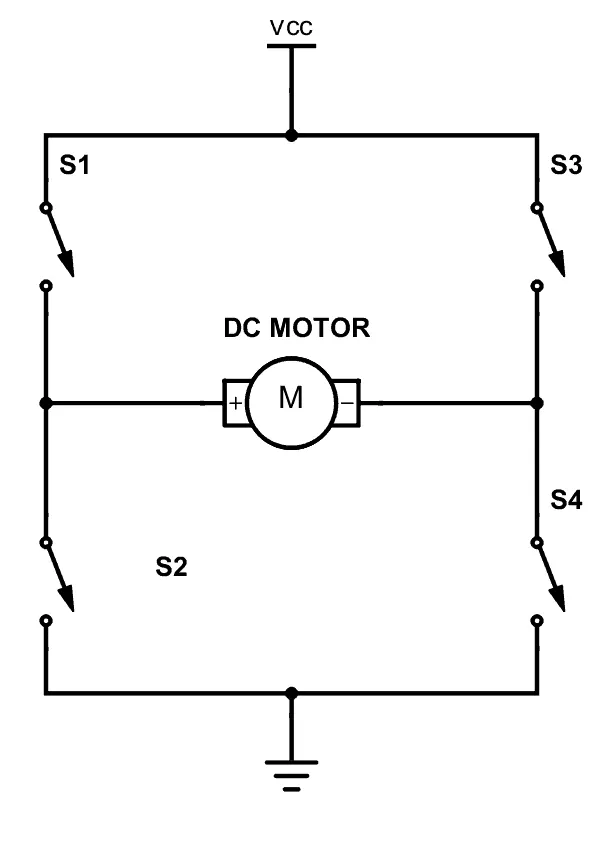
By opening & closing the 4 switches, the direction of currents can be changed. By changing the current direction, the motor can be driven in forward & reverse direction. Example, in this H-bridge, by closing switches 1 & 4 and opening 2 & 3, we can run the motor in forward direction & vice-versa for reverse direction.
In SIMULINK, this H-bridge can be simulated using the H-bridge and the voltages can be passed to the controller by the controlled PWM voltage block. The PWM voltage is used as a voltage regulator. By specifying the duty cycle & the voltage amplitude, we can pass controlled voltage pulses through the motor controller. The blocks in simulink are shown below.
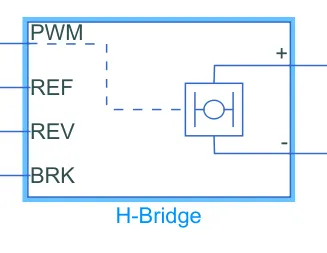
The H-bridge contains 4 input ports, while the output terminals are connected to the motor terminals. The PWM port is the pulse width modulated voltage port, which is passed from the controlled PWM voltage block. The REF port is the reference port & the REV and BRK is the reverse threshold & braking threshold voltage. They are connected with the PWM port as shown above. The parameters are shown below.
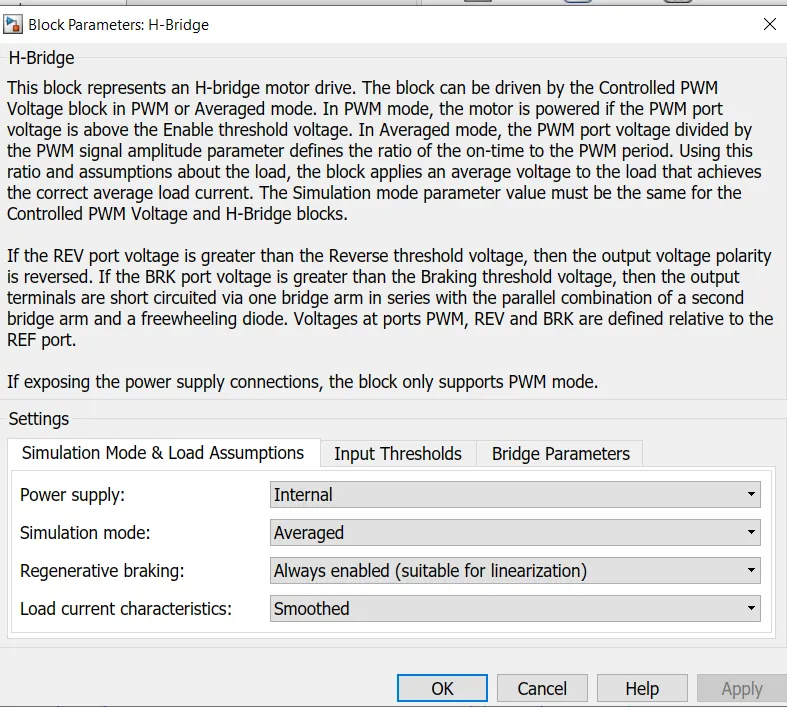
Use the internal power supply option. Keep the simulation mode as averaged, which will speed up the simulation of the system. Enable the regenerative braking option, to conserve more electrical energy. Keep the load current as smoothed so that there is no rush in current.
Now we will look at the PWM voltage block.
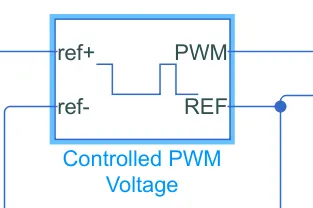
It contains two input & output ports. The ref+ & ref- are the input ports that are connected with the controlled voltage sources. The PWM port is the output port that provides the controlled pulses to the controller. The REF port is connected to the motor controller reference port. The parameters are shown below.
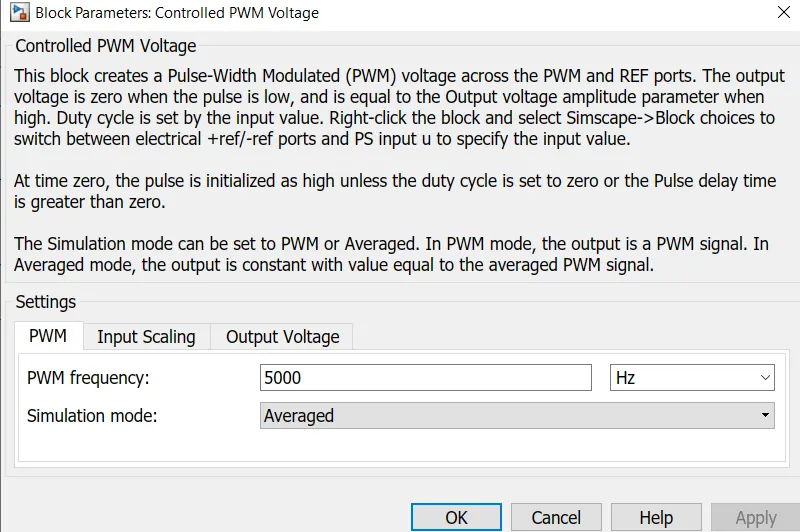
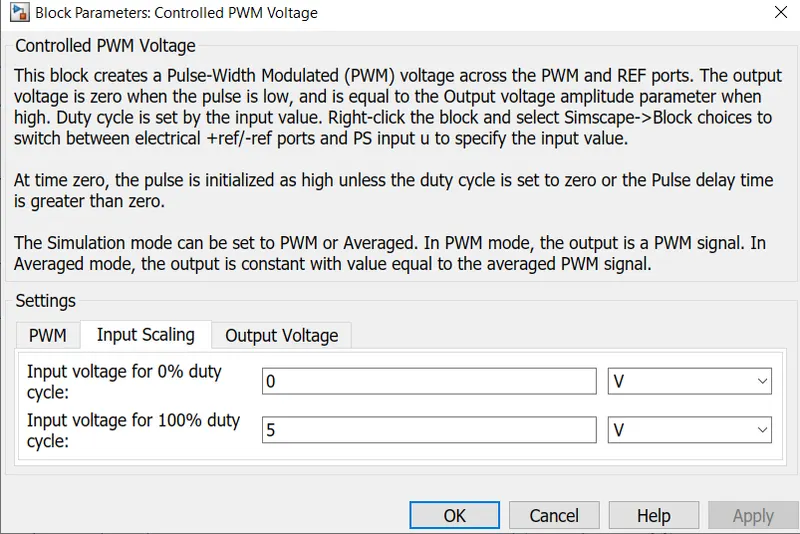
The frequency of the pulses are kept at 5000hz. The simulation mode is kept at averaged mode. The other parameters are the input & output voltage amplitude at 0 & 100% duty cycle. We have kept at 5V. The output voltage amplitude will be at 5V when the controllers are switched on.
The accel.cmd & decel.cmd ports are connected with the 2 controlled voltage sources. The controlled voltage sources are connected to the PWM voltage block & the H-bridge blocks. The connections are made as shown above. This will constitute the electrical part of the system. Since this is the electrical circuit, we must connect a solver configuration block & electrical reference block. The reference block act as the earthing wire to the electrical circuit.
Now we will look at the DC motor configurations.
DC MOTOR:
The DC motor is mostly used in EV's as the motor control is easier in DC supply. We have selected the permanent magnet DC motor for this system. The block is shown below.
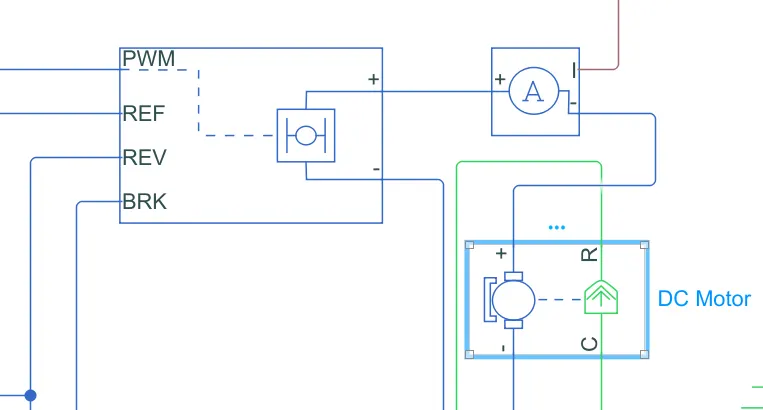
The DC motor is connected with the H-bridge terminals & the current sensor block. The current sensor block is necessary to calculate the SOC of the battery since the motor draws power from the battery & we must know the charge available in the battery. The motor parameters are shown below.
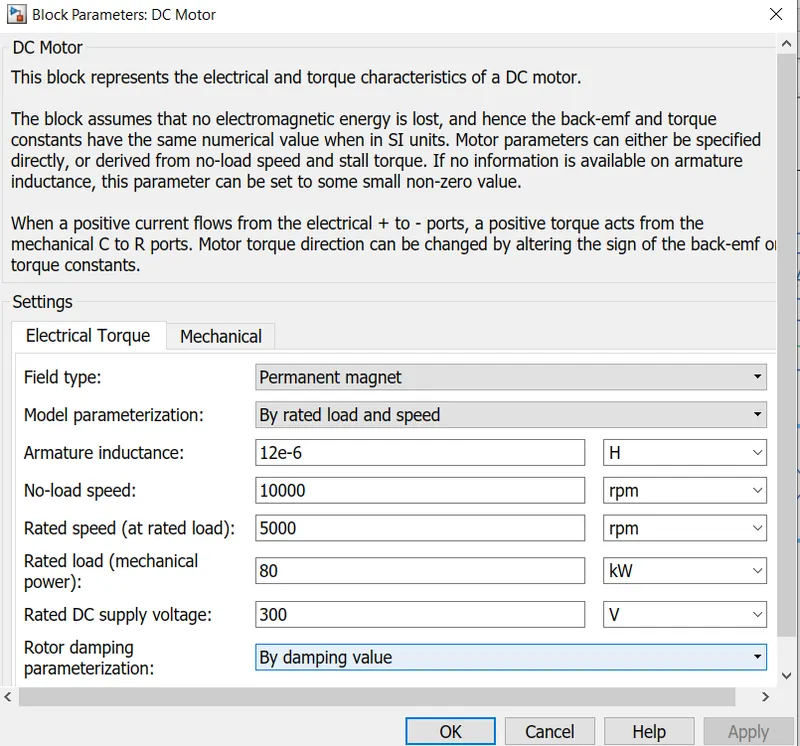
The rated power is kept at 80KW, because all real EV's use motors having rated power upto 80-110KW. The Dc supply voltage is kept as same as the battery nominal voltage. The load speed & no load speed are entered. The rotor inertia is kept at 0.62 kg-m2.
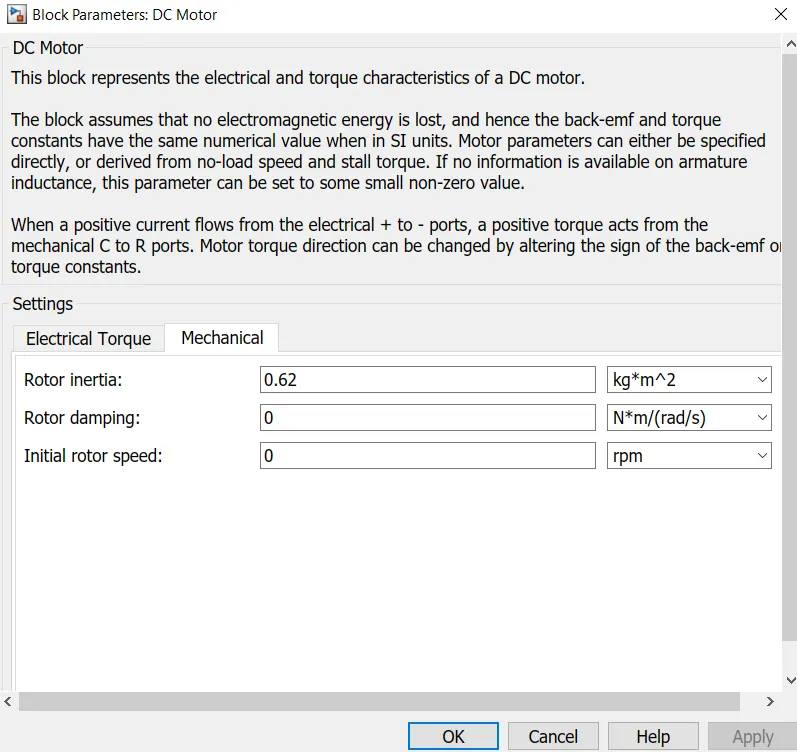
In addition, a mechanical rotational reference block is connected with the DC motor. This block will create a reference point from which the rotational motion behaviour of the DC motor can be studied.
Now we will look at the vehicle body simulation part.
VEHICLE BODY:
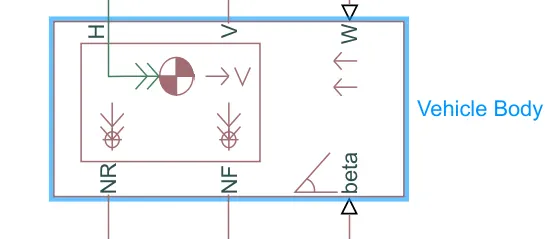
A vehicle body can be simulated in SIMULINK using the vehicle body dynamics blocks. This simulates a vehicle body according to parameters such as kerb weight of the vehicle, frontal area, wheels per axle of the body etc,. The block is shown below.
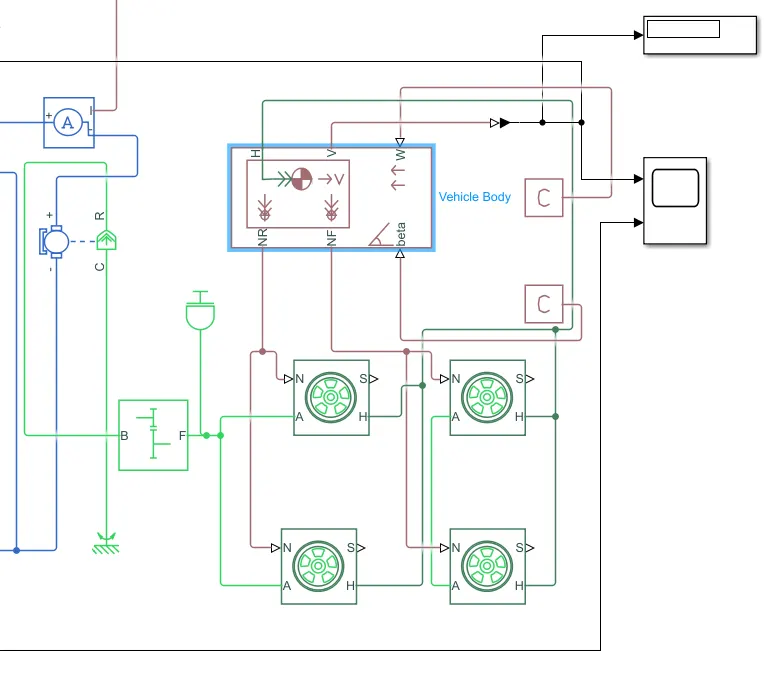
We will look at the entire vehicle body system simulation of the EV.
The vehicle body dynamics parameters are shown below.
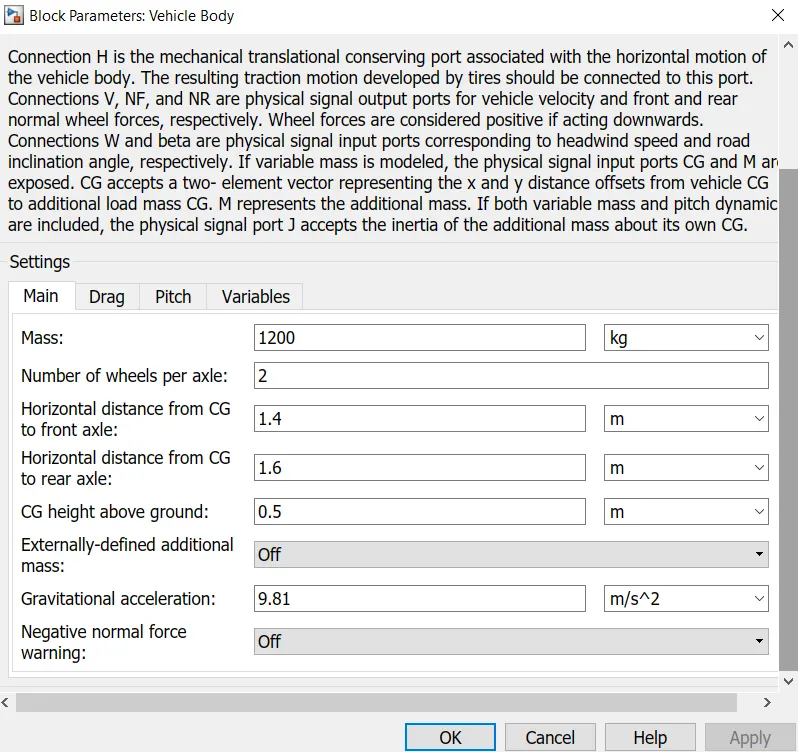
The mass of the vehicle is kept at 1200 kg. The wheels per axle is kept at 2, since Electric cars have 2 axles & 4 wheels in total. The Center of Gravity positions are keyed in with reference to rear axle. The frontal area and drag co-efficients are entered.
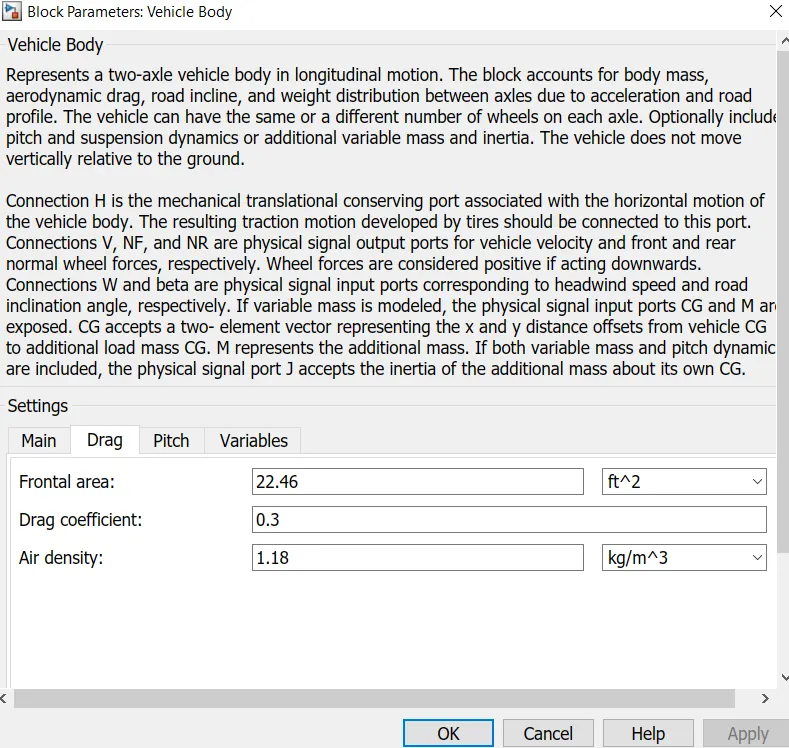
There are six ports in total for vehicle body block. The NR & NF are the normal forces acting on front & rear wheels. They must be connected with the tyre blocks. The port H is the mechanical translational port, that translates the motion to the vehicle from the DC motor. They must also be connected to the tyre blocks. The V port is the output velocity port. This contains the actual velocity of the EV. They can be connected to a display showing the speed in m/s. The scope window is also used to show the actual velocity plot. The W port is the wind speed port, & beta is the hill-climbing angle port. Since we are not considering the hill-climbing force & wind velocity, we use a PS constant block and specify them as zero.
We will now look at the gear box & tyres in the system.
The gear box can be simulated using a simple gear block. It is shown below.
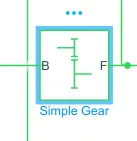
It contains two ports. The B port is the input port, which is called as the base port. The F port is the follower port. The DC motor transmits the motion to the vehicle body through the simple gear box. The B port is connected to the DC motor. The F port is connected to the tyre blocks. The parameters are shown below.
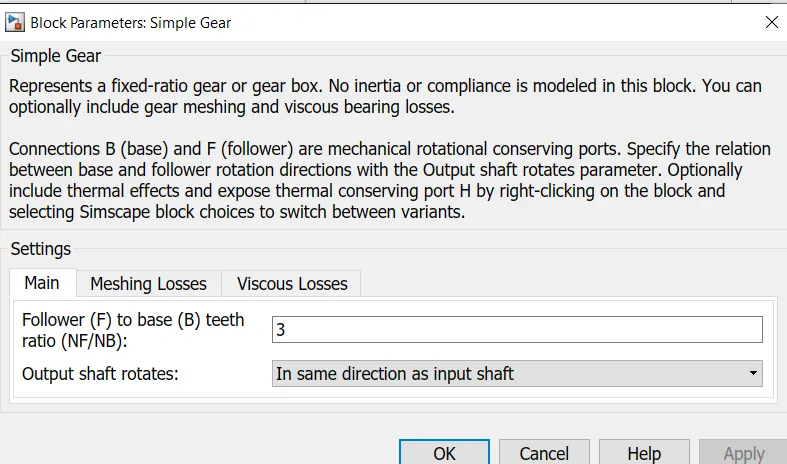
The ratio 3 is the follower teeth ratio to the base teeth ratio. The base teeth is generally the pinion gear which is the driver gear & the follower teeth is the driven teeth which is the vehicle.
Now we will look at the tyre block.
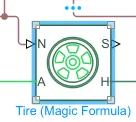
The tyres can be simulated using the Tire(magic formula) block in SIMULINK. It represents the longitudinal behaviour of the tyre in a real environment. We can add the rolling resistance & radius to the tyre if we want. The parameters are given below.
It contains 2 input & 2 output ports. The N & A ports are the normal force & the mechanical rotational port that will act on the tyre. The S is the slip, which is the difference in actual speed & synchronous speed. H is the mechanical translational port which is the forward & reverse motion of the tyre.
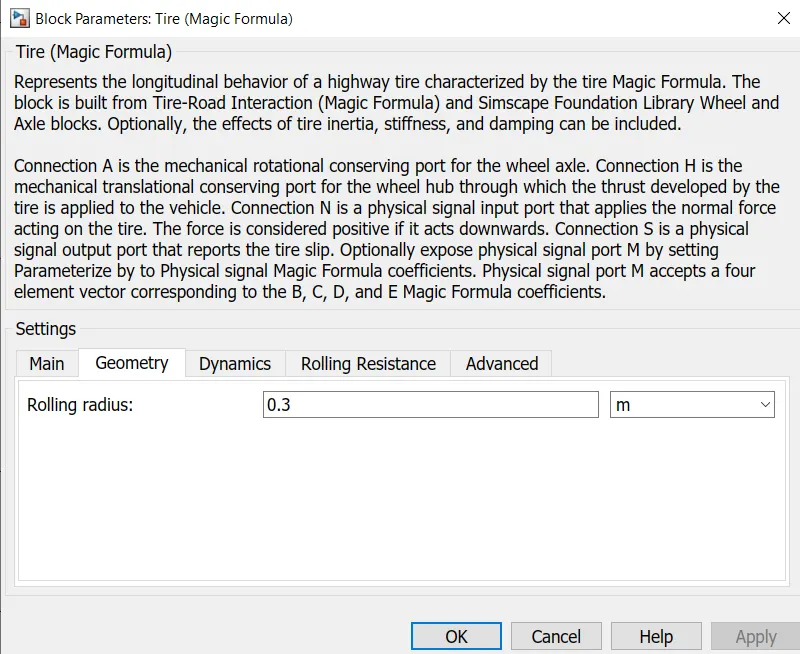
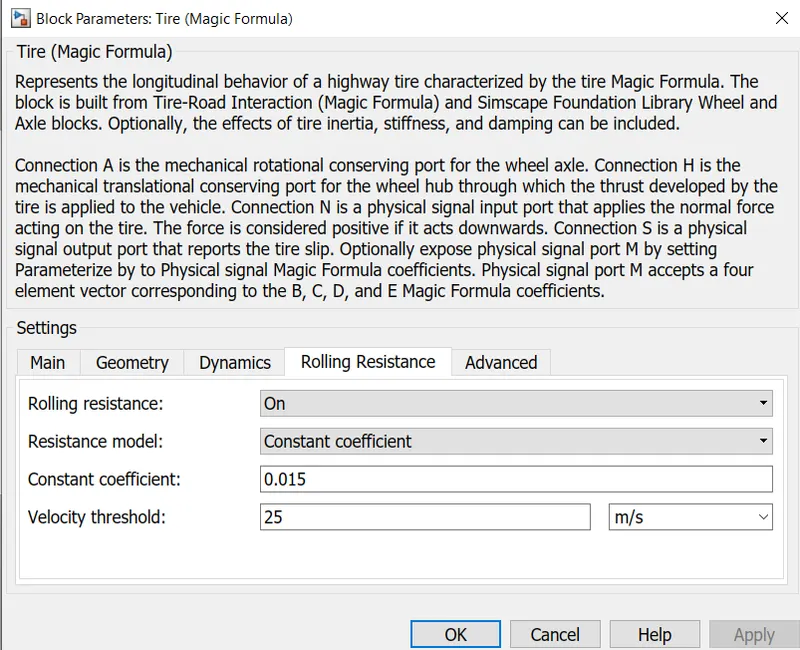
We have considered the rolling resistance here & the co-efficient is specified according to industry standards. The velocity threshold is entered, which will be max.speed of the vehicle we want.
Make the tyre connections with the vehicle body, gearbox as shown above.
After making all the necessary connections, the model is simulated. The stop time is kept at 2474 secs, which is the duration of the FTP-75 drive cycle. We are simulating it to understand how the ref.speed & actual speed will be.
The velocity plot is shown below.
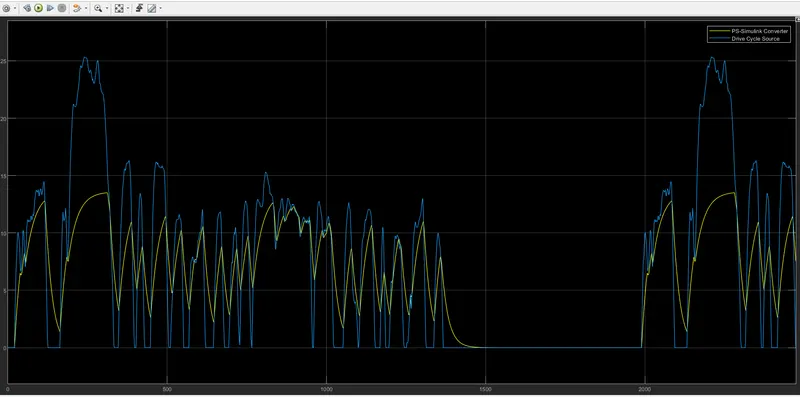
The blue graph is the ref.drive cycle plot & the yellow graph represents the actual drive cycle plot.
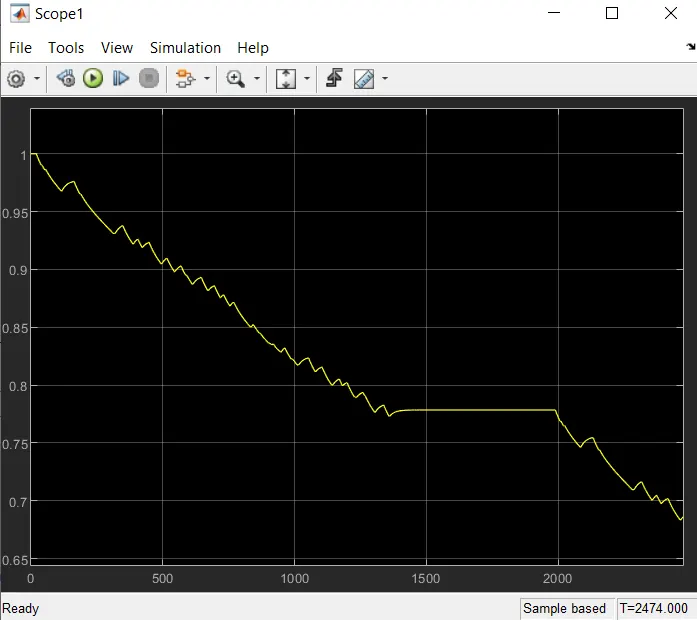
The SOC is decreasing as the EV draws power from the battery continuously.
CONCLUSION:
We have designed an entire electric vehicle & we saw the velocity behaviour of the vehicle. There is a considerable difference between the vehicle speed & the reference speed. But, the model is working fine. The state of charge is also constantly decreasing which denotes the model is working.