Final Project: Design of an Electric Vehicle
Desing of an Electric vehicle
Create a MATLAB model of electric car which uses a battery and a DC motor. Choose suitable blocks from Powertrain block set. Prepare a report about your model including following:
Objectives:
1. System level configurations
2. Model parameters
3. Results
4. Conclusion
Introduction
A new study related to vehicle/Automobile engineering says that by coming 2025, there wil be a major transformation in the automobile sector.Many automakers are working to change the vehicle technologies,the major area is to decrease the pollution and use electrification in the upcoming vehicles. The researches and automakers are continuously working to reduce CO2 emissions.
New technology like high capacity lithium type battery will be a major energy source for the propulsion of electric vehicles. At present ,with the new technologies,some manufacturer has launched its products which are Tesla, chevy bolt EV and Nissan leaf Which are fully electric battery-based car.
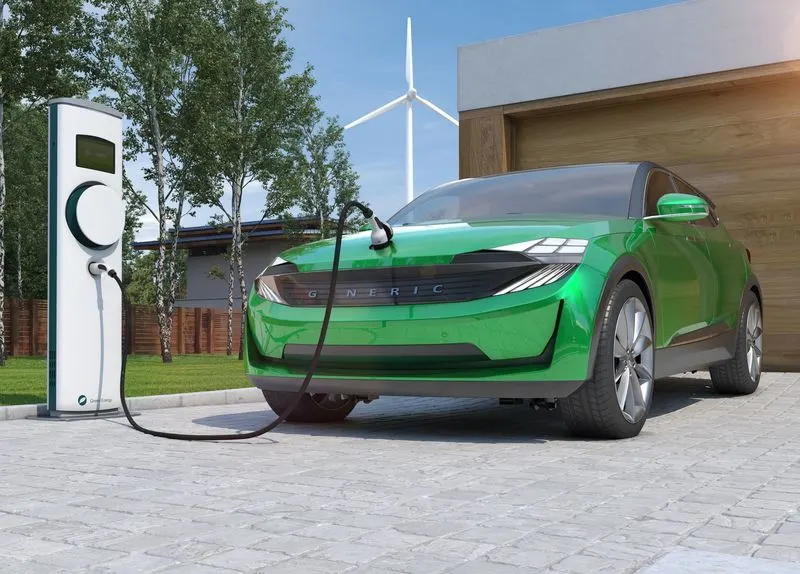
The power and performance of electric vehicles is depending upon the two machines i.e. a brushless DC motor (BLDC) or an induction motor. The DC (direct current)is replaced by DC brushless motors and induction motors. Also the lead-acid battery is replaced by lithium-ion batteries for EVs. Because the future of both the components induction or brushless DC motors depends upon their demands and uses.
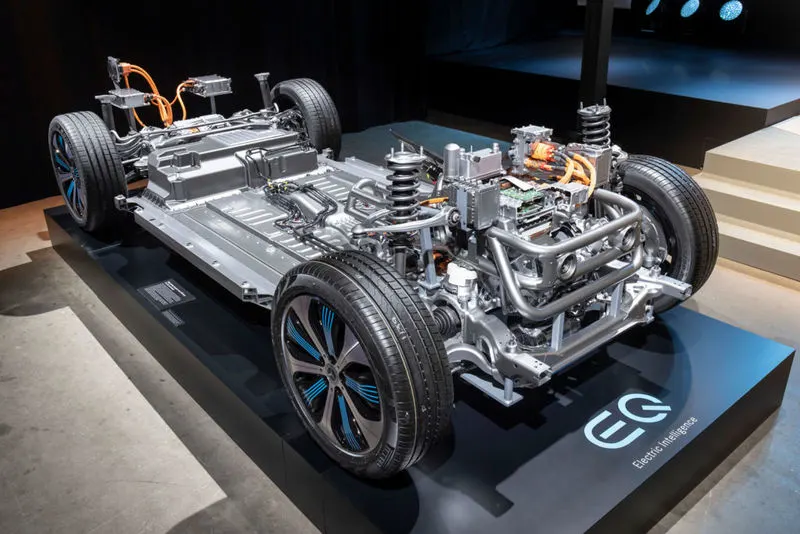
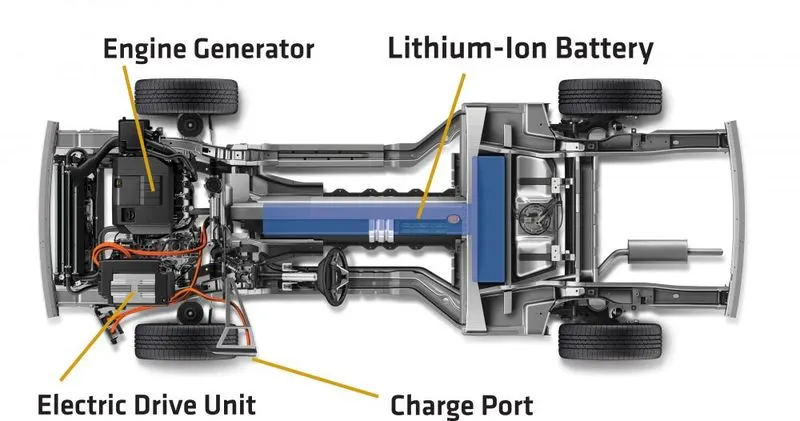
The most important components of eletric vehicles areas:
1.Auxiliary Battery: In an electric drive vehicle, the auxiliary battery provides electricity to power vehicles accesories.
2.Traction Battery Pack: Traction battery pack is also known as Electric vehicle battery (EVB) Which is used to store the electricity.Some examples of traction battery energy storage system are as given ,
3.Lithium-ion
4.Nickel-metal hydride
5.Lead-acid
6.Ultra-capacitors
7.DC/DC Converter: Basically DC/DC converter is an electronic device which is used to convert higher-voltage DC power from the traction battery pack to the lower-voltage DC power. The converted power is used to run the vehicle accessories. It is used to recharge the auxillary battery.
8.Electric Traction Motor: Another important componets is electric traction motor and this device is used to provide motive power to the wheels.
9.Onboard charger: Takes the incoming AC electricity supplied via the charge port and convert it to DC power for charging the traction battery. IT monitors battery characteristics such as voltage,current,temperature,and state of charge while charging the pack.
10.Power Electronics controller: This unit manage the flow of electrical energy delivered by the traction battery, controlling the speed of the electric traction motor and the torque it produces.
11.Charge port: The charge port allows the vehicles to connect to an external power supply in order to charge the traction battery pack.
12.Thermal system(cooling): This system maintains a proper operating temperature range of the electric motor,power electronics,and other components.
MATLAB Modeling of Electric car :
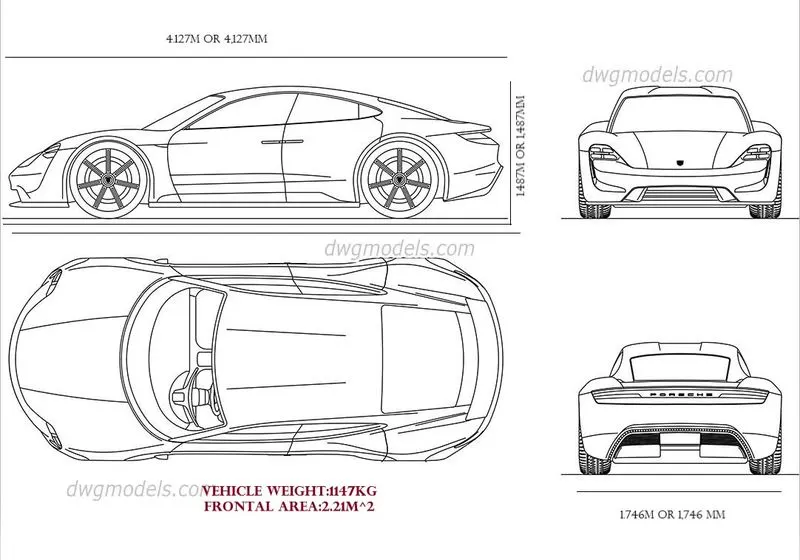
Vehicle technical specification
1.vehicle weight (Kg): 800 kg
2.Number of wheels per axle: 2
3.Total Length: 4.127m or 4,127 mm
4.Total height: 1.487 m or 1,487 mm
5.Total width: 1.746 m or 1,746 mm
Block diagram of EV:
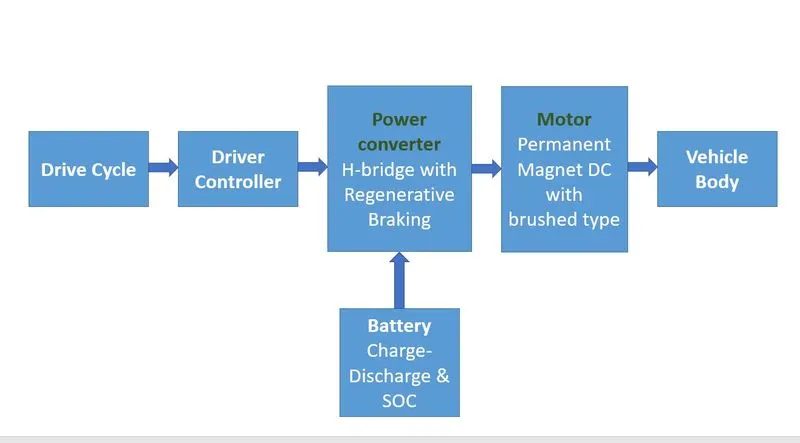
By using MATLAB SIMULINK System Block For Electric Vehicle Design and the Whole design is as :
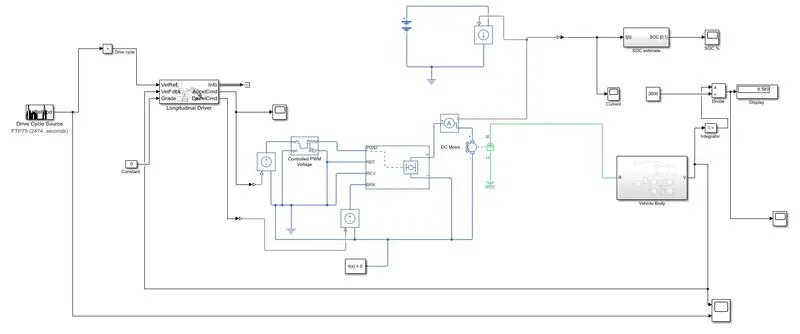
The major block used to design the EV vehicle using matlab simlink are:
1.Drive cycle source
2.controlled PWM voltage
3.H-bridge
4.Battery source
5.DC-motor
6.vehicle body
7.tire's
8.simle gear
9.inertia
10.longitudinal driver
11.integrator
12.solver configuration
13.mechanical referance
14.scope's
1.Drive cycle
Starting with the drive cycle ihave used FTP75 for the operation of the cycle where the stop time is 2474 seconds.
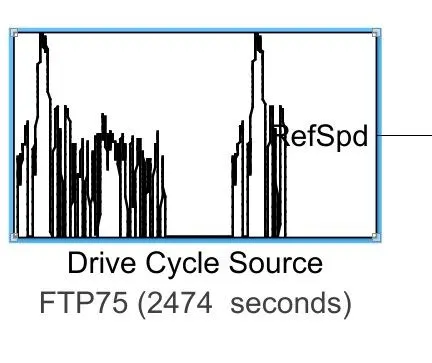
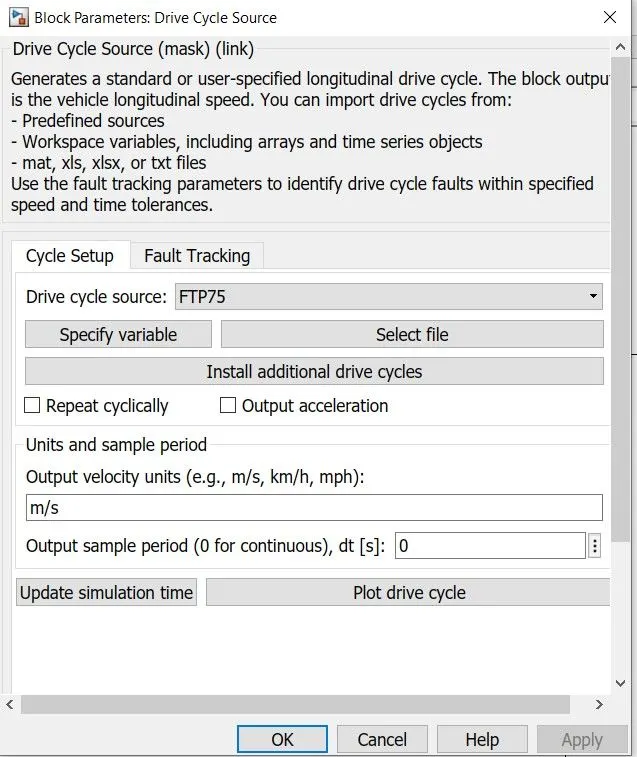
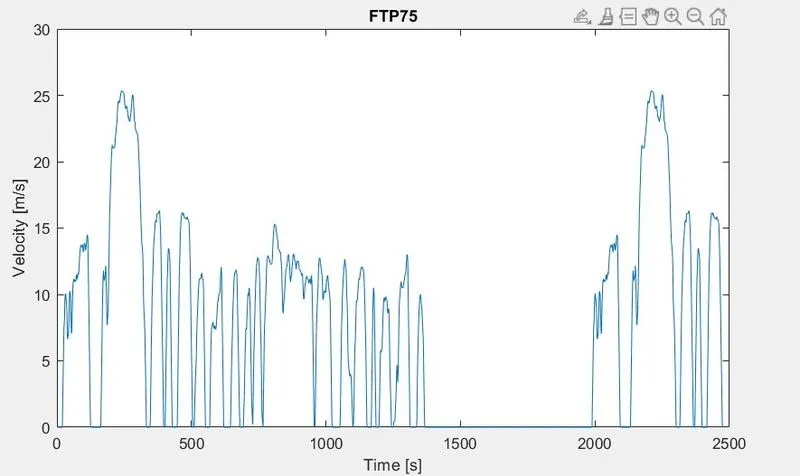
The above snap is the FTP75 drive cycle with the max velocity of 26 m/s.
then the drive cycle is connected to vehicle reference of longitudinal drive block.
2.Longituditanal driver
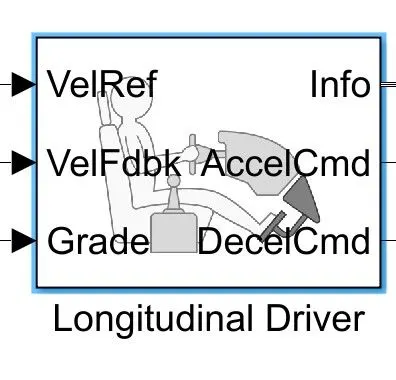
The Longitudinal driver block implements a longitudinal speed-tracking controller. based on reference and feedback velocities,the block generates normalized acceleration and braking commands. we can use the block to model the dynamic response of a driver or to generate the commands necessary to track a longitudinal drive cycle.
It consists of six ports they are:
VelRef = vehicle reference
VelFdbk = vehicle feedback
Grade = gradability
info = information which is terminated here.
AccelCmd = acceleration command
DecelCmd = decceleration command
Here speed is taken as feedback through a simulink ps converter from vehicle subsystem and given gradeability for speed calculation integrator block and a constant is connected with divide blocks positive and negative terminal respectively.Acceleration command is given to control voltage source through a simulink PS converter.
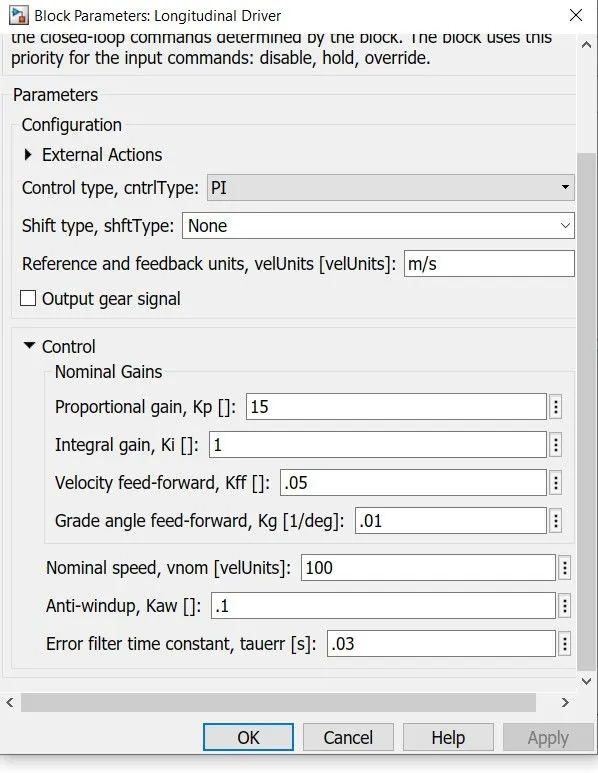
parameter considered:
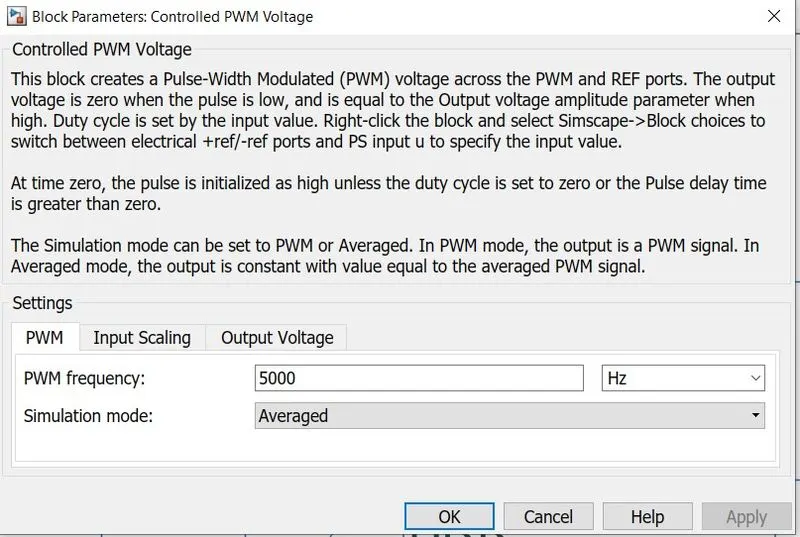
3.Controlled PWM voltage
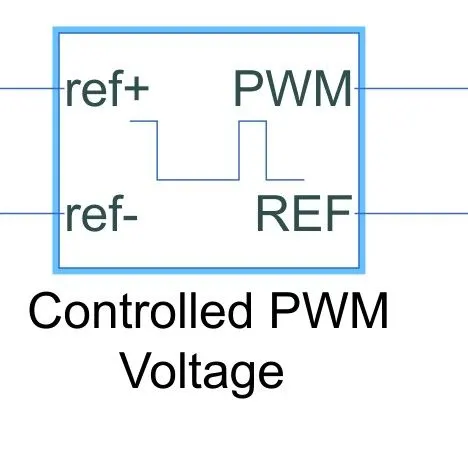
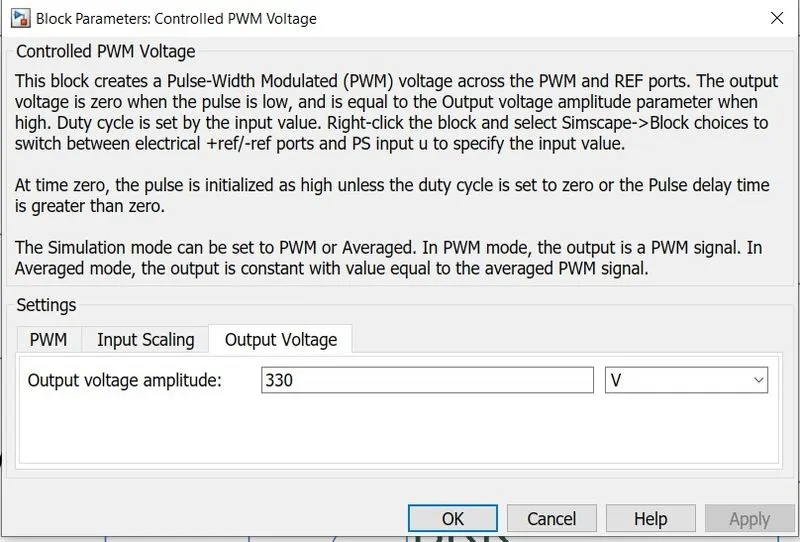
The value of the output voltage amplitude parameter determine amplitude of the output voltage.
The controlled PWM voltage block represent a pulse-width modulated (PWM) voltage source.
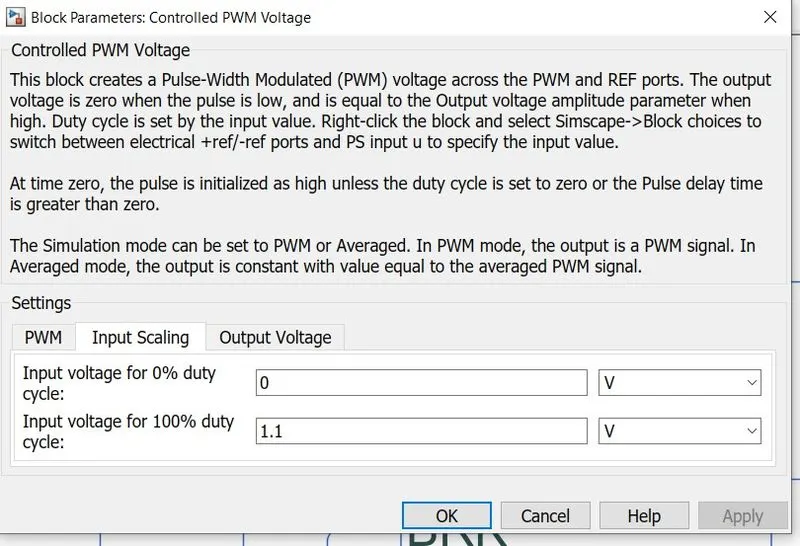
1.Electrical input ports- The block calculate the duty cycle based on the reference voltage across its ref+ and ref- ports. this modelling varientis the default.
2. PS input-specify the duty cycle value directly by using an input physical signal port.
Where
vref is the reference voltage across the ref+ and ref- ports.
vmin is the minimum reference voltage.
vmax is the maximum reference voltage.
parameters considered:
4. H-bridge
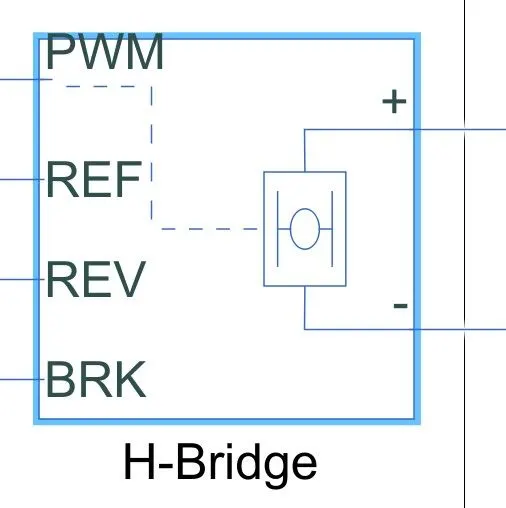
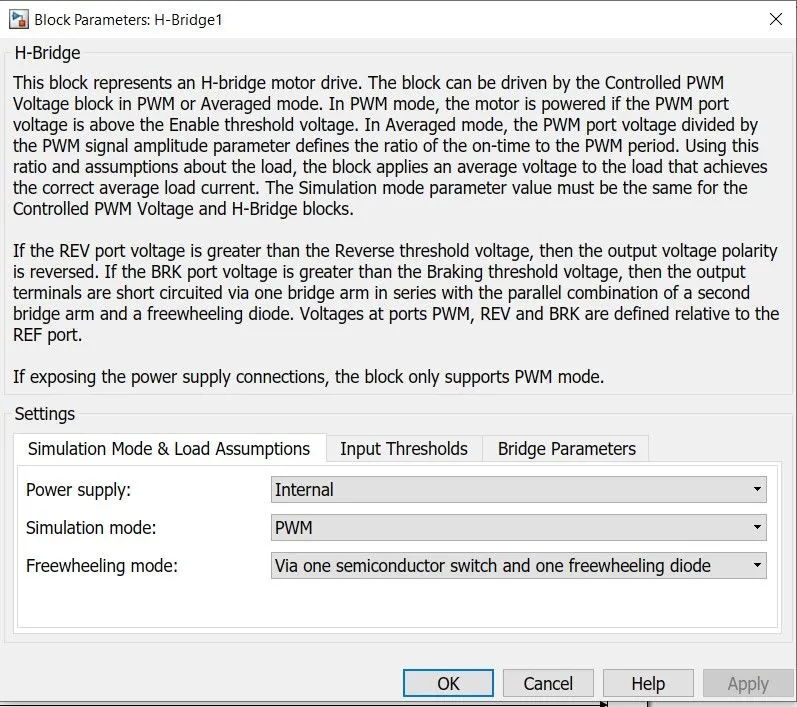
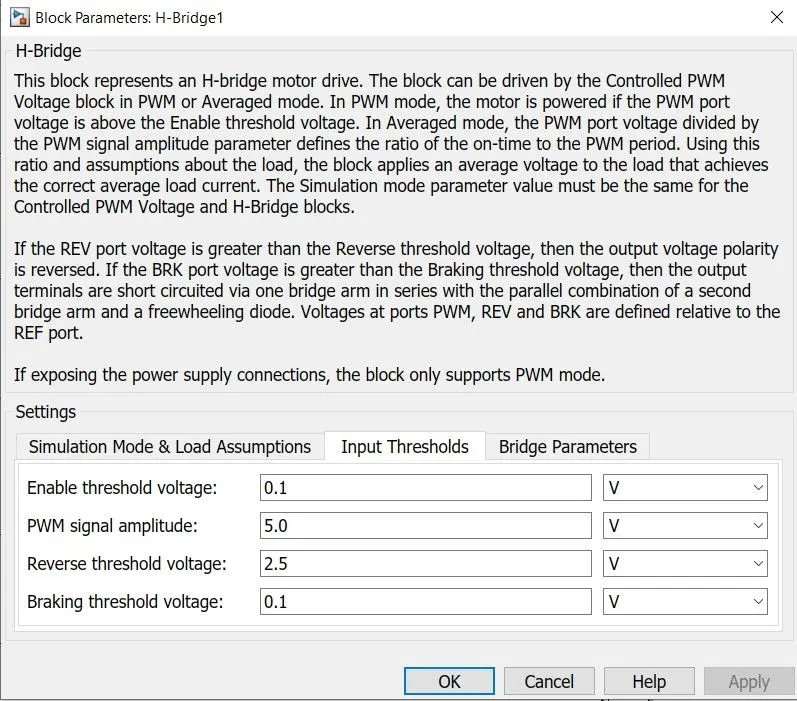
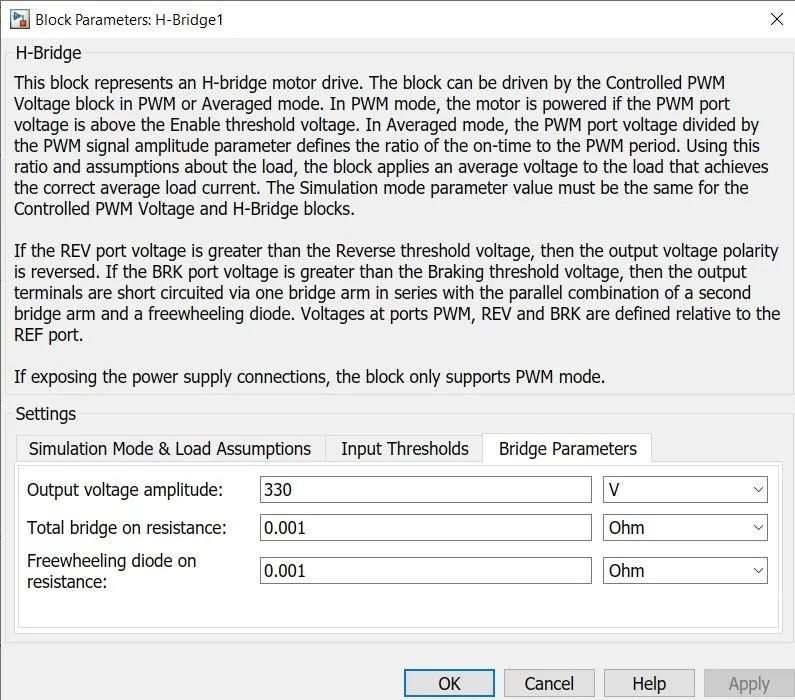
This block represents an H-bridge motor drive. The block can be driven by the controlled PWM voltage block in PWM or average mode. In PWM mode, the motor is powered if the PWM port voltage is above the enable threshold voltage. In Average mode, the Pwm port voltage divided by the PWM signal amplitude parameters defines the ratio of the on-time to the PWM period. Using this ratio and assumption about the load, the block applies an average voltage to the load that achieves the correct average load current . the simulation mode parameter value must be the same for the controlled PWM voltage and H-bridge blocks.
Reverse of H-bridge and both reference output of control PWM voltage and H-bridge is grounded. A solver configuration is connected to the ground reference.
Reference output of control PWM voltage and H-Bridge is connected.
Two output port of H-bridge is connected to a DC motors. Also the positive output of bridge is connected to a controlled current source through a current sensor.
parameter considered:
5.Battery source
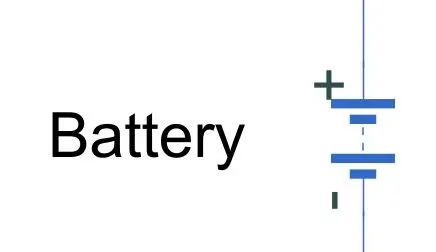
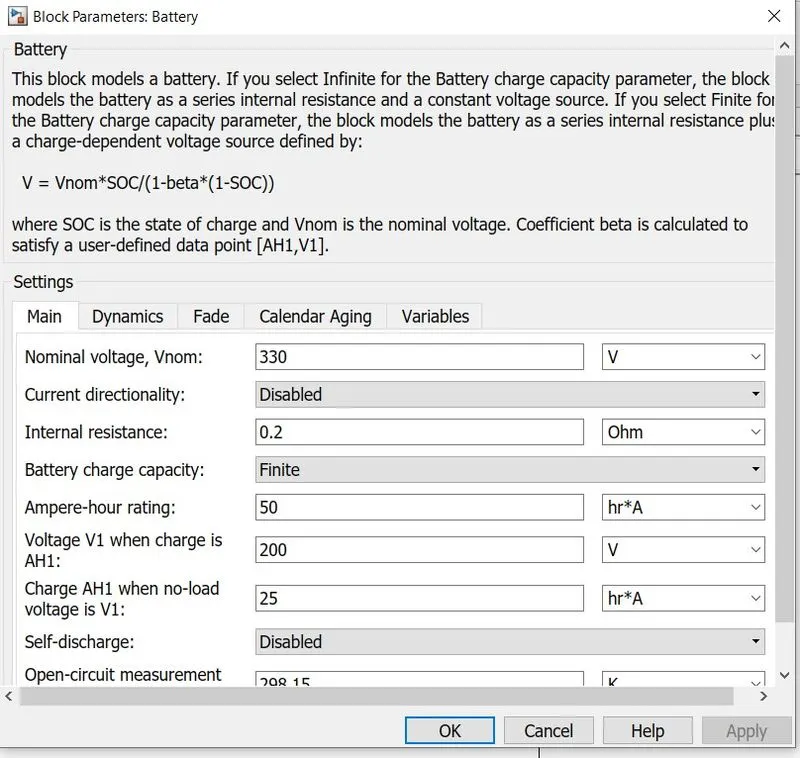
The battery is connect to the H-bridge through the current sensor where the battery is the main power source of the model.
the below model is the complete battery blocks and connections which includes SOC ,controlled current source and PS simulink.
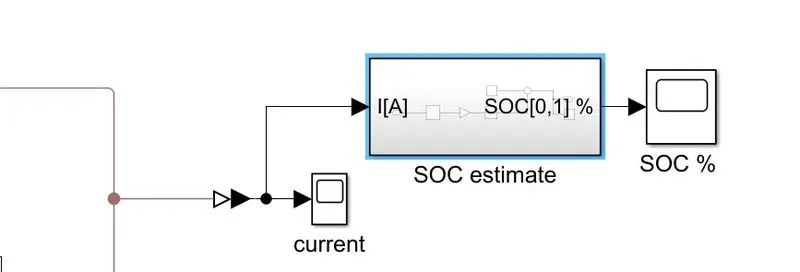
SOC estimate blocks
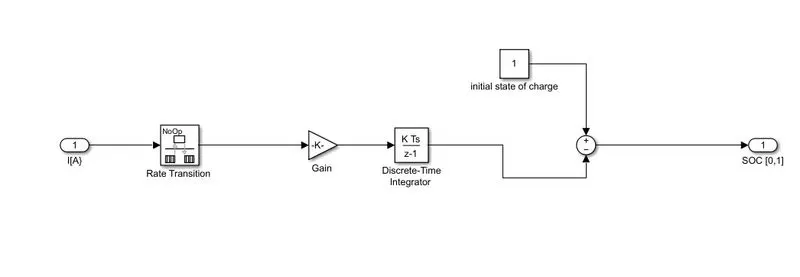
The above subsystem is the SOC estimate block where the rate transition, gain, and discrete time integrator , are connected in series after that this series is added with constant block. this arrangement gives us the SOC.
Parameters considered:
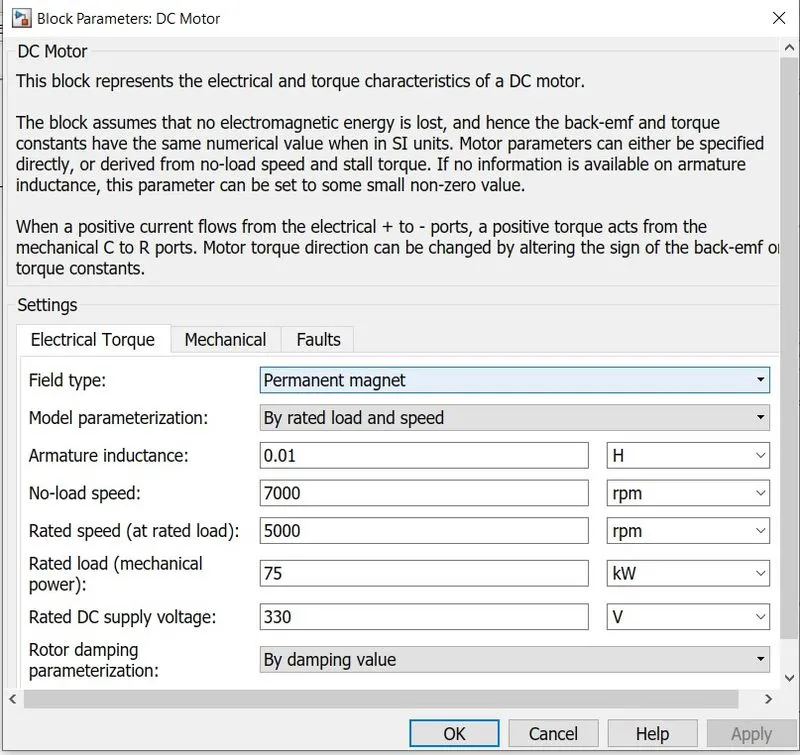
6. DC motor
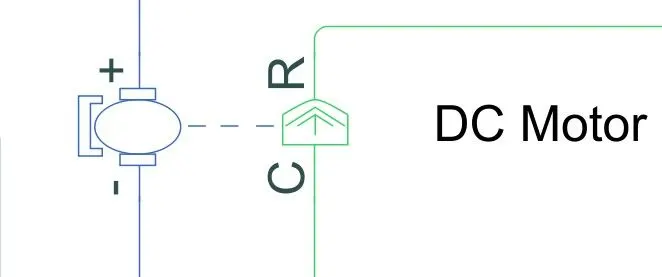
This block represent the electrical and torque characteristics of a DC motor.
When a positive current flows from the electrical + to - ports, a positive torque acts from the mechanical C to R ports.Motor torque direction can be changed by altering the sign of the back-emf or torque constants.
Here the + and - terminals of the dc motor the + and - of the H-bridge respectively.
the mechanical C- port is connected to the mechanical rotational reference and R port is connected to the simple gear of the vehicle dynamics block.
Parameters considered:
7. Vehicle Dynamics
Vehicle dynamics block is a subsystem block which including vehicle body,gear ,terrain,wind,tire,inertia,ideal translational motion sensor and PS converter.
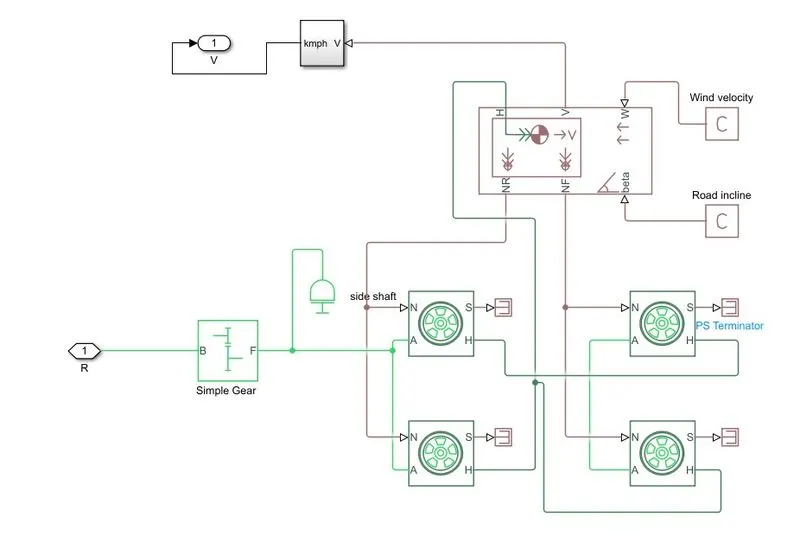
Tire:
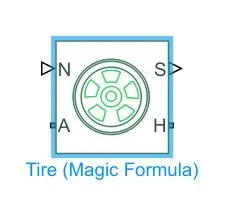
The above blocks is tire with longitudinal behaviour given by magical formula coefficients.
Where H= Hub (mechanical translational port associated with the wheel hub that transmits the thrust generated by the tire to the remainder of the vehicle).
S = slip (physical signal output port associated with the relative slip between the tire and road). its connect to ps terminate.
A = axle (mechanical rotational port associated with the axle that the tire site on).
N = normal force (physical signal input port associated with the normal force acting on the tire. the normal force is possitive if it acts downward on the tire, pressing it against the movement).
the parameters of the tire is taken as same as default value.
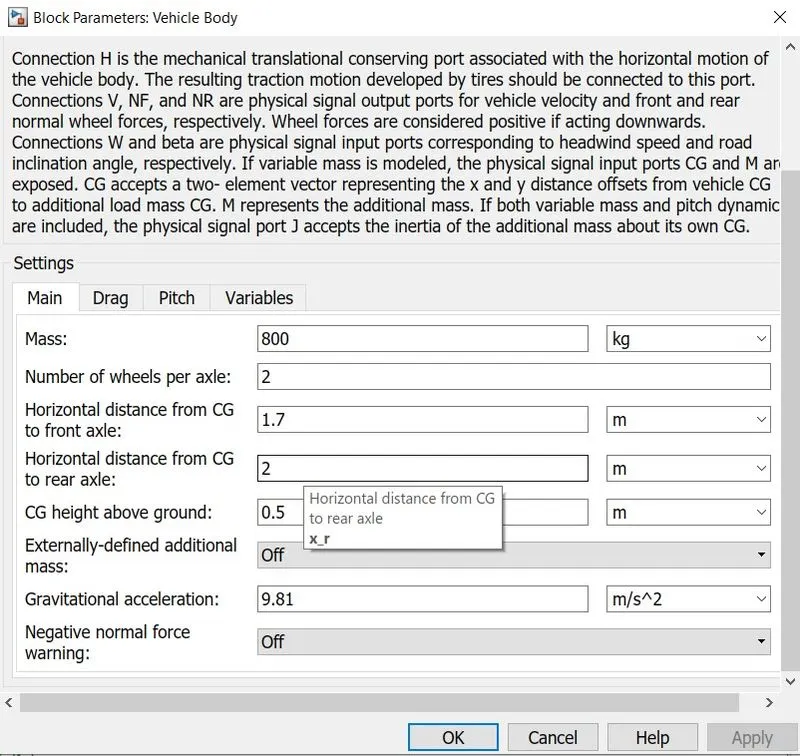
8. Vehicle body
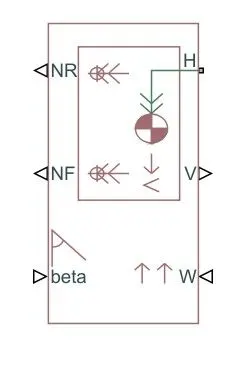
The vehicle body block represent a two- axle vehicle body in longitudinal motion. the vehicle can have the same or a different number of wheels on each axle. For example , two wheels on the front axle and one wheel on the rear axle. the vehicle wheels are assumed identical in size. the vehicle can also have a center gravity (CG) that is at or below the plane of travel.
Where;
NRNR= rear axle normal force (physical signal output port for normal force on the rear axle. Wheel forces are considered positive if acting downwards.)
NFNF= front axle normal force (physical signal output port for normal force on the front axle.Wheel forces are considered positive if acting downwards).
beta= road incline angle (physical signal input port for road incline angle).
WW= wind (physical signal input port for headwind speed.)
HH= horizontal motion (conserving port associated with the horizontal motion of the vehicle body. connect tire traction motion to this port.)
VV= longitudinal velocity (physical signal output port for vehicle longitudinal velocity).
parameters considered:
9.Simple gear block
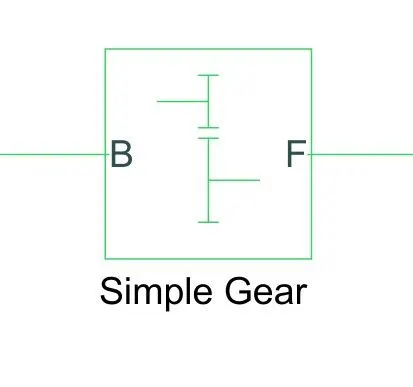
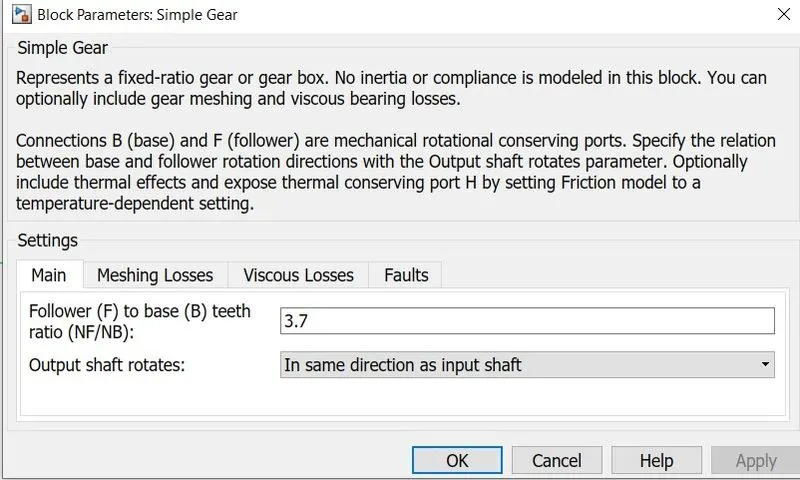
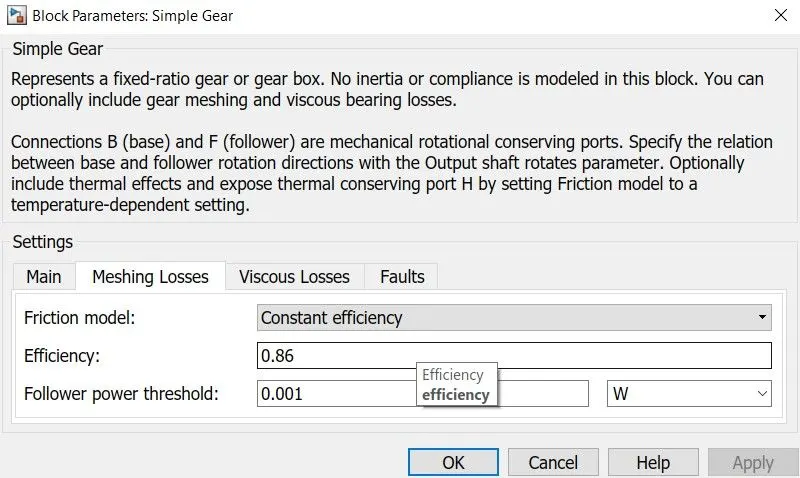
This block represent a fixed-ratio gear or gear box. No inertia is modeled in this block. You can optionally include gear meshing and viscous bearing losses. In this block two port, B Port and F port . B stand for base and F stand for follwer. This port are mechanical rotational conserving ports.
Parameters considered:
Result:
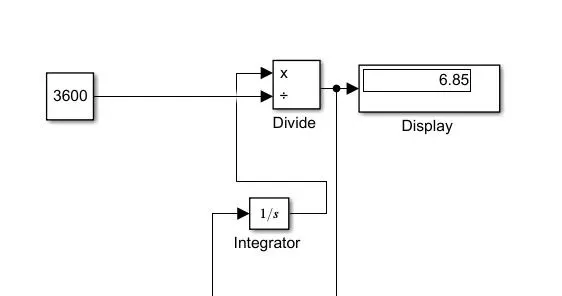
The distance obtained for a given FTP75 drive cycle with 330V Battery capacity is able to cover 6.85 km distance.
State of charge (SOC):
The state of charge represent the battery capacity left over for the vehicle and it is showed by the below graph.
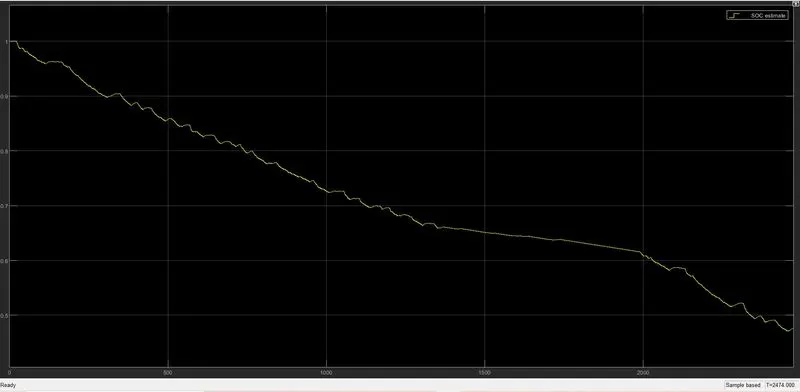
In the above graph we can see ups and down this indicates the acceleration and de-acceleration of the vehicle , constant value is because of regenerative braking at initial the battery capacity was 100% and to complete the drive cycle it is discharge by 28%
Current:
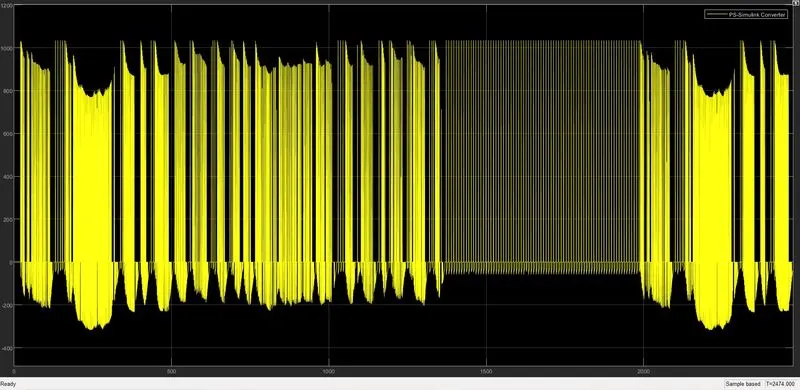
This graph shows the current flow varying from battery to motor for the given FTP75 drive cycle.
Vehicle speed performance:
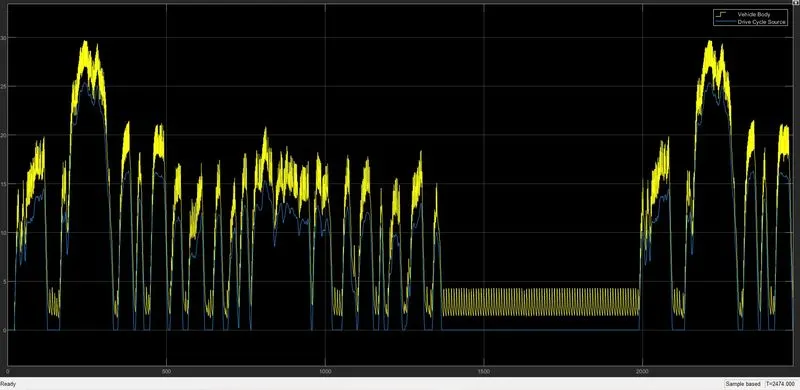
From the obtained vehicle speed performance we can conclude that vehicle has attained its maximum speed and there is a very slightly delay in the de acceleration but the acceleration and top speed were performed very well by the vehicle. we can also obtained the current and voltage profile from the simulation using scope.
Conclusion:
EV has obtained an output according to the FTP75 drive cycle and it can be tested for many drive cycle by selecting in the drive cycle block. It has travelled 6.85 km by the present 330V battery capacity if we increase the battery capacity to higher levels we can travel more distance but in real time this should be done by considering the space and cost.