Final Project: Design of an Electric Vehicle
Introduction:
An electric vehicle is a vehicle that uses one or more electric motors or traction motors for propulsion. It can be powered through a collector system by electricity from off-vehicle sources or maybe self-contained with a battery, solar panels fuel cells or an electric generator to convert fuel to electricity.
EVs came into existance in mid 19th century, when electricity was among the preferred methods for motor vehicle propulsion providing a level of comfort and ease of operation that could not be achieved by gasoline cars at the time. They have been in resurgence due to technological developments and an increased focus on renewable energy. A great deal of demand for electric vehicles developed. Thus various government schemes and incentives have been brought to the fore-front for research and development in the area of electric vehicle design. Evs are expected to increase from 2% of global share in 2016 to 22% in 2030.
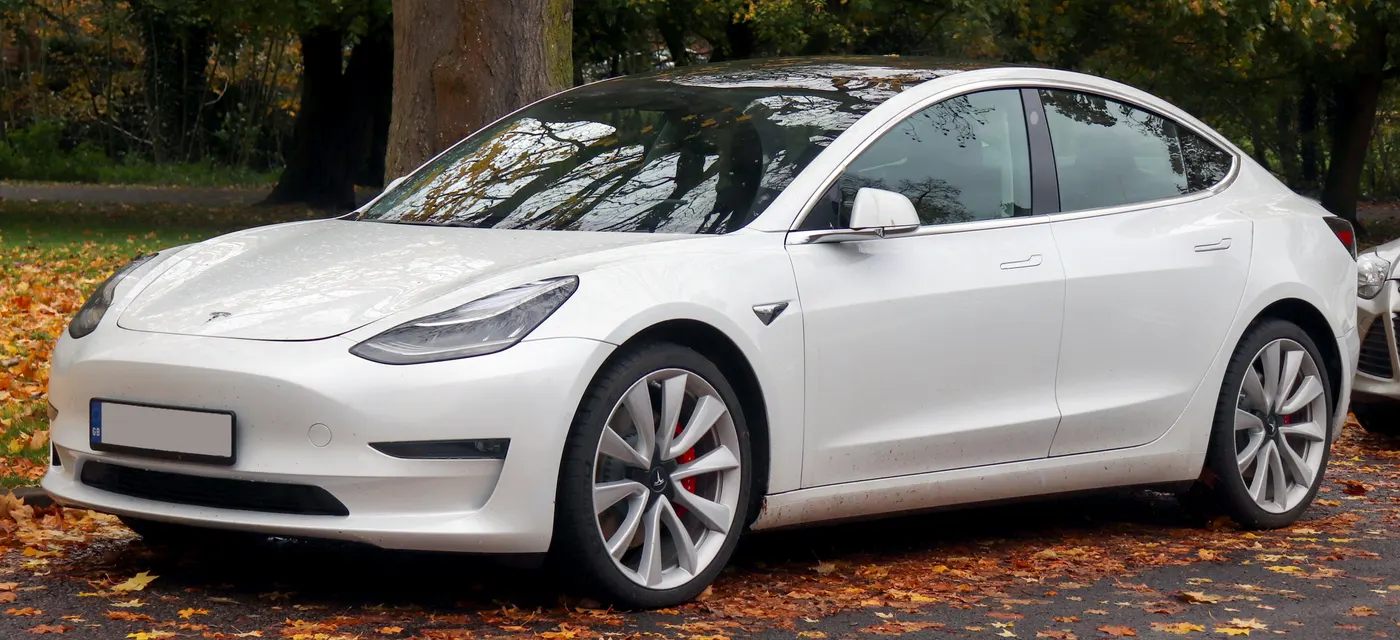
There are three main types of electric vehicles classed by the degree that electricity is used as their energy source:
- Battery Electric Vehicle (BEV)
- Plug-in Hybrid Electric Vehicle (PHEV)
- Hybrid Electric Vehicle (HEV)
Battery Electric Vehicles:
Battery Electric Vehicles, also called BEVs, and more frequently called EVs, are fully-electric vehicles with rechargeable batteries and no gasoline engine. Battery electric vehicles store electricity onboard with high-capacity battery packs. Their battery power is used to run the electric motor and all onboard electronics. BEVs do not emit any harmful emissions and hazards caused by traditional gasoline-powered vehicles. BEVs are charged by electricity from an external source. EV chargers are classified according to the speed with which they recharge an EVs battery.
The classifications are Level 1, Level 2, and Level 3 or DC fast charging. Level 1 EV charging uses a standard household i.e 120V outlet to plug into the electric vehicle and takes over 8 hours to charge an EV for approximately 75-80 miles. Level one charging is typically done at home or at your workplace. Level 1 chargers have the capability to charge most EVs on the market.
Level 2 charging requires a specialized station which provides power at 240v. Level 2 chargers are typically found at workplaces and public charging stations and will take about 4 hours to charge a battery to 75-80 miles of range.
Level 3 charging, DC fast charging, or simply fast charging is currently the fastest charging solution in the EV market. DC fast chargers are found at dedicated EV charging stations and charge a battery up to 90 miles range in approximately 30 minutes.
BEV models that charge on DC level 3 fast chargers:
- Tesla Model 3
- BMW i3
- Nissan LEAF
- Hyundai Ioniq
- Chevy Bolt
- Volkswagen e-Golf
Plug-in Hybrid Vehicles:
Plug-in Hybrid Electric Vehicles or PHEVs can recharge the battery through both regenerative braking and plugging in to an external source of electrical power. While standard hybrids at low speed can go about 1-2 miles before the gasoline engine turns on, PHEV models can go anywhere from 10-40 miles before their gas engines provide assistance.
Examples:
- Chevy Volt
- Chrysler Pacifica
- Ford C-Max Energi
- Mercedes C350e
- Audi A3 E-Tron
- Fiat 500e
Hybrid Electric Vehicle:
HEVs are powered by both gasoline and electricity. The electric energy is generated by the car’s own braking system to recharge the battery. This is called regenerative braking a process where the electric motor helps to slow the vehicle and uses some of the energy normally converted to heat by the brakes.
HEVs start off using the electric motor, then the gasoline engine cuts in as load or speed rises. The two motors are controlled by an internal computer, which ensures the best economy for the driving conditions.
Examples:
- Toyota Prius Hybrid
- Honda Civic Hybrid
- Toyota Camry Hybrid
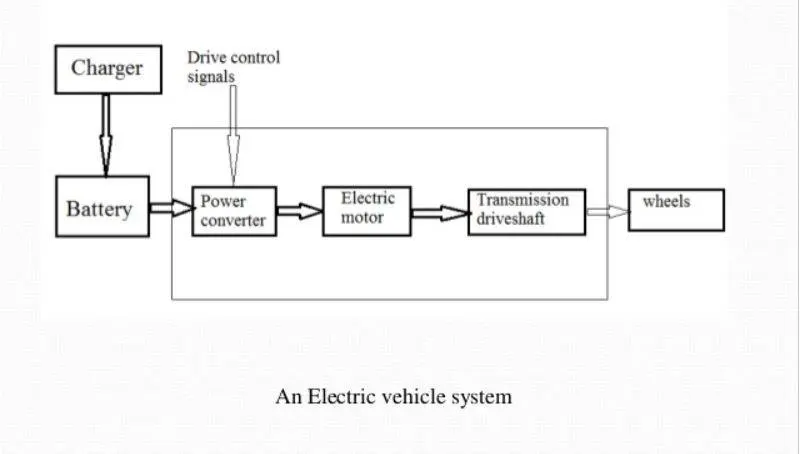
The block diagram of an electric vehicle is as given below:
Electric Vehicle powertrain:
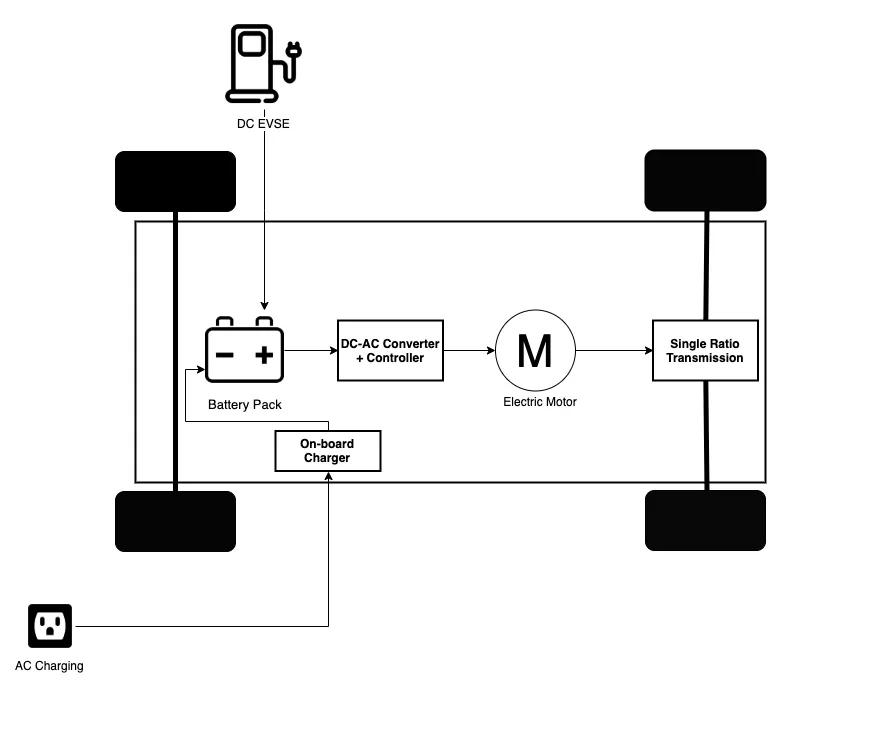
The powertrai provides power to the vehicle. Powertrain refers to the set of components that generate the power required to move the vehicle and deliver it to the wheels. An EV powertrain has 60% fewer components than the powertrain of an ICE vehicle.
The main components of an EV powertrain are:
- Battery pack: It is made up of multiple lithium-ion cells and stores the energy needed to run the vehicle. Battery packs provide direct current output.
- DC-AC converter: The DC supplied by battery pack is converted to AC and supplied to the electric motor. This power transfer is managed by a motor control mechanism that controls the frequency and magnitude of the voltage supplied to the electric motor in order to manage the speed and acceleration as per driver's instructions communicated via acceleration/brakes.
- Electric motor: Converts electrical energy to mechanical energy that is delivered to the wheels via single ratio transmission. Many EVs use motor generators that can perform regeneration as well.
- On-board charger: Converts AC received through charge port to DC and controls the amount of current flowing into the battery pack.
- Battery Management Systems: A BMS continuously monitors the state of the battery and is responsible for taking necessary measures in case of mlfunction. BMS performs cell balancing to deliver maximum efficiency from the battery pack. It is responsible for communication with other ECUs and sensors as well as EVSes to control the charging input check the current stage of charge and share data about battery specifications.
- DC-DC converter: A battery pack delivers a fixed voltage but the requirement of different accessory systems in the EV would vary. It helps in distributing power to different systems by converting output power from battery pack to the expected level. After conversion power is delivered to respective smaller ECUs via wiring harness.
- Thermal Management Systmem: Responsible for maintaining optimum operating temperature range for powertrain components.
- Body Control Module (BCM): It is responsible for supervising and controlling the functions of electronic accessories such as power windows, mirrors, security and vehicle access control.
EV modelling in Simulink:
A simple electric vehicle model can be created in Simulink using the following subsystems:
1. Vehicle body:
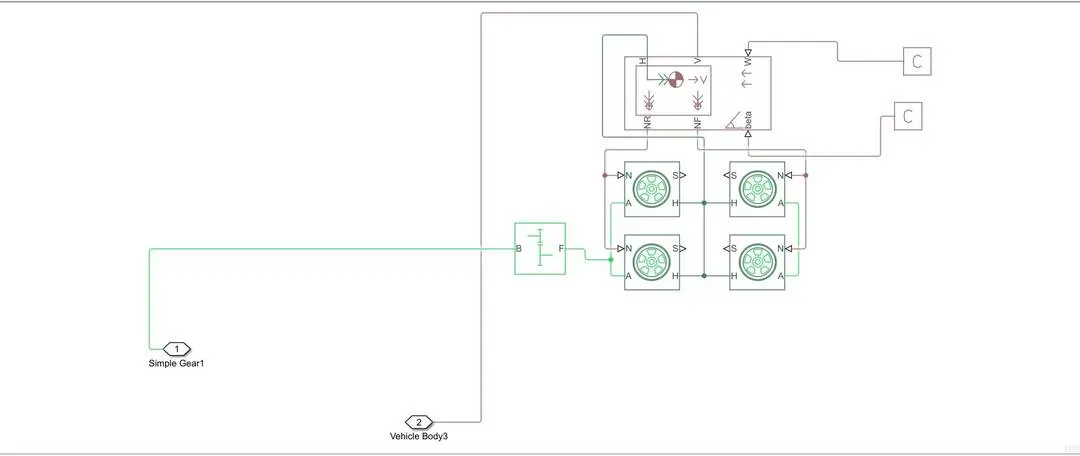
This subsystem consists of following blocks:
- Magic Tire:
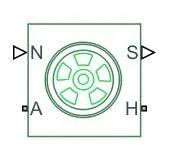
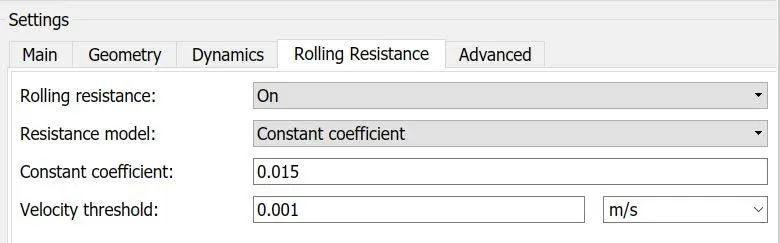
This block contains parameters which define the forces that act on the wheels of an EV. The Tire (Magic Formula) block models the tire as a rigid wheel-tire combination in contact with the road and subject to slip. When torque is applied to the wheel axle, the tire pushes on the ground (while subject to contact friction) and transfers the resulting reaction as a force back on the wheel. This action pushes the wheel forward or backward. If you include the optional tire compliance, the tire also flexibly deforms under load.
The ports are as follows:
- N - Normal force
- S - Slip
- A - Wheel axle
- H - Wheel hub
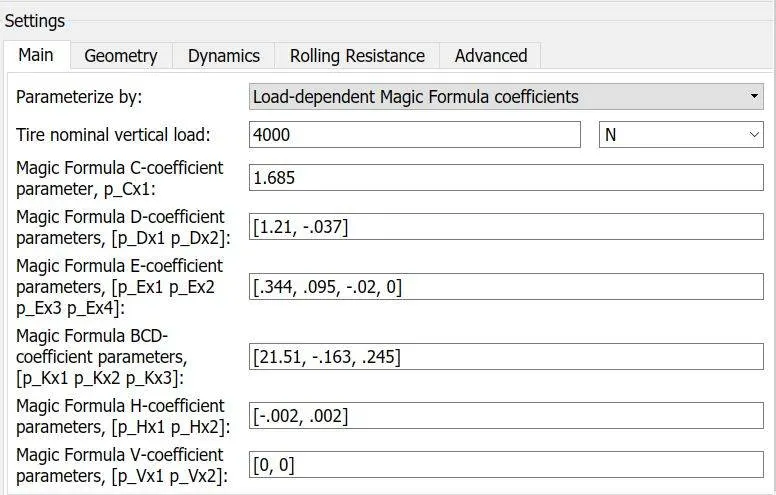
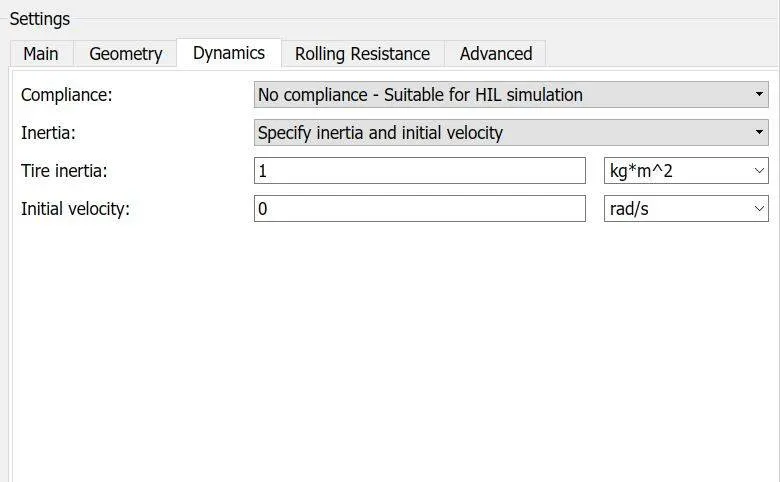
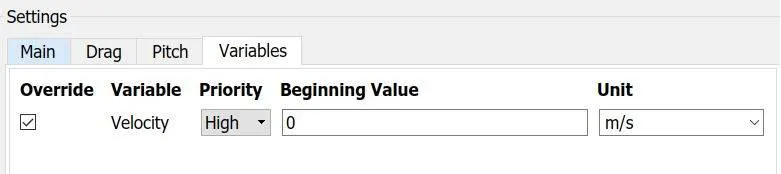
The parameter values are set as:

- Vehicle Body:
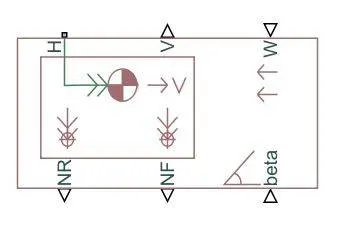
This block represents a two-axle vehicle body in longitudinal motion. The vehicle can have the same or a different number of wheels on each axle. For example, two wheels on the front axle and one wheel on the rear axle. The vehicle wheels are assumed identical in size. The vehicle can also have a center of gravity (CG) that is at or below the plane of travel.
The block accounts for body mass, aerodynamic drag, road incline, and weight distribution between axles due to acceleration and road profile. Optionally include pitch and suspension dynamics. The vehicle does not move vertically relative to the ground.
The ports are as follows:
- H - Wheel hub
- V - Vehicle velocity
- W - Wind velocity
- NR - Normal force on rear wheels
- NF - Normal force on front wheels
- beta - Road gradient
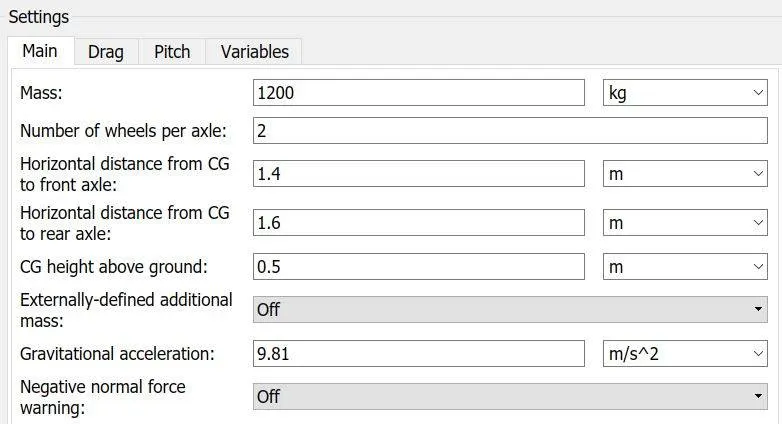
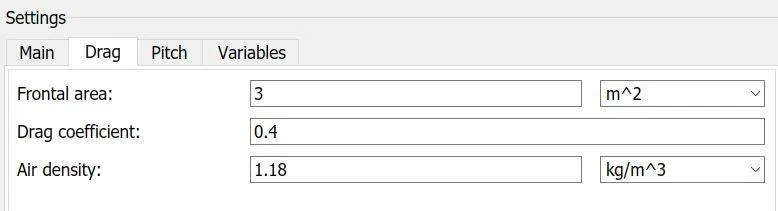
The parameter values are set as:
- Simple gear:
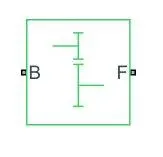
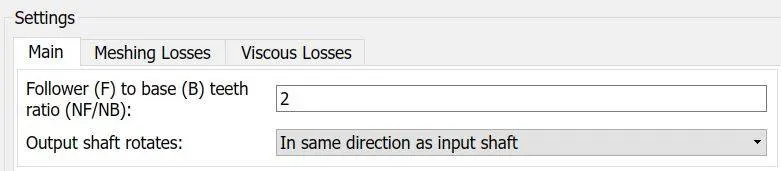
The Simple Gear block represents a gearbox that constrains the connected driveline axes of the base gear, B, and the follower gear, F, to corotate with a fixed ratio that you specify. You choose whether the follower axis rotates in the same or opposite direction as the base axis. If they rotate in the same direction, the angular velocity of the follower, ωF, and the angular velocity of the base, ωB, have the same sign. If they rotate in opposite directions, ωF and ωB have opposite signs.
2. DC Motor block:
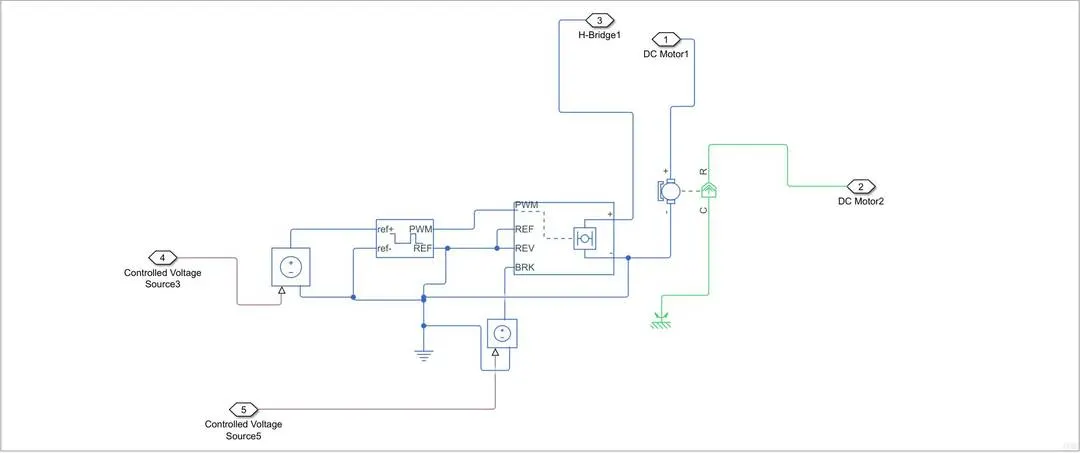
This subsystem consists of following blocks:
- Mechanical Rotational Reference:
The Mechanical Rotational Reference block represents a reference point, or frame, for all mechanical rotational ports. All rotational ports that are rigidly clamped to the frame (ground) must be connected to a Mechanical Rotational Reference block.

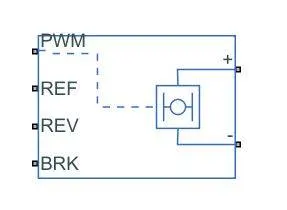
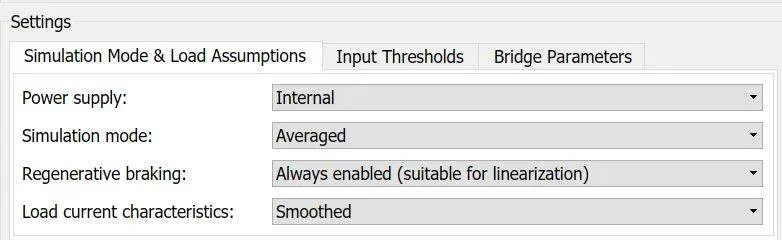
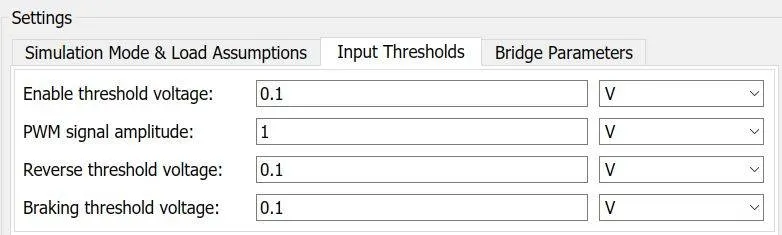
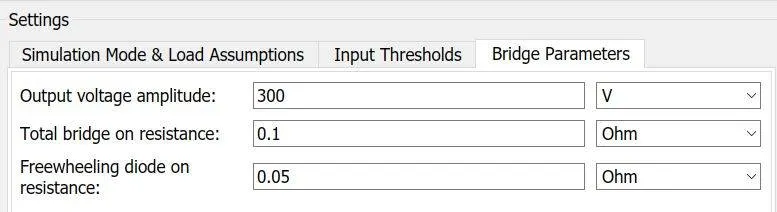
- H-Bridge:
It represents an H-bridge motor driver. The block has following ports:
- + - Positive load connection
- - - Negative load connection (electric reference)
- PWM - PWM control signal port
- REF - Connected to electric reference
- REV - Polarity changing according to the required output signal
- BRK - Supply voltage for braking operations
- Controlled PWM voltage:
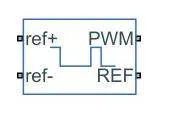
The ports are:
- ref+ - Positive reference voltage
- ref- - Negative reference voltage
- PWM - PWM signal
- REF - Elecrical reference
- DC Motor:
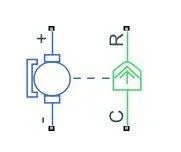
The ports are as follows:
+ - Motor positive terminal
- - Motor negative terminal
C - Mechanical conserving port assoiated with casing
R - Mechanical conserving port associated with rotor shaft of motor which produces required input to the transmission system
This block is the main part of the subsystem.
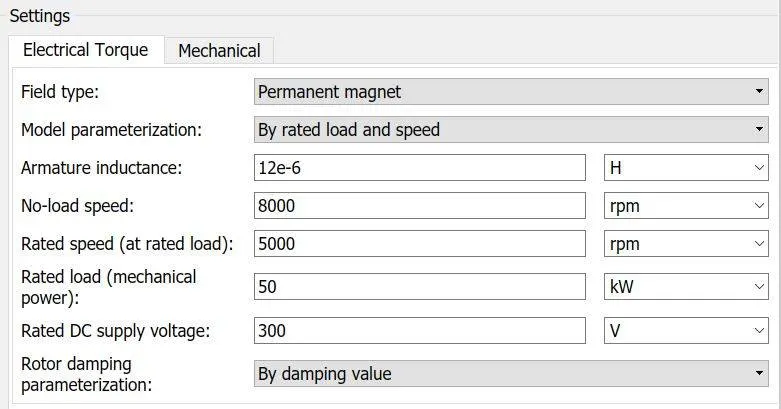
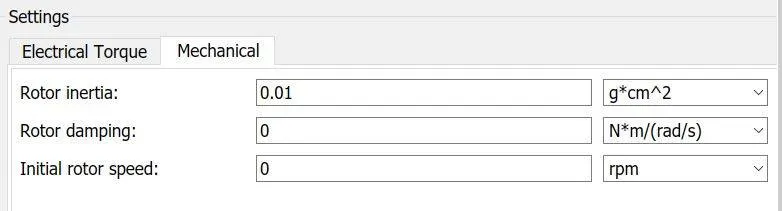
- Electric Reference:
The Electrical Reference block represents an electrical ground. Electrical conserving ports of all the blocks that are directly connected to ground must be connected to an Electrical Reference block. A model with electrical elements must contain at least one Electrical Reference block.

- Controlled current source:
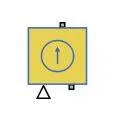
The Controlled Current Source block represents an ideal current source that is powerful enough to maintain the specified current through it regardless of the voltage across the source. The output current is I = Is, where Is is the numerical value presented at the physical signal port. The positive direction of the current flow is indicated by the arrow.
- Battery:
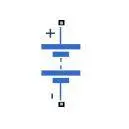
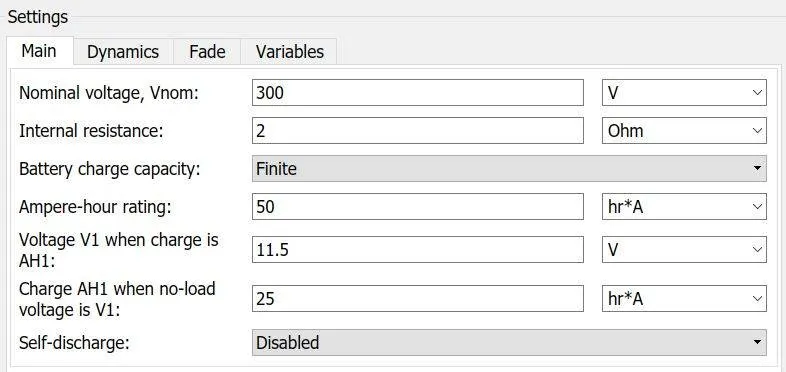
This block represents a simple battery model. The required voltage is supplied to the DC motor by the battery.
- Current sensor:
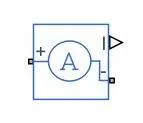
The Current Sensor block represents an ideal current sensor, that is, a device that converts current measured in any electrical branch into a physical signal proportional to the current. Connections + and – are electrical conserving ports through which the sensor is inserted into the circuit. Connection I is a physical signal port that outputs the measurement result.
3. SOC Calculation block:
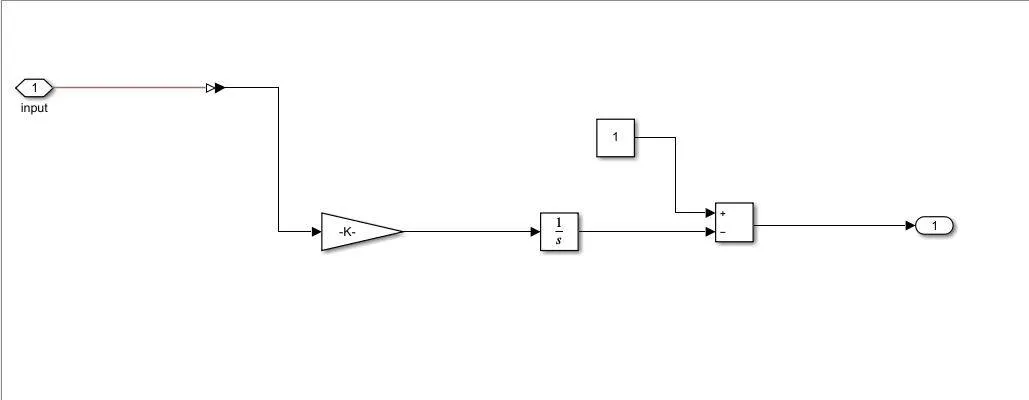
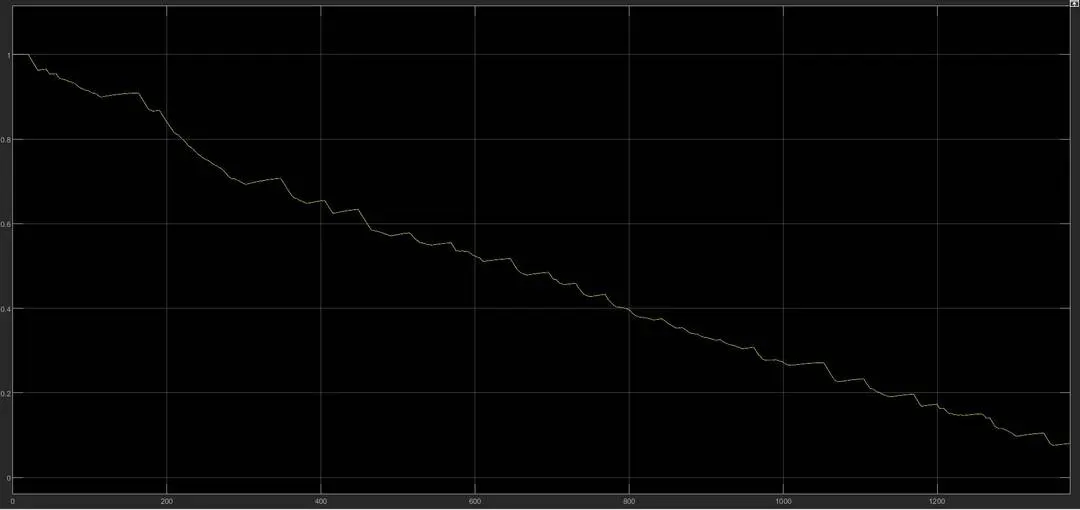
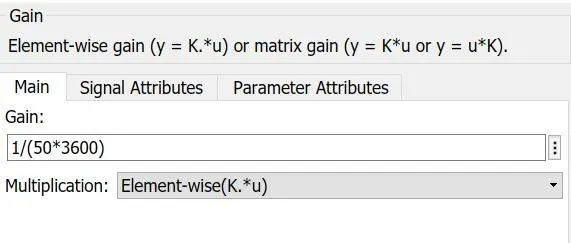
This block plots the variation in the battery state of charge of the electric vehicle over the period of time. As the distance increases the state of charge decreases. The gain block value is entered as follows,
4. Longitudinal driver:
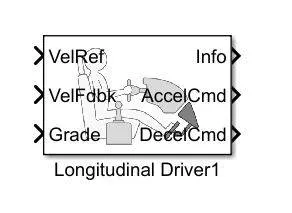
The Longitudinal Driver block implements a longitudinal speed-tracking controller. Based on reference and feedback velocities, the block generates normalized acceleration and braking commands that can vary from 0 through 1. This block is used to model the dynamic response of a driver or to generate the commands necessary to track a longitudinal drive cycle.
5. Drive cycle source:
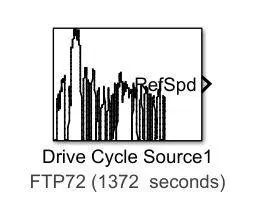
The Drive Cycle Source block generates a standard or user-specified longitudinal drive cycle. It basically consists of a velocity vs time plot of an electric vehicle as it travels for a certain period of time. This block is used to estimate the resistive forces acting on the vehicle, fuel economy, etc. The drive cycle used for the simulation is 'FTP72' having a time period of 1372 seconds.
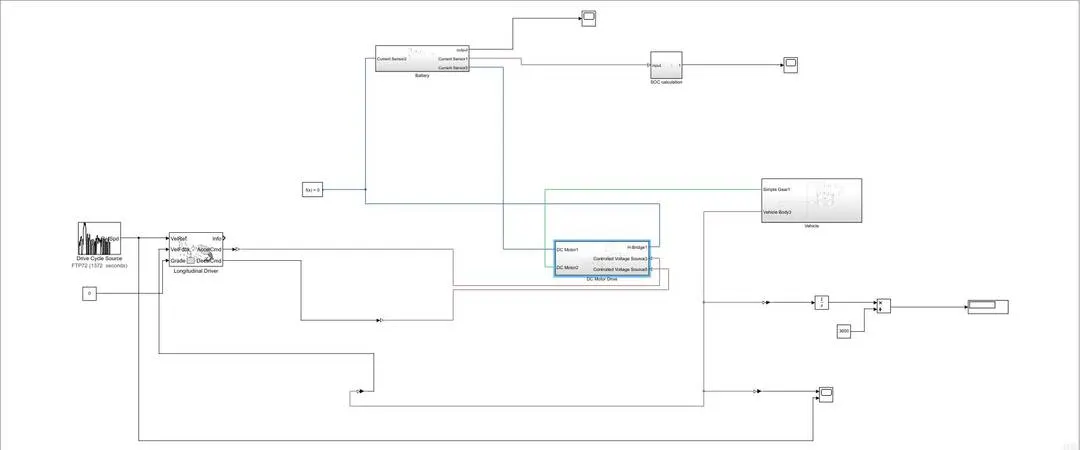
The final model after connecting all the subsystems looks as below,
The simulation is run for 1372 seconds and the following results are observed,
Velocity:
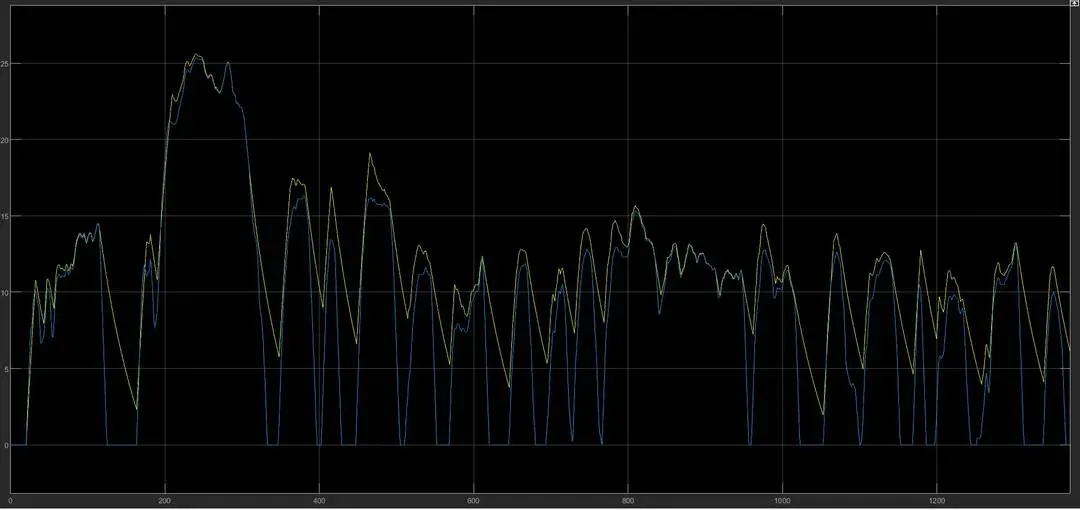
The yellow curve represents the reference speed plot as given by the drive cycle source, while the blue curve represents the actual characteristics of the vehicle. The variations in the two plots can be attributed to slip in the wheels, rolling resistance against the vehicle tires, wind velocity, etc.
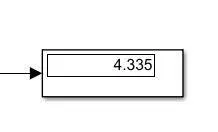
Distance travelled (in km):
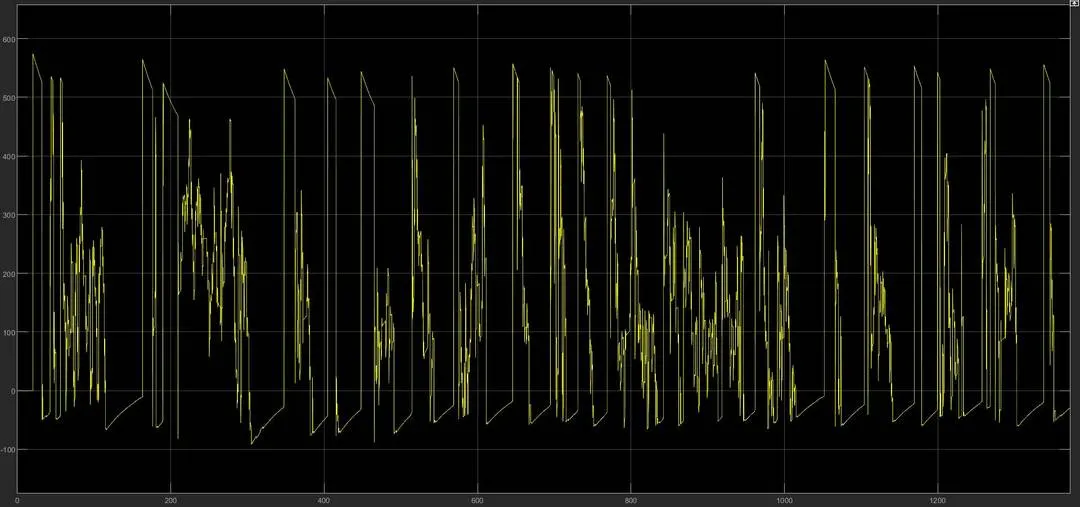
Current plot:
Battery SOC: