Final Project: Design of an Electric Vehicle
LIVE SESSION BATCH (MATLAB TRAIL VERSION)
Create a MATLAB model of electric car which uses a battery and a DC motor. Choose suitable blocks from Powertrain block set. Prepare a report about your model including following:
ANSWER:-
Electric vehicle:-
-
Electric vehicle (EV) is defined as a vehicle that uses an elect ric motor or a traction motor for propulsion unlikely to an internal combustion (lC) engine used by conventional vehicles.
-
Electric vehicles use electric power instead of fuels as convent on all vehicles would and because of this difference, electricvehicles do not produce any exhaust gases or pollution(Zero emission).
-
The power needed forthe operation of an EV can come from a variety of sources such as batteries,generators, or through a collector system.
-
MATLAB modelof electric car which uses lithiumion battery and induction motor.Choose suitable blocks from Powertrain block set.
-
To Modeland Simulate an electric vehicle with SIMULINK.
-
Let us consider a modelinthisreport,an elect ric vehicle with a Induction motor and battery system using the SIMULINK .
-
Inmodelling this EV fora drive cycle andtocheck periormance parameters :to measure speed,soc, and the current characteristics of its battery system.
Objectives:-
1. System level configurations
2. Model parameters
3. Results
4. Conclusion
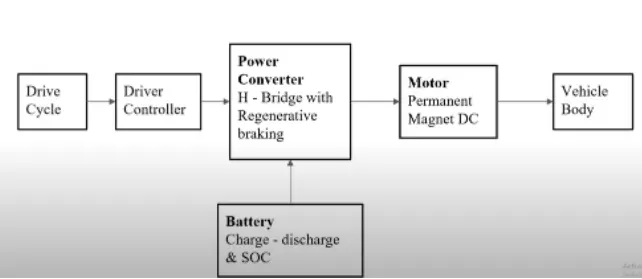
BLOCK DIAGRAM:-
SUBSYSTEMS:-
vehicle body:-
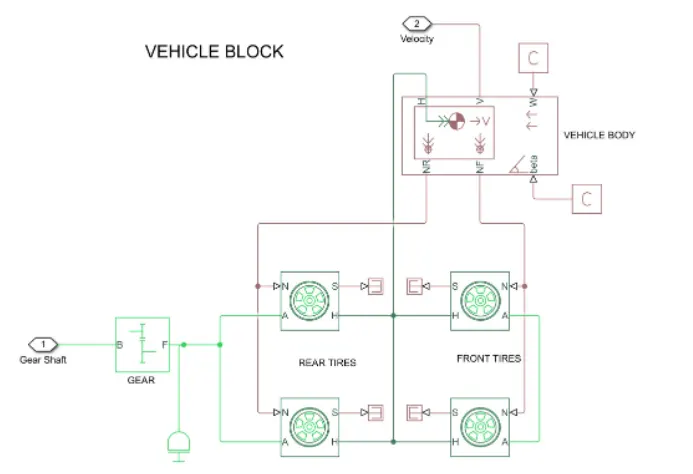
- This subsystem represents the two axle vehicle body in motion.
- It accounts with a body mass, aerodynamic drag, grade,externally defined mass and center of gravity of the vehicle
Input ports:-
- W represents the wind velocity in m/s
- beta - Grade angle in radians.
Output ports:-
- V represents the velocity in m/s
- NR - Normal force on Rear Axle (N)
- NF-vNormal force on front axle(N)
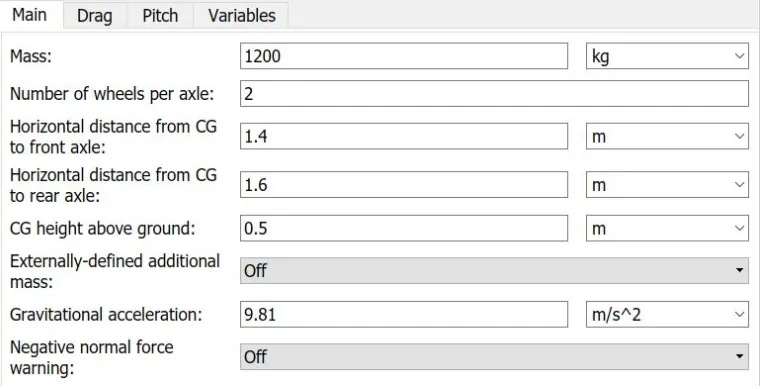
Vehicle Body Parameters:-
- vehicle body mass, centre of gravity distance values and aerodynamic drag variables are modified.
- Pitch dynamics are kept ON with other variable values as default values.
Tires:-

- It is used to model a tire with longitudinal behavior given by equation on four fitting coeffiicients.
- The block can model tire dynamics under constant or variable contact surface conditions.
Input ports:-
- N denotes the Normal force acting on tire , positive when force is acting downwards/towards the contact surface.
Output ports:-
- here S is the output port where s denotes the slip value to tire and surface of contact.
Conserving ports:-
- here H- means hub which transmits the thrust generated by the wheel to the body of the vehicle.
- A- represents axle on which the tires are mounted.
Gear:-

- A simple gear block is used to connect the motor to the rear axle of the vehicles.
- It represents the gearbox which connects the input shaft to the base gear and output from the foller gear.
Conserving ports:-
- Here B represents the port associated with input shaft (motor shaft)
- and F denotes the port associated with output shaft (axle/ differential )
Simple Gear Parameters:-
- Gear ratio is modified and as well as output direction also modified.
- Meshing loss is kept constant, gear is having a constant efficiency throughout the simulation.
- other losses and faults are kept constant.
Motor power Converter:-
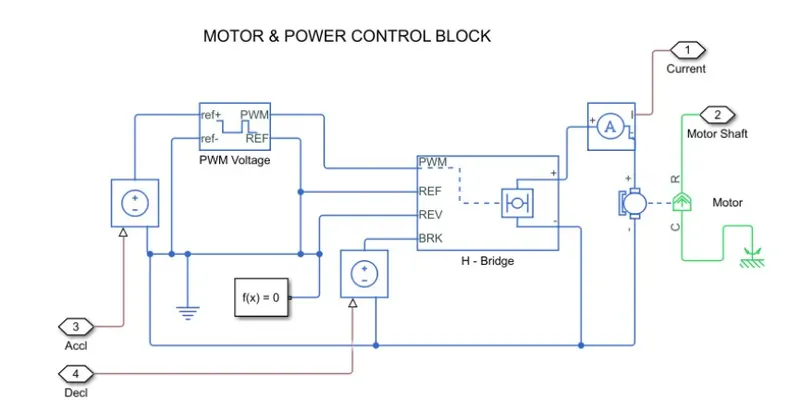
- The motor & its control block is as shown ,
H-Bridge:-
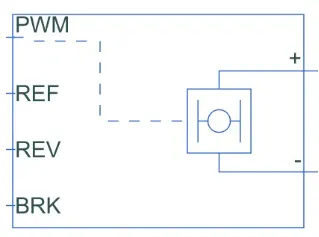
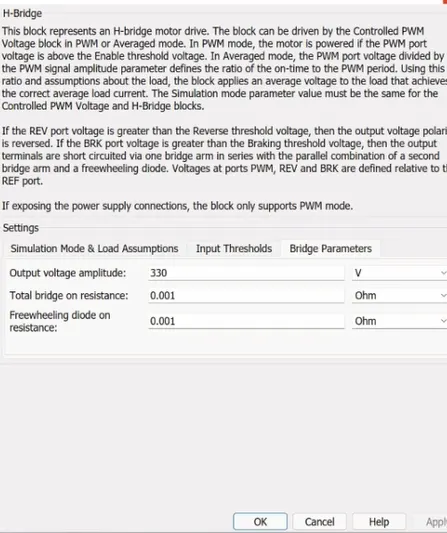
- The H bridge helps in controlling the power that is input according to the requirement.
- The output provided are converted voltage as per the controlled parameters.
Dc Motor:-
- This is the Dc motor would give the rotational power to the wheels.
- The Dc motors terminals are connected as mentioned below:
- +ve is electrical signal to the motor positive terminal.
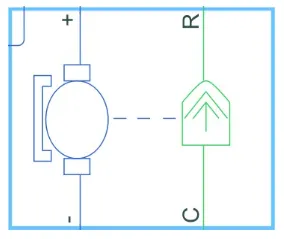
- -ve is motor negative terminal, R- Casing of motor connected to mechanical rotational reference block.
- C- rotor case connected to the mechanical rotational reference.
- The parameters for armature inductance is default varies changes in the no load speed @8000rpm, the rated speed @5000rpm.
- the rated load at 50kw, and the rated DC supply voltage =300V. and remaining are default values are setted.
Controlled PWM voltage:-
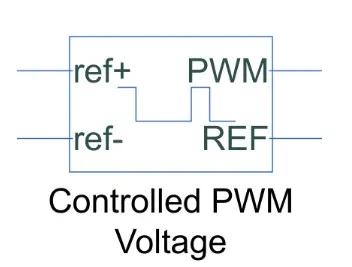

- The Controlled PWM Voltage Block helps in keeping the Modulated Pulses as per the required pulses. So that the operations happens smooth and higher variations are not observed.
- The Ports ore connected osfollows,
- ref+ = Reference Positive connected with the Acceleration Commands from the Driver Model
- ref- = Reference Negative connectedwith the Deceleration Commands from the Driver Model
- PWM = PWM connected directly to the H-Block
- REF = REF connected directly to the H-Block ,and other parameters are set as default.
Battery source:-
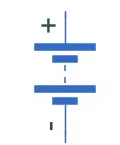
- The battery is connected as the power source to the model so that the power could be generated and the same power is transmitted to all the operating sources.
- +ve terminal of the operating sources.
- -ve terminal of the operating sources are connected viceversa.
The components of Battery block is depicted below:-
- For Battery the rated 300 volts is considered as nominal voltage.
SOC estimate block:-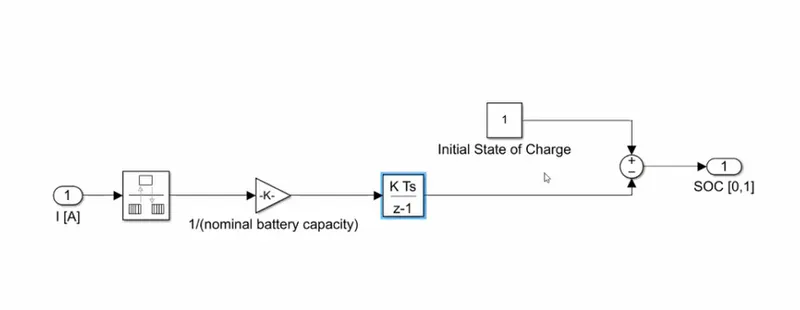
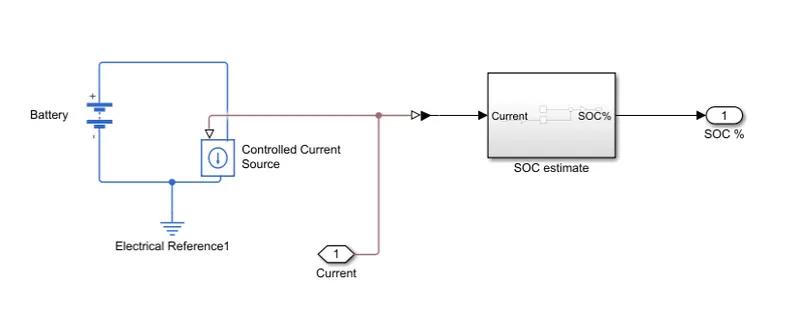
- the internal resitance is as per 0.5 ohms and others set as default.
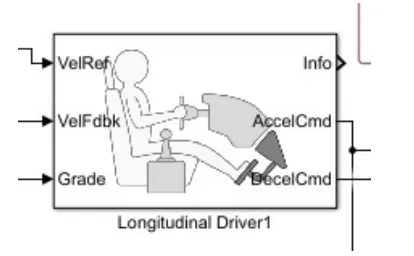
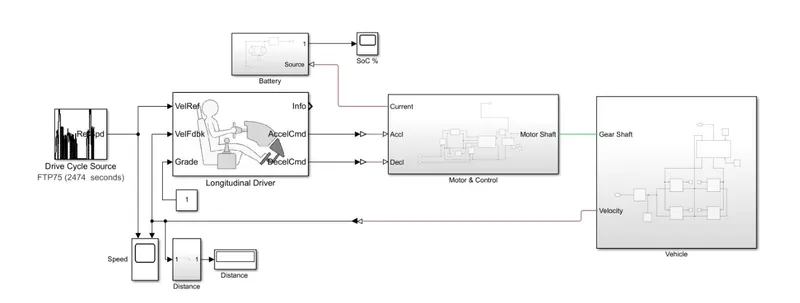
Longitudinal Driver Model:-
-
The Driver Modelhasthe Input and Output Ports which are connected to the following,
-
Velocity Reference - Drive Cycle
-
Velocity Feedback - Distance Calculation
-
Grade - Constant 0
-
Info - Not Connected
-
Acceleration Command - Controlled PWM Source
-
Deceleration Command - Brake inH-Bridge to maintain the speed accordingto the Drive cycle.
Drive cycle:-
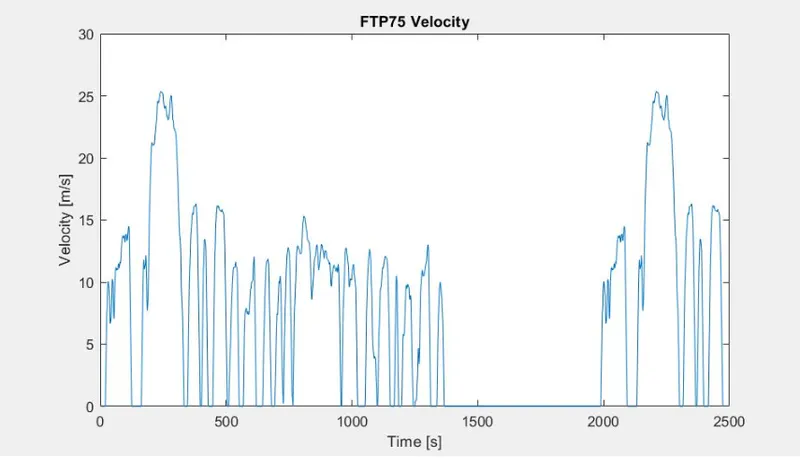
- Starting with the Drive cycle,let consider a WOT Drive cycle for the operation of the Cycle in which the test duration on would be 60 seconds.
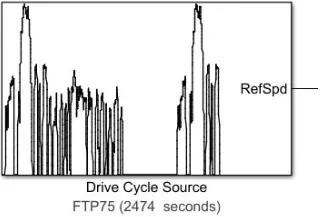
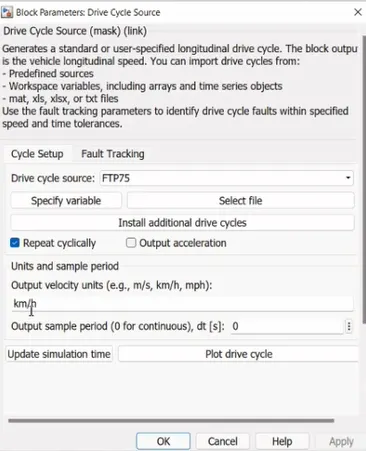
Model of electric car Using battery and a DC motor
Outputs (Results):-
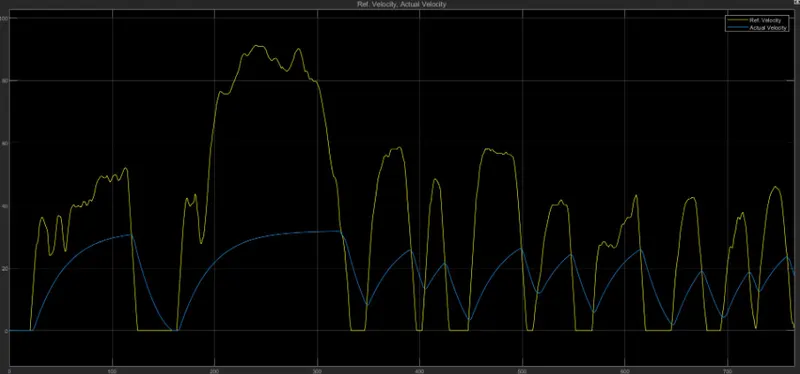
- The model has been simulated and run the model we can clearly observe the following graph from the scope,
1.The velocity Feedback and the drive cycle source:-
- As we can see that the actual velocity of the vehicle differs from the reference drive cycle velocity.
- This is because the chooses battery capacity and motors are not able to propel the speed upto the required extent.
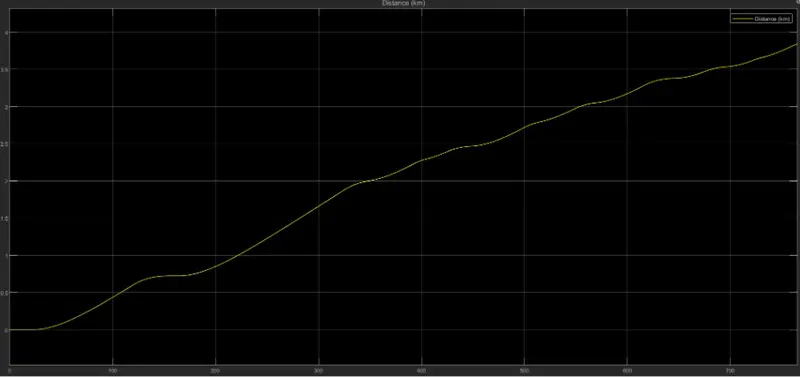
Distance covered:-
- It may note that since, the reference velocity of drive cycle never becomes negative, by the way the distance travelled is increasing. total distance as 3.8km.
2.Battery soc:-
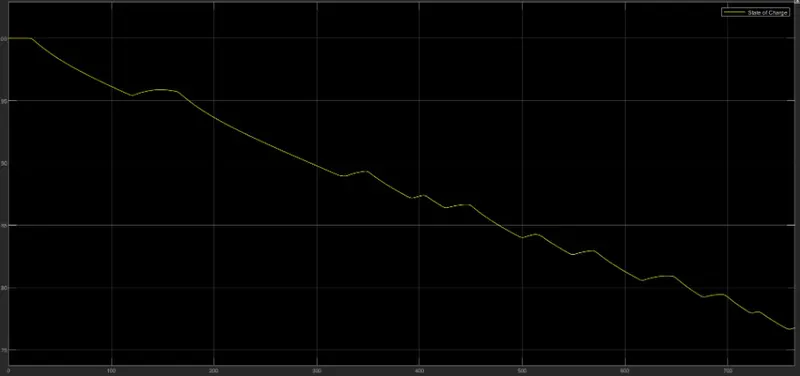
- As we can observe that the battery at the end of simulation run is nearly at 77%.
- That means battery is not going to drained completely , the vehicle can move some more distance on same drive cycle.
CONCLUSION:-
- As we have plotted the simulink model and plotted the graph with the FTP75 drive cycle.
- The results have properly analysed and mentioned.