Final Project
Objective :-
In this project a first order selection of antiroll bar diameter and kinematic and compliance parameters is achieved
Excel sheet calculation flow: Note: Detailed equations are in the excel sheet
Anti roll bar :-
1-distance cg from front axle calculated
2-distance x and h_arm is calculated which is the distance between center of gravity and roll axis
3-front and rear axle sprung weights are calculated
4-front and rear axle unsprung weights calculated
5-then unsprung mass front and rear load transfer is calculated using unsprung weight c.g at wheel center
6-then direct lateral load transfer is calculated front and rear(kinematic) using front and rear roll centers
7-then total vehicle lateral load transfer is calculated using center of gravity height from the ground
8-then front load transfer is calculated based on the static weight percentage on this axle
9-then inorder to give the vehicle safer understeer characteristics a 5% more weight transfer is added to the front
10-then the rear load transfer and adjusted rear load transfer is calculated(5% less)
12-then front and rear roll load transfer is calculated(elastic) by subtracting the direct load transfer and unsprung load transfer from the total lateral load transfer
13- then total roll stiffness is calculated from the roll gradient equation(elastic) using h_arm which is distance betwen c.g. and roll axis
14-then from the roll load transfer equation ,the front axle stiffness can be calculated (using h_arm)
15-then rear roll stiffness is calculated from the total roll stiffness
16-then tyre contribution front and rear is calculated
17-then it is subtracted from the front and rear roll stiffness to get the required stiffness at wheel center level for front and rear
18-then wheel rate contribution to wheel center stiffness is calculated
19-then anti roll bar contribution is the difference between the required stiffness at wheel center level and the wheel rate (springs contribution)
20-then auxiliary stiffness is calculated, and we make sure it is within the required constraint level, otherwise the spring values should be changed
20- then anti roll bar diameters are calculated
21-then it is approximated to the nearest 0.25 mm
22-this will require redoing the calculations to make sure that the roll gradient in the target levels
23- then a new roll bar stiffness is calculated
24-then added to the wheel contribution to get new wheel center stiffness
25-then tyre contribution is added
26-then total roll stiffness is computed
27-then new roll gradient is calculated, if it is not is the required target deviations, change the anti-roll bar diameters
28-Target the upper level of the target roll gradients as it was found that increased roll gradient (small ARB diameter) maximizes the understeer in the understeer budget table
Understeer budget steps are as follows :-
-each tyre load was calculated
-then each tyre diameter is calculated from the table at this given load using linear approximation
-then each understeer parameter is calculated accordingly using equations in the excel sheet
Understeer budget linear approximation calculations are as follows :-
Cornering stiffness front=1000-825/1000-500=262.17-x/262.17-167.23……x=228.9 ib/deg
Camber stiffness front=1000-825/1000-500=17.76-x/17.76-8.37 ….x=14.4735 ib/deg
Aligning stiffness front=1000-825/1000-500=35.12-x/35.12-9.27….x=26.07 ib/deg
Cornering stiffness rear=1000-550/1000-500=262.17-x/262.17-167.23……x=176.7 ib/deg
Camber stiffness rear=1000-550/1000-500=17.76-x/17.76-8.37 ….x=9.309 ib/deg
Aligning stiffness rear=1000-550/1000-500=35.12-x/35.12-9.27….x=11.86 ib/deg
parameter selection :- Note :- Detailed understeer budget calculations are in the excel sheet
-those parameters were chosen as they were found to increase the understeer gradient:
Front rear
|
Roll steer |
% |
6.5 |
8 |
|
Roll camber |
% |
90 |
50 |
|
Lateral force compl steer |
deg/kN |
0.05 |
0.015 |
|
Lateral force compl camber |
deg/kN |
0.3 |
0.15 |
|
Aligning torque compl steer |
deg/100 Nm |
0.4 |
0.06 |
Targets achieved :-
|
Target required |
Target achieved |
|
Roll gradient:3.50-3.80 deg/g |
Roll gradient=3.79 deg/g |
|
Understeer gradient: as max as possible |
Understeer gradient=2.06 deg/g |
Understeer budget contribution :-
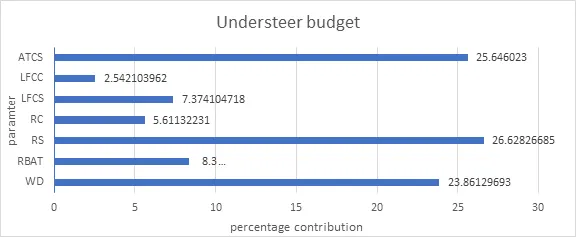
From the plot it can be seen that the roll steer is highest contributor by 26.6% as it was given that it produces understeer at the front and rear suspension, then it was followed by the aligning torque compliance steer by 25.6% and then by the weight distribution by 23.8%,this 3 factors form more than 75% of the understeer budget, so they are very important parameters for understeer in this case.
Tyre plots :-
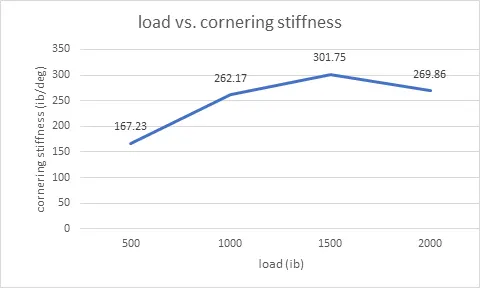
load vs. cornering stiffness plot
cornering stiffness increases linearly with load and then it plateaus
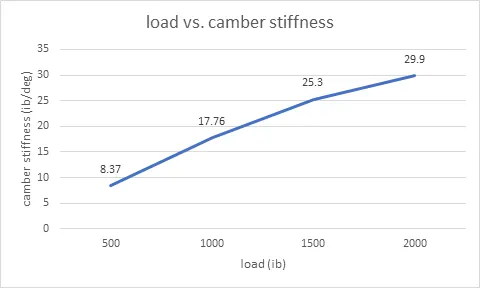
load vs. camber stiffness plot
camber stiffness increases nearly linearly with load across the whole range of loads
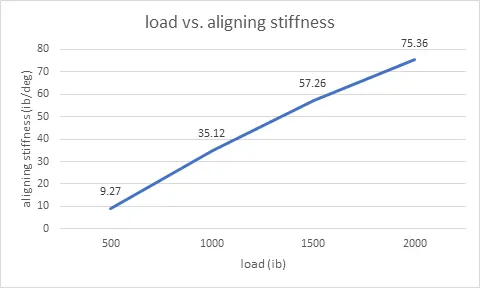
load vs. aligning stiffness plot
aligning stiffness nearly increases linearly with load across the whole range of loads
Matlab code for plotting all the curves on one plot :-
clear all
close all
load = [500, 1000, 1500, 2000];
Cs = [167.23, 262.17, 301.75, 269.86];
Cy = [8.37, 17.76, 25.30, 29.90];
Cal = [9.27, 35.12, 57.26, 75.36];
plot(load,Cs,'linewidth',2);
hold on
plot(load,Cy,'linewidth',2);
hold on
plot(load,Cal,'linewidth',2);
title('Load vs stiffness');
xlabel('Load (lb)');
ylabel('stiffness (lb/deg)');
legend('Cs','Cy','Cal');
grid on
steps:
-inputs are declared in an array
-then data plotted on same plot using hold on cammand
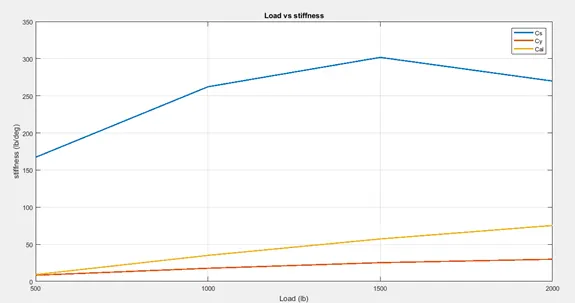
all tyre parameters on a single plot
the plot shoes that cornering stiffness has the largest increase due to load ,so it is the greatest parameter to be affected with load,also it flattens and plateaus incontrast to the other paramaters ,while the aligning stiffness is the lowest parameter effected with load