Parsing of a Thermodynamic data file by using Matlab.
Aim:
Parsing of a Thermodynamic data file by using Matlab.
Formulae:
i) `frac{Cp}{R} = a1+a2.T+a3.T^2+a4.T^3+a5.T^4`
Cp = Specific Heat in J/KgK.
R = Universal gas constant in L⋅Pa⋅K^-1⋅mol^-1.
T = Temperature of species.
a1,a2,a3,a4,a5,a6,a7 = co-efficents for the high temperature.
ii) `frac{H}{RT} = a1+a2.T/2+a3.T^2/3+a4.T^3/4+a5.T^4/5+frac{a6}{T}`
H = Enthalpy in J/KgK.
iii) `frac{S}{R} = a1.lnT+a2.T+a3.T^2/2+a4.T^3/3+a5.T^4/4+a7`
S = Entropy in J/K.
Terms:
A. Specific Heat: The specific heat capacity,(symbol Cp) of a substance is the heat capacity of a sample of the substance divided by the mass of the sample. Informally, it is the amount of energy that must be added, in the form of heat, to one unit of mass of the substance in order to cause an increase of one unit in temperature.
B. Enthalpy: It is defined as the sum of the system's internal energy and the product of its pressure and volume.
C. Entropy: It is a variable that describes the state of a system made of smaller components. Entropy is often used to describe a volume of matter composed of many molecules (such as a gas or liquid).
Objectives:
01. Write a function that extracts the 14 co-efficient and calculates the enthalpy, entropy and specific heats for all the species in the data file.
02. Calculate the molecular weight of each species and display it in the command window.
03. Plot the Cp, Enthalpy and Entropy for the local temperature range (low temperature : high temperature) specific for each species.
04. Save the plots as images with appropriate names and dump them in separate folders for each species with suitable name. All these should be generated automatically.
Introduction:
Parsing, syntax analysis, or syntactic analysis is the process of analyzing a string of symbols, either in natural languages, computer languages or data structures, conforming to the rules of a formal grammar. The term parsing comes from Latin pars (orationis), meaning part.
The term has slightly different meanings in different branches of linguistics and computer science. Traditional sentence parsing is often performed as a method of understanding the exact meaning of a sentence or word, sometimes with the aid of devices such as sentence diagrams. It usually emphasizes the importance of grammatical divisions such as subject and predicate.
Within computational linguistics the term is used to refer to the formal analysis by a computer of a sentence or other string of words into its constituents, resulting in a parse tree showing their syntactic relation to each other, which may also contain semantic and other information. Some parsing algorithms may generate a parse forest or list of parse trees for a syntactically ambiguous input.
The term is also used in psycholinguistics when describing language comprehension. In this context, parsing refers to the way that human beings analyze a sentence or phrase (in spoken language or text) "in terms of grammatical constituents, identifying the parts of speech, syntactic relations, etc. This term is especially common when discussing what linguistic cues help speakers to interpret garden-path sentences..
Within computer science, the term is used in the analysis of computer languages, referring to the syntactic analysis of the input code into its component parts in order to facilitate the writing of compilers and interpreters. The term may also be used to describe a split or separation.
Problem Statement:
1. Write a function that extracts the 14 co-efficients and calculates the enthalpy, entropy and specific heats for all the species in the data file.
You will be reading this file NASA thermodynamic data.
The formulae are shown below.
Here R is the universal gas constant, T is the temeprature
The FIRST 7 coefficients are HIGH-temperature coefficients and the SECOND 7 coefficients are LOW-temperature coefficients.
Also use the LOCAL TEMPERATURE RANGES which is unique for each individual species, not the GLOBAL TEMPERATURE RANGE.
2. Calculate the molecular weight of each species and display it in the command window.
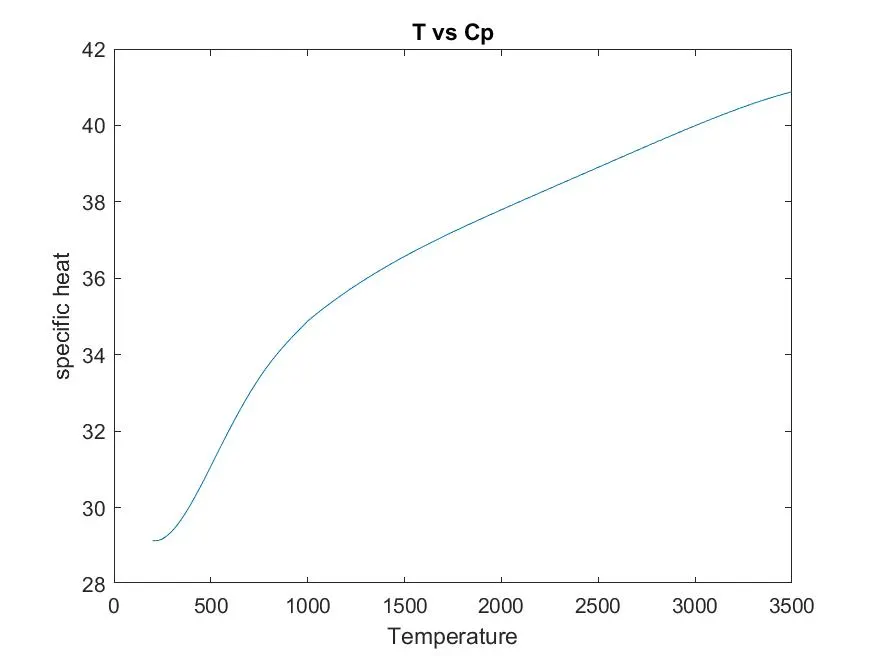
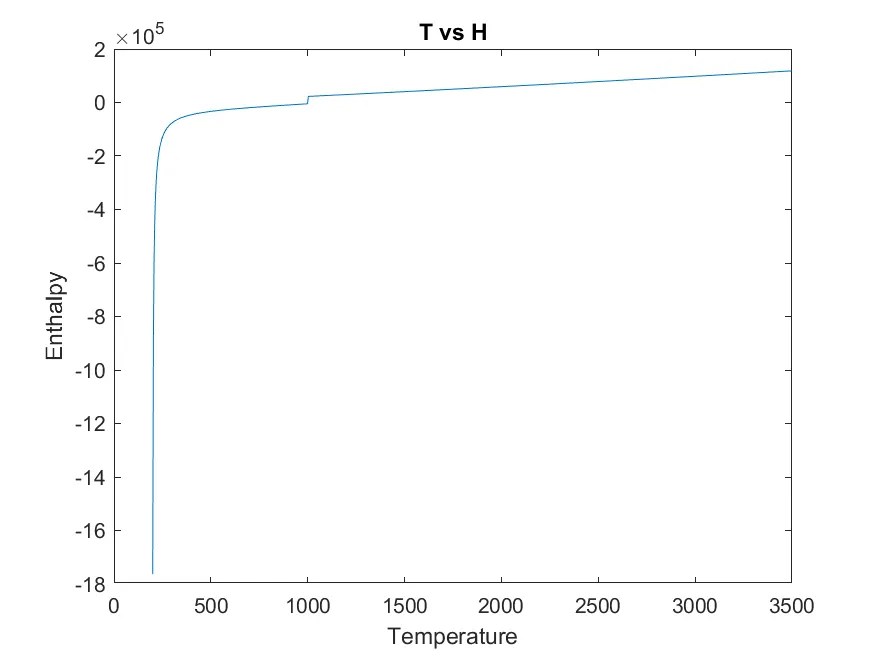
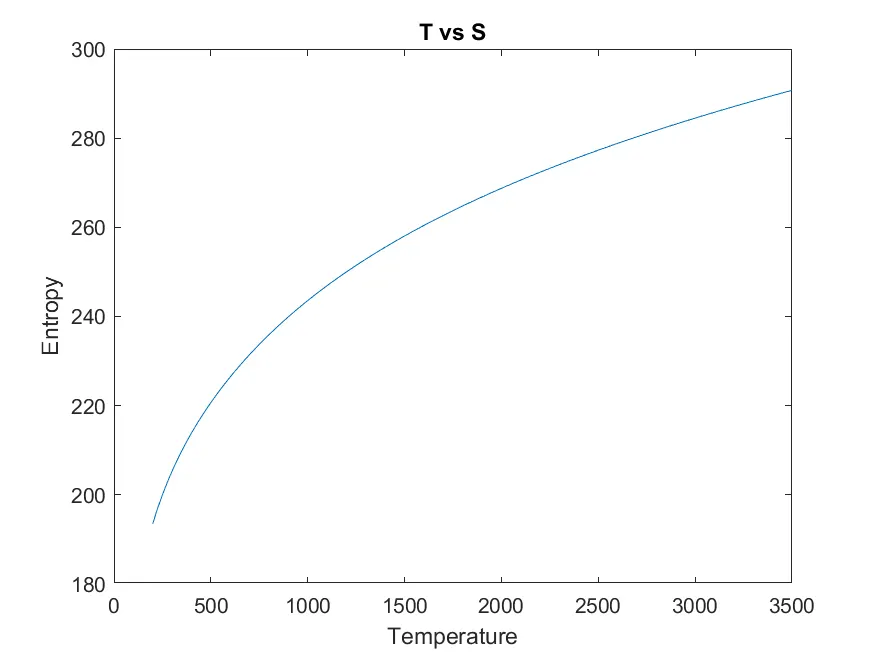
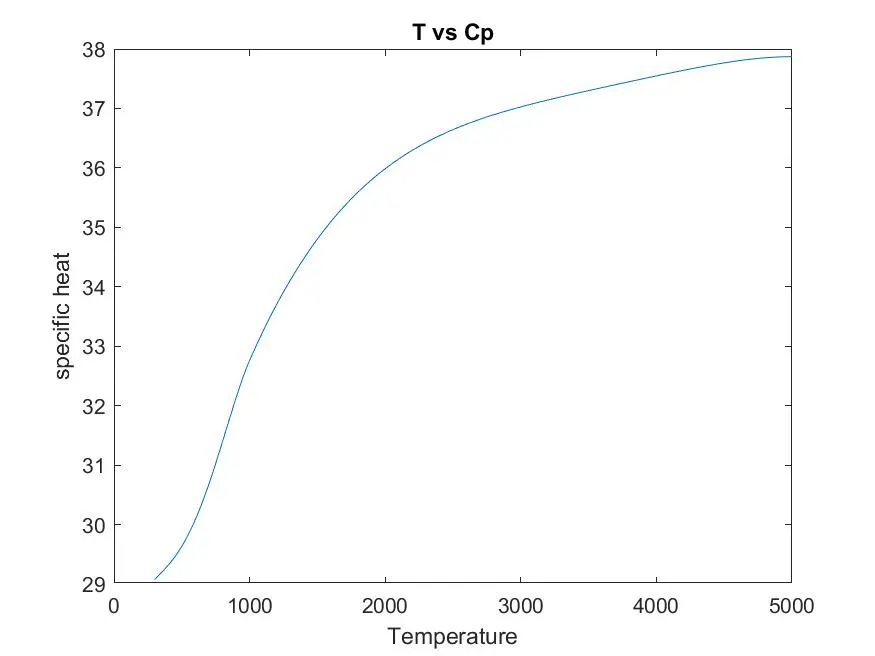
3. Plot the Cp, Enthalpy and Entropy for the local temperature range (low temperature : high temperature) specific for each species.
4. Save the plots as images with appropriate names and dump them in separate folders for each species with suitable name. All these should be generated automatically.
5. The main program that you will submit will just take the "THERMO.dat" file as an input and generate Cp, H and S plots.
6. Please write a logical codec and it's explanation.
Solution:
Program-01: Codec for parsing of a Thermodynamic file.

01.	 % Parsing of a Thermodynamic file in Matlab.
02.
03.	clear all
04.	close all
05.	clc
06.
07.	%  Getting the data file.
08.	%  Here we consider the header as the line_1 of data file.
09.	%  Getting line_1 of data file.
10.	f1 = fopen('THERMO.dat','r');
11.	fgetl(f1)
12.
13.	%  Reading the header informtion.
14.	%  Getting line_2 of data file.
15.	L = fgetl(f1);
16.
17.	A = strsplit(L,' ');
18.
19.	B = length(A);
20.
21.	Global_low_temp = str2double(A(B-2));
22.	Global_mid_temp = str2double(A(B-1));
23.	Global_high_temp = str2double(A(B-0));
24.
25.	%  Skipping lines of data file from line_3 to line_5.
26.	fgetl(f1);
27.	fgetl(f1);
28.	fgetl(f1);
29.
30.	%  Universal Gas Constant.
31.	R = 8.314*10^3; %L?Pa?K?1?mol?1
32.
33.	%  Reading the species.
34.
35.	for k = 1:53
36.
37.	    Header = fgetl(f1);
38.
39.	    X = strsplit(Header,' ');
40.
41.	    species_name = (X{1});
42.
43.	    Z = length(X);
44.
45.	    Local_low_temp = str2double(X(Z-3));
46.	    Local_high_temp = str2double(X(Z-2));
47.	    Local_mid_temp = str2double(X(Z-1));
48.
49.	    T1 = Local_low_temp;
50.	    T2 = Local_mid_temp;
51.	    T3 = Local_high_temp;
52.
53.	    %  Getting the line_7 of data file (C1-C5).
54.
55.	    line_7 = fgetl(f1);
56.
57.	    a = strfind(line_7,'E');
58.
59.	    C1 = str2double(line_7(1:a(1)+3));
60.	    C2 = str2double(line_7(a(1)+4:a(2)+3));
61.	    C3 = str2double(line_7(a(2)+4:a(3)+3));
62.	    C4 = str2double(line_7(a(3)+4:a(4)+3));
63.	    C5 = str2double(line_7(a(4)+4:a(5)+3));
64.
65.	     %  Getting the line_8 of the data file (C6-C10).
66.
67.	    line_8 = fgetl(f1);
68.
69.	    a = strfind(line_8,'E');
70.
71.	    C6 = str2double(line_8(1:a(1)+3));
72.	    C7 = str2double(line_8(a(1)+4:a(2)+3));
73.	    C8 = str2double(line_8(a(2)+4:a(3)+3));
74.	    C9 = str2double(line_8(a(3)+4:a(4)+3));
75.	    C10 = str2double(line_8(a(4)+4:a(5)+3));
76.
77.	    %  Getting the line_9 of the data file (C11-C14).
78.
79.	    line_9 = fgetl(f1);
80.
81.	    a = strfind(line_9,'E');
82.
83.	    C11 = str2double(line_9(1:a(1)+3));
84.	    C12 = str2double(line_9(a(1)+4:a(2)+3));
85.	    C13 = str2double(line_9(a(2)+4:a(3)+3));
86.	    C14 = str2double(line_9(a(3)+4:a(4)+3));
87.
88.	    T = linspace(T1,T3,1000);
89.	    R = 8.314;
90.
91.	   %  To get an array of specific heat, enthalpy and entropy.
92.	for i = 1:length(T)
93.
94.	    %  To compare the species temperature to assign the coefficients .
95.	    %  C1-C7 (High-temperature coefficients), C8-C14 (Low-temperature coefficients)
96.
97.	    if T(i)>T2
98.
99.	        %  High Temperature Coefficients.
100.	 Cp(i) = (C1 + C2.*T(i) + C3.*T(i).^2 + C4.*T(i).^3 + C5.*T(i).^4).*R;
101.
102.	 H(i) = (C1 + C2.*T(i)/2 + C3.*T(i).^2/3 + C4.*T(i).^3/4 + C5.*T(i).^4/5 + C6/T(i)).*R.*T(i);
103.
104.	 S(i) = (C1.*log(T(i)) + C2.*T(i) + C3.*T(i).^2/2 + C4.*T(i).^3/3 + C5.*T(i).^4/4 + C7).*R;
105.
106.	    else
107.
108.	 % Low Temperature Coefficients.
109.	 Cp(i) = (C8 + C9.*T(i) + C10.*T(i).^2 + C11.*T(i).^3 + C12.*T(i).^4).*R;
110.
111.	 H(i) = (C8 + C9.*T(i)/2 + C10.*T(i).^2/3 + C11.*T(i).^3/4 + C12.*T(i).^4/5 + C13/(i)).*R.*T(i);
112.
113.	 S(i) = (C8.*log(T(i)) + C9.*T(i) + C10.*T(i).^2/2 + C11.*T(i).^3/3 + C12.*T(i).^4/4 + C14).*R;
114.
115.	end
116.	end
117.
118.	  figure(1)
119.	  plot(T,Cp);
120.	  title('T vs Cp')
121.	  xlabel('Temperature')
122.	  ylabel('specific heat')
123.
124.	  figure(2)
125.	  plot(T,H);
126.	  title('T vs H')
127.	  xlabel('Temperature')
128.	  ylabel('Enthalpy')
129.
130.	  figure(3)
131.	  plot(T,S);
132.	  title('T vs S')
133.	  xlabel('Temperature')
134.	  ylabel('Entropy')
135.
136.	currdirec = pwd % shows curr directory.
137.	mkdir(['C:Skill LyncChallengesFP_plots',species_name]); % Creating a new directory in matlab.
138.	cd(['C:Skill LyncChallengesFP_plots',species_name]); % Changing directory command in matlab.
139.	newdirec = pwd % shows new directory
140.	saveas (1,'species_name_T_vs_Cp.jpg') % saving data_f1
141.	saveas (2,'species_name_T_vs_H.png') % saving data_f2
142.	saveas (3,'species_name_T_vs_S.png') % saving data_f3
143.
144.	%  Molecular Mass Calculation.
145.
146.	elements = ['H','C','O','N','A'];
147.	atomic_weight = [1.0079 12.0107 15.999 14.0067 39.948];
148.	mol_mass = 0;
149.	for q = 1:length(species_name)
150.	    for m = 1:length(atomic_weight)
151.	        if strcmp(species_name(q),elements(m))
152.	            mol_mass = mol_mass + atomic_weight(m);
153.	            position = m;
154.
155.	    end
156.	    end
157.	         n = str2double(species_name(q));
158.	if n > 1
159.	            mol_mass = mol_mass + atomic_weight(position)*(n-1);
160.
161.	end
162.	end
163.	fprintf('Molecular weight of %s:%f u',species_name,mol_mass)
164.	end
Detailed explanation of program-01:
01. Name of Program, “Parsing of a Thermodynamic file by using the Matlab”.
02. Clears your workspace.
03. Closes all the figures.
04. Clears Command window.
05. % Getting the data file.
06. % Here we consider the header as the line_1 of data file.
07. % Getting line_1 of data file.
08. f1 = fopen('THERMO.dat','r');
[Here the command ‘fopen’ is the default command in the matlab which is used to open the specified file ‘THERMO.dat’ under the assigned variable ‘f1’ in the editor window.]
11. fgetl(f1)
[Here the command ‘fgetl’ is the default command in the matlab which is used to select the specified file ‘THERMO.dat’ by using it’s assigned variable ‘f1’ so that we can access the data of a file (line_01) and perform the required operations on the selected data file. When we command ‘fgetl’ that means we are getting only one line at a time of a selected data file, here it is used to the header of the file i. e. ‘THERMO’.]
12.
13. % Reading the header information.
14. % Getting line_2 of data file.
15. L = fgetl(f1);
[Here ‘fgetl’ is used to get the second line of the data file ‘f1’ that consists of the values for the global temperatures saved under the output variable ‘L’.]
16.
17. A = strsplit(L,' ');
[Here the line selected by using the’fgetl’ is taken as a string ‘L’ so to fetch the required elements from the string we will have to split the string. Splitting of the string is done by using the ‘strsplit’ command which is used to split the string where ‘ ‘ is taken as the delimiter and assigned under the output variable ‘A’.]
18.
19. B = length(A);
[Output variable ‘B’ represents the length of the splitted string i. e. length of 'A’.]
20.
21. Global_low_temp = str2double(A(B-2));
[Command ‘str2double’ is used to convert the selected element of the cell array into the number of double precision. Here 'A’ represents the name of the cell array of which cell needs to be selected. And the cell selected is (B-2), which is the value of the global low temperature, where ‘B’ represents the length of the cell array ‘A’.]
22. Global_mid_temp = str2double(A(B-1));
[Command ‘str2double’ is used to convert the selected element of the cell array into the number of double precision. Here 'A’ represents the name of the cell array of which cell needs to be selected. And the cell selected is (B-1), which is the value of the global mid temperature, where ‘B’ represents the length of the cell array ‘A’.]
23. Global_high_temp = str2double(A(B-0));
[Command ‘str2double’ is used to convert the selected element of the cell array into the number of double precision. Here 'A’ represents the name of the cell array of which cell needs to be selected. And the cell selected is (B-0), which is the value of the global high temperature, where ‘B’ represents the length of the cell array ‘A’.]
24.
25. % Skipping lines of data file from line_3 to line_5.
26. fgetl(f1);
27. fgetl(f1);
28. fgetl(f1);
e used the command 'fgetl' three times because we are extracting those three lines from the 'THERMO.dat' file. Since those three lines are not taken into consideration for further calculations we are simply terminating those without assigning any output variable to them.]
29.
30. % Universal Gas Constant.
31. R = 8.314*10^3; %L?Pa?K?1?mol?1
32.
33.% Reading the species.
34.
35. for k = 1:53
[To read the 'THERMO.dat' we have 53 species and their co-efficients. But those are arranged in a specified manner or pattern so we can use the 'for looop' here to extract the data related species for all the 53 species. Therefore k = 1:53 where k is the flag of'for loop'.]
36.
37. Header = fgetl(f1);
[For every set of species first line is the 'Header' which states the name of the species and the local temperatures. Thus when we command 'fgetl' in a 'for loop' that means we are getting the 'Header' of the species under the output variable 'Header'.]
38.
39. X = strsplit(Header,' ');
[Now we got the 'Header' but it is a string and to extract the elements of the data of a string we will have to split the string. Therefore we used the command 'strsplit' and used ' ' as the delimiter.]
40.
41. species_name = (X{1});
['species_name' is the variable under which we had saved the name of the species from the 'Header'. Hence the logic is; when we split the string it becomes the 'cell array'. And the difference between the regular array and the cell array is that regular array can hold the data of same type only whereas the cell array can hold the data of the different types. Thus to get the elements of the data of the cell array we must use the curly bracket instead of the circular brackets.]
42.
43. Z = length(X);
[In simple words we can say that 'X' is the cell array and the 'Z' is length of cell array 'X'.]
44.
45. Local_low_temp = str2double(X(Z-3));
46. Local_high_temp = str2double(X(Z-2));
47. Local_mid_temp = str2double(X(Z-1));
[Our header consists of the values of the low, medium and high local temperatures so that in order to extract the respective values of the temperatures we must use the delimiter ' ' to define the elements of the string under consideration. We simply substracted the serial number of the elements (series starting from RHS to LHS) of data from the length of cell array 'Z'.]
48.
49. T1 = Local_low_temp;
50. T2 = Local_mid_temp;
51. T3 = Local_high_temp;
[Command 'str2double' is used to convert the element into double precision number. For example: For local low temp. we need fourth element from cell array 'X'. Therefore we must substract first three elements from the length of 'X' i. e. 'Z'. Same logic is applied to find the values of the other local temperatures of the species.]
52.
53. % Getting the line_7 of data file (C1-C5).
54.
55. line_7 = fgetl(f1);
56.
57. a = strfind(line_7,'E');
[The command'strfind' is used to find the specified element in the string which can be used as a delimiter to define the position of the remaining elements so that extraction of the data becomes easy. Here in a string 'line_7' we find out the element 'E' and used it as a delimiter or reference.]
58.
59. C1 = str2double(line_7(1:a(1)+3));
[Now if we look carefully we have total fifteen spaces for defining each coefficient in the given data file. Considering the 'E' as a reference we just defined the first coefiicient of 'line_7' under the variable 'C1'. Here 'E' is defined as the 'a(1)' that means 'C1' will show the values for spaces from 1 to a(1)+3 that is nothing but the first coefficient of the 'line_7'. And same logic is used for every line to find the remaining coefficients of the temperatures.]
60. C2 = str2double(line_7(a(1)+4:a(2)+3));
61. C3 = str2double(line_7(a(2)+4:a(3)+3));
62. C4 = str2double(line_7(a(3)+4:a(4)+3));
63. C5 = str2double(line_7(a(4)+4:a(5)+3));
64.
65. % Getting the line_8 of the data file (C6-C10).
66.
67. line_8 = fgetl(f1);
68.
69. a = strfind(line_8,'E');
70.
71. C6 = str2double(line_8(1:a(1)+3));
72. C7 = str2double(line_8(a(1)+4:a(2)+3));
73. C8 = str2double(line_8(a(2)+4:a(3)+3));
74. C9 = str2double(line_8(a(3)+4:a(4)+3));
75. C10 = str2double(line_8(a(4)+4:a(5)+3));
76.
77. % Getting the line_9 of the data file (C11-C14).
78.
79. line_9 = fgetl(f1);
80.
81. a = strfind(line_9,'E');
82.
83. C11 = str2double(line_9(1:a(1)+3));
84. C12 = str2double(line_9(a(1)+4:a(2)+3));
85. C13 = str2double(line_9(a(2)+4:a(3)+3));
86. C14 = str2double(line_9(a(3)+4:a(4)+3));
87.
88. T = linspace(T1,T3,1000);
[To plot the relationship of the temperature with other parameters we need the multiple values of the temperature from low temperature (T1) to high temperature (T3) therefore we creating the array and assigning the output variable 'T' by using the linspace command.]
89. R = 8.314;
[Defining the value of the Universal Gas Constant under the variable 'R'.]
90.
91. % To get an array of specific heat, enthalpy and entropy.
92. for i = 1:length(T)
[We will have to plot the relationship for every single value of the temperature ranging from T1 to T3 therefore we are cearting the 'for loop' and defining the flag 'i = 1:length(T)'.]
93.
94. % To compare the species temperature to assign the coefficients.
95. % C1-C7 (High-temperature coefficients), C8-C14 (Low-temperature coefficients)
96.
97. if T(i)>T2
98.
[Here we are using the'if-else' condition to define the values of the specific heat, enthalpy and entropy for the respective values of the temperature. Because according to the given information coefficients C1-C7 are High-temperature coefficients and coefficients C8-C14 are Low-temperature coefficients,hence we will compare the teach value of temperature with the mid-temperature and accordingly we willl use the given coefficients. Therefore, 'if T>T2' then we will use the coefficients of the high temperature and 'if T<T2' then program will execute the commands under the 'else' condition that is nothing but coefficients of lower temperature.]
99. % High Temperature Coefficients.
100. Cp(i) = (C1 + C2.*T(i) + C3.*T(i).^2 + C4.*T(i).^3 + C5.*T(i).^4).*R;
101.
102. H(i) = (C1 + C2.*T(i)/2 + C3.*T(i).^2/3 + C4.*T(i).^3/4 + C5.*T(i).^4/5 + C6/T(i)).*R.*T(i);
103.
104. S(i) = (C1.*log(T(i)) + C2.*T(i) + C3.*T(i).^2/2 + C4.*T(i).^3/3 + C5.*T(i).^4/4 + C7).*R;
105.
106. else
107.
108. % Low Temperature Coefficients.
109. Cp(i) = (C8 + C9.*T(i) + C10.*T(i).^2 + C11.*T(i).^3 + C12.*T(i).^4).*R;
110.
111. H(i) = (C8 + C9.*T(i)/2 + C10.*T(i).^2/3 + C11.*T(i).^3/4 + C12.*T(i).^4/5 + C13/(i)).*R.*T(i);
112.
113. S(i) = (C8.*log(T(i)) + C9.*T(i) + C10.*T(i).^2/2 + C11.*T(i).^3/3 + C12.*T(i).^4/4 + C14).*R;
114.
115. end
[End of for loop.]
116. end
[End of if-else condition.]
117.
118. figure(1)
119. plot(T,Cp);
120. title('T vs Cp')
121. xlabel('Temperature')
122. ylabel('specific heat')
[Plotting the figure-01 and specifying the title and labels of the figure-01.]
123.
124. figure(2)
125. plot(T,H);
126. title('T vs H')
127. xlabel('Temperature')
128. ylabel('Enthalpy')
[Plotting the figure-02 and specifying the title and labels of the figure-02.]
129.
130. figure(3)
131. plot(T,S);
132. title('T vs S')
133. xlabel('Temperature')
134. ylabel('Entropy')
[Plotting the figure-03 and specifying the title and labels of the figure-03.]
135.
136. currdirec = pwd % shows curr directory.
[Command 'pwd' is used to get the current directory of the current matlab program.]
137. mkdir(['C:Skill LyncChallengesFP_plots',species_name]); % Creating a new directory in matlab.
[Command 'mkdir' is used to create the new directory for the current matlab program.]
138. cd(['C:Skill LyncChallengesFP_plots',species_name]); % Changing directory command in matlab.
[Command 'cd' is used to change the current directory of the matlab program.]
139. newdirec = pwd % shows new directory.
[Command 'pwd' is used again just to check the current directory of the matlab programme.]
140. saveas (1,'species_name_T_vs_Cp.jpg') % saving data_f1
[Command 'saveas' is used to save the specified figure in the in given format in the current directory of the programe.]
141. saveas (2,'species_name_T_vs_H.jpg') % saving data_f2
142. saveas (3,'species_name_T_vs_S.jpg') % saving data_f3
143.
144. % Molecular Mass Calculation.
145.
[Now we are writing the codec to get the values of the molar masses for each given species.]
146. elements = ['H','C','O','N','A'];
[Here we are saving the variables of the each element under the output variable 'elements' which is nothing but a string.]
147. atomic_weight = [1.0079 12.0107 15.999 14.0067 39.948];
[Again making one more string to hold the values of the atomic masses of the elements of the given species.]
148. mol_mass = 0;
[Taking the molar mass = 00 initially.]
149. for q = 1:length(species_name)
[Creating 'for loop' where flag will take the each value of the species.]
150. for m = 1:length(atomic_weight)
[Creating 'for loop' where flag will take the each value of the atomic weight.]
151. if strcmp(species_name(q),elements(m))
[Comparing the both strings and if the condition is true then only the following program will be executed otherwise not.]
152. mol_mass = mol_mass + atomic_weight(m);
153. position = m;
154.
155. end
[End of first 'for loop'.]
156. end
[End of second 'for loop'.]
157. n = str2double(species_name(q));
158. if n > 1
159. mol_mass = mol_mass + atomic_weight(position)*(n-1);
[To get the molar mass of the specimen in which two or more than two molecules are present.]
160.
161. end
[End of first 'if loop'.]
162. end
[End of second 'if loop'.]
163. fprintf('Molecular weight of %s:%f u',species_name,mol_mass)
[Command 'fprintf' is used to print the specified statement.]
164. end
[End of main 'for loop']
Results:

Figure-01: Screenshot of all the folders having the the plots of respective species.
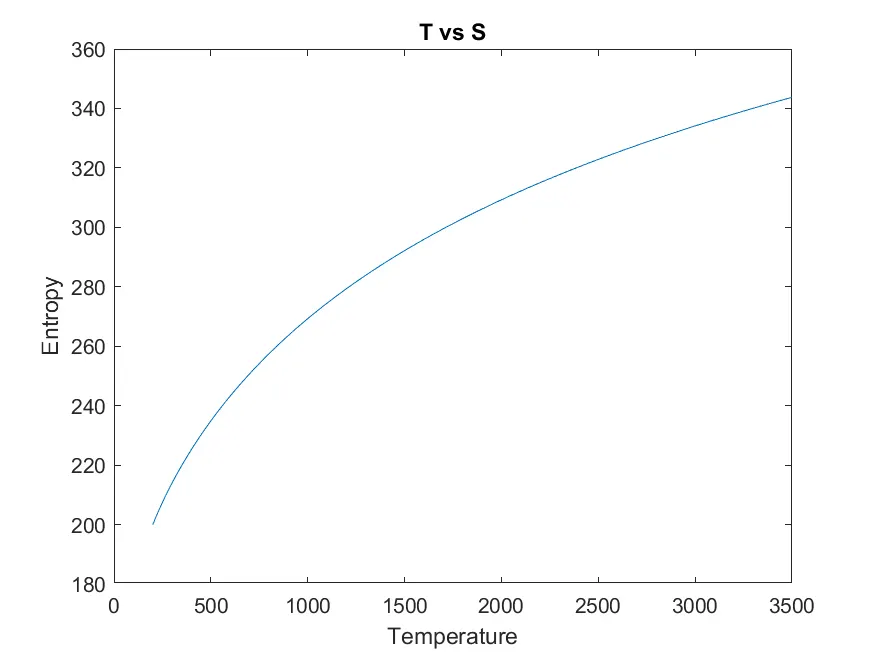
Plots of O2:
01.Temperature vs. Specific Heat.
02. Temperature vs. Enthalpy.
03. Temperature vs. Entropy.
Plots of N2:
01.Temperature vs. Specific Heat.
02. Temperature vs. Enthalpy.
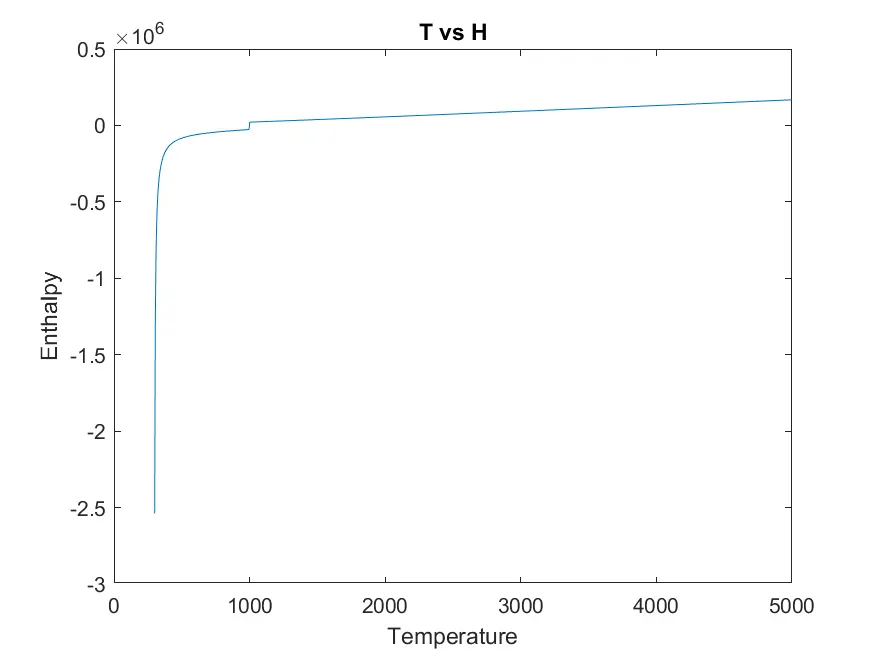
03. Temperature vs. Entropy.
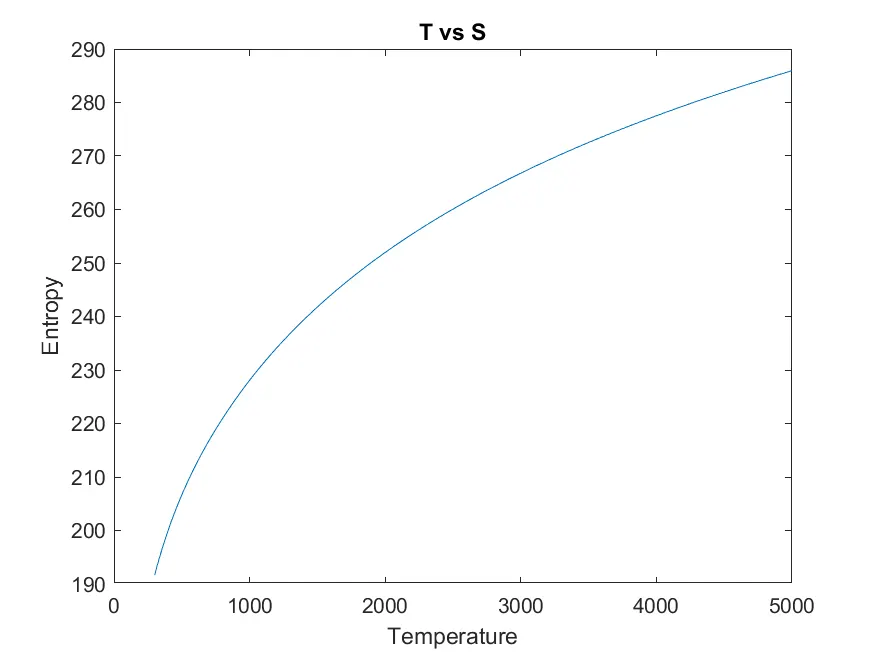
Plots of CO2:
01.Temperature vs. Specific Heat.
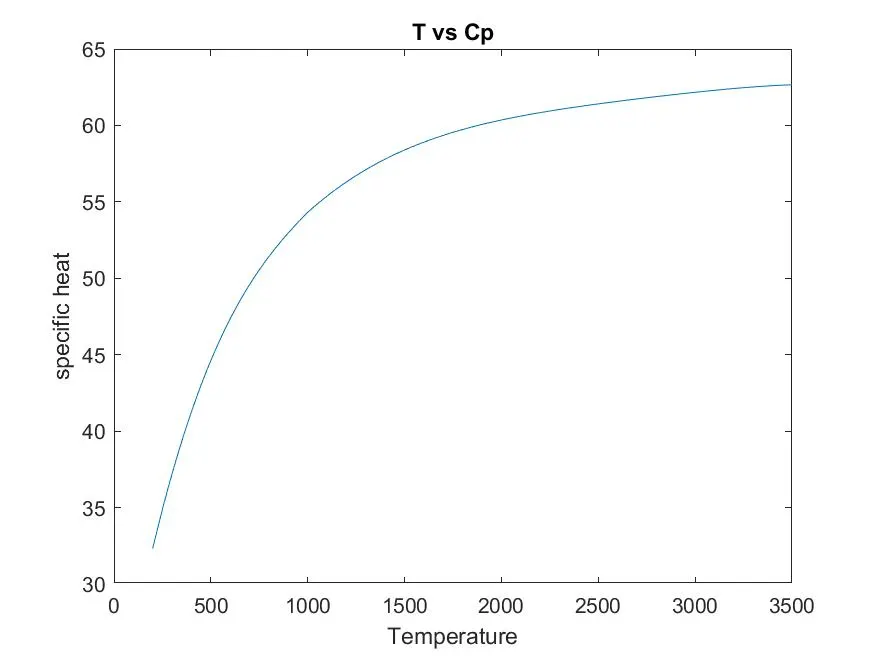
02. Temperature vs. Enthalpy.
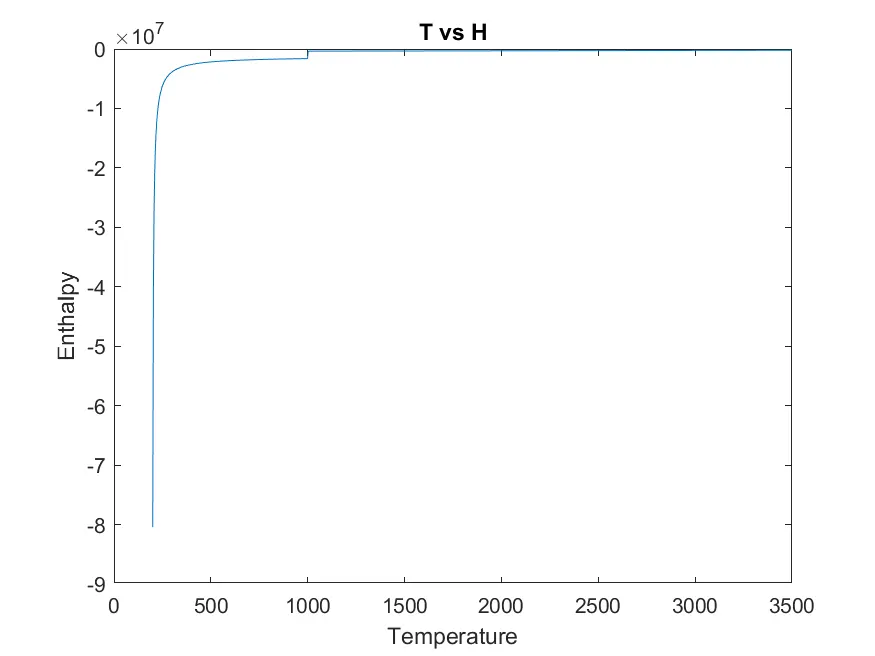
03. Temperature vs. Entropy.
Conclusion:
In this we studied the parsing of the information of the thermodynamic data file and how to use it to obtain the meaningful data.
Errors occured while coding:
Error-01
Use of round brackets to define the element from the cell array.
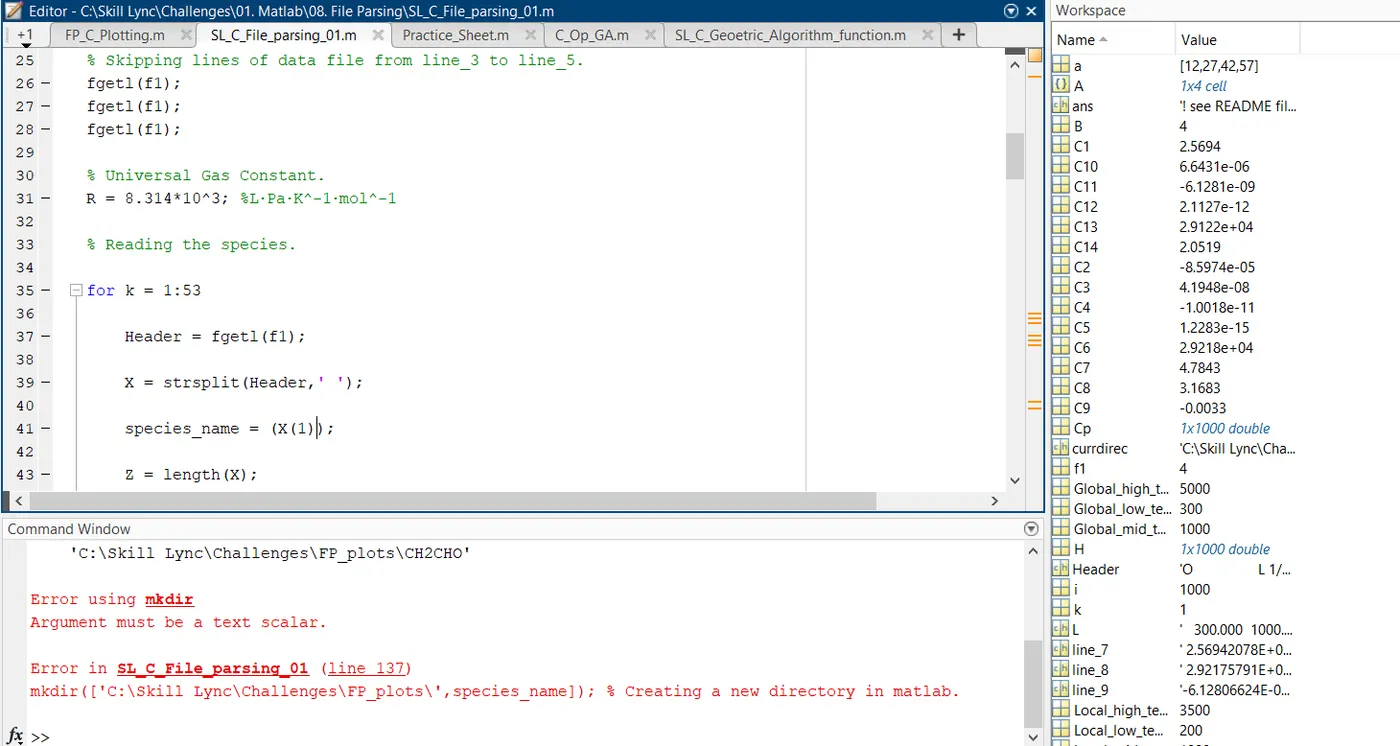
Figure-02: Screeenshot of the error where round brackets were used instead of the curly brackets.
Correction: Round brackets were replaced by the curly brackets.
Error-02
No use of the 'else' comand.
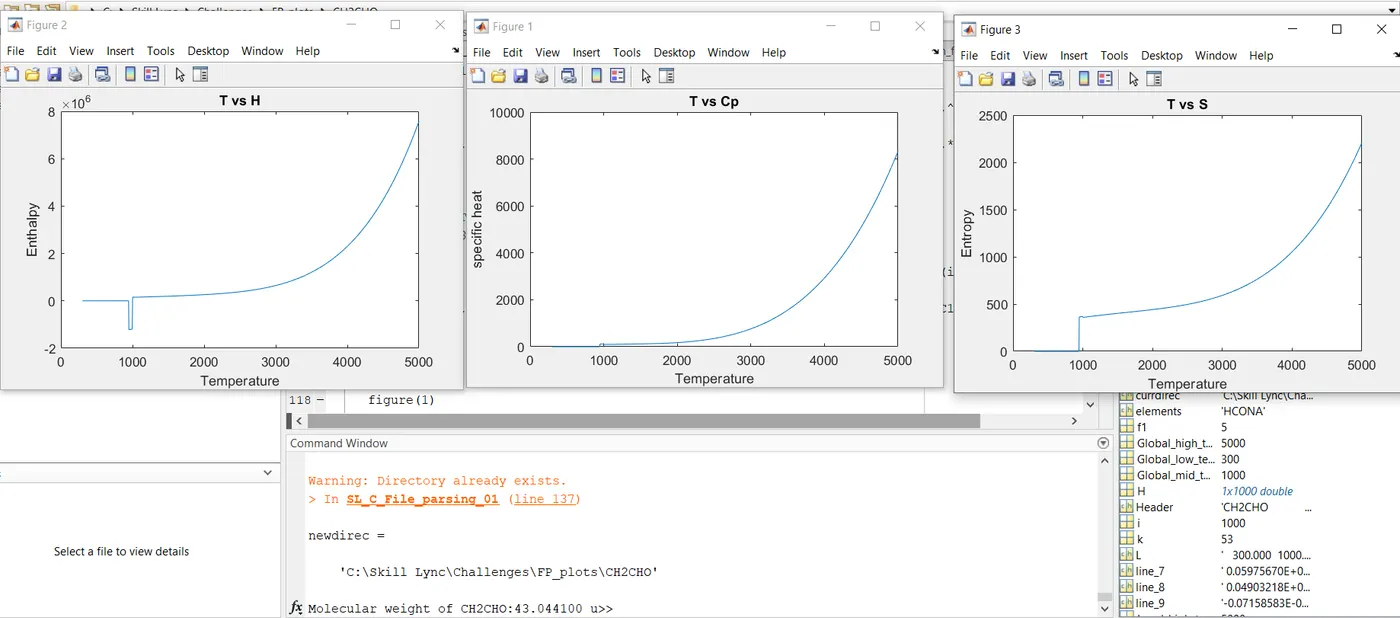
Figure-03: Screenshot of the error where else command was not used.
Correction: Due to absence of else command the lower temperature coefficients were mixing up with the the coefficients of higher temperature coefficients which resulted in the incorrect plots of the speciess. Thus else command was written to eliminate the errror.