FILE PARSING
FILE PARSING
AIM
To extract the co-efficient of all species from file and calculate specific heat, enthalpy and entropy of all species.
SPECIFIC HEAT
It is the amount of heat required to raise the temperature of 1Kg of substance by 1K.
ENTHALPY
It is a state variable that represents the total heat content of the system. It is equal to sum of internal energy of the system and product of pressure and volume of the system
ENTROPY
It is a measure of randomness of the system
FUNCTIONS USED IN MATLAB
fgetl()
It returns the next line in the file
strfind()
Syntax: strfind(string, letter to find)
It checks for the letter to find in the string given and returns the position of that letter.
contains()
Syntax: contains(string, letter to find)
It checks for the letter to find in the string given and returns logical answer 1 if it is in the string.
CODE EXPLANATION
- Defined all necessary empty variables and atomic mass of each element
- The main logic behind extracting the co-efficients is checking whether the line has the string E in it. To avoid confusion in logic within the program, first and last line are omitted for further operations
- As given in above functions list, CONTAINS function returns 1 if E is present within the line. However, letter E is there in some of the lines which are of no interest in extracting the co-efficients. To leave those lines, the following conditions are added:
- The line should not contain ! within it.
- The last element of the line should not be equal to 1. This is because, only the lines containing 2,3 and 4 at the end are necessary.
- Last five elements (spaces and number at the end) is not necessary. Therefore, after getting the correct line by using above logic, last five elements are removed in each line before proceeding further.
- In every iteration, the line obtained are concatenated to a variable called req_data.
- Using strfind function, position of E within req_data is obtained.
- Co-efficients are extracted by indexing in req_data and then it is converted into a number using str2num
- To extract local temperature and species name, line that contains 1 at the end is required. To get the local temperatures, delimiter used is ‘.’ and to get the species name, delimiter used is
- Up to the previous step, all co-efficients are stored in a variable called prop, local temperatures in a variable called temp and species name in a variable called species_c.
- To substitute the extracted information into the given formulae, the following logics are taken:
- In case of temperature, three temperatures are of one group to apply for one species. Therefore, in every iteration of for loop, increment value is given as 3. Out of 3 values, mid value is taken as the border between high and low temperature region. Between the low and high values, three hundred values are created using linspace. If temperature value is lesser than mid temperature, second 7 co-efficients will be applied into the formula and vice versa.
- In case of co-efficients, 14 co-efficients are of one group to apply for one species. Increment value for indexing is given as 14.
- For both temperature region, specific heat, enthalpy and entropy values are stored in cp,h and s respectively.
- Graphs for all three properties are plotted with respect to temperature in three separate figures.
- New directory is created using
- To create a separate folder for each species, species name is taken as the folder name as well.
- Then to find the molecular weight of each species, each species name is read by using for loop. The atomic weight will be taken based on the strings in the species name and the sum will be stored in a variable called molecular_mass.
CODE
clc
clear all
close all
% Loading the given file in read mode
file = fopen('THERMO.dat','r');
% Declaring the necessary variables
R = 8.314; % Unit: J/molK
req_data = [];
species_c = [];
temp = [];
cp = [];
h = [];
s = [];
% Declaring atomic weight of each elements
molecular_mass = 0;
carbon = 12; %Unit in g/mol
hydrogen = 1;%Unit in g/mol
oxygen = 16;%Unit in g/mol
nitrogen = 14;%Unit in g/mol
sulphur = 32; %Unit in g/mol
argon = 40;%Unit in g/mol
% Reading the file by using for loop
for i = 1:218
    data = fgetl(file);
    if i == 1 || i == 218   % Skipping first and last line
        continue;
    elseif contains(data, 'E') == 1 && contains(data, '!') == 0 && str2num(data(length(data))) ~= 1
        dt = data(1:length(data)-5);
        req_data = strcat(req_data,dt); % Extracing the co-efficients as string and stored
    elseif str2num(data(length(data))) == 1
        pos_t = strfind(data,'.');  % Extracting local temperatures
        for t = 1:3
            temp_dummy = data(pos_t(t)-4:pos_t(t)+3);
            temp_i = str2num(temp_dummy);
            temp = [temp temp_i];
        end
        pos_s = strfind(data,' '); %Extracting species name
        species_dummy = data(1:pos_s(1));
        species_c = [species_c species_dummy];
    end
end
position = strfind(req_data, 'E'); %Splitting the data by using delimiter
prop_s = req_data(1:position(1)+3);
prop = str2num(prop_s);
for j = 1:741
    x = req_data(position(j)+4:position(j+1)+3);
    y = str2num(x); % Converting string into a number
    prop = [prop y];
end
prop = prop';
b = 1;
d = 1;
space = strfind(species_c,' ');
for a = 1:3:159
    Temperature = linspace(temp(a),temp(a+2),300); %Creating points between low and high temperature range
    for c = 1:300
        if Temperature(c)>temp(a+1)
        cp_t = R*(prop(b)+prop(b+1)*Temperature(c)+prop(b+2)*Temperature(c)^2+prop(b+3)*Temperature(c)^3+prop(b+4)*Temperature(c)^4);
        h_t = R*Temperature(c)*(prop(b)+prop(b+1)*Temperature(c)/2+prop(b+2)*Temperature(c)^2/3+prop(b+3)*Temperature(c)^3/4+prop(b+4)*Temperature(c)^4/5+prop(b+5)/Temperature(c));
        s_t = R*(prop(b)*log(Temperature(c))+prop(b+1)*Temperature(c)+prop(b+2)*Temperature(c)^2/2+prop(b+3)*Temperature(c)^3/3+prop(b+4)*Temperature(c)^4/4+prop(b+6));
        cp = [cp cp_t];
        h = [h h_t];
        s = [s s_t];
        else
        cp_t = R*(prop(b+7)+prop(b+8)*Temperature(c)+prop(b+9)*Temperature(c)^2+prop(b+10)*Temperature(c)^3+prop(b+11)*Temperature(c)^4);
        h_t = R*Temperature(c)*(prop(b+7)+prop(b+8)*Temperature(c)/2+prop(b+9)*Temperature(c)^2/3+prop(b+10)*Temperature(c)^3/4+prop(b+11)*Temperature(c)^4/5+prop(b+12)/Temperature(c));
        s_t = R*(prop(b+7)*log(Temperature(c))+prop(b+8)*Temperature(c)+prop(b+9)*Temperature(c)^2/2+prop(b+10)*Temperature(c)^3/3+prop(b+11)*Temperature(c)^4/4+prop(b+13));
        cp = [cp cp_t];
        h = [h h_t];
        s = [s s_t];
        end
    end
    if d == 1
        species = species_c(1:space(d));
    else
        species = species_c(space(d-1):space(d));
    end
    d = d+1;
    for m = 1:length(species)
        if species(m) == 'O'
            molecular_mass = molecular_mass+oxygen;
        elseif species(m) == 'H'
            molecular_mass = molecular_mass+hydrogen;
        elseif species(m) == 'C'
            molecular_mass = molecular_mass+carbon;
        elseif species(m) == 'N'
            molecular_mass = molecular_mass+nitrogen;
        elseif species(m) == 'S'
            molecular_mass = molecular_mass+sulphur;
        elseif species(m) == 'A'
            molecular_mass = molecular_mass+argon;
        elseif isnumeric(str2num(species(m))) == 1
            m1 = str2num(species(m));
            if isempty(m1) == 1
                continue
            elseif species(m-1) == 'O'
                mm = (m1-1)*oxygen;
                molecular_mass = molecular_mass+mm;
            elseif species(m-1) == 'H'
                mm = (m1-1)*hydrogen;
                molecular_mass = molecular_mass+mm;
            elseif species(m-1) == 'C'
                mm = (m1-1)*carbon;
                molecular_mass = molecular_mass+mm;
            elseif species(m-1) == 'N'
                mm = (m1-1)*nitrogen;
                molecular_mass = molecular_mass+mm;
            end
        end
    end
    fprintf('The molecular mass of%s is %d g/mol.',species,molecular_mass)
    fprintf('\n')
    mkdir(['C:\Studies\MATLAB_for_Mechanical_Engineers\File_Parsing\',species]);
    figure(1)
    plot(Temperature,cp,'Color','b','linewidth',2)
    xlabel('Temperature in K');
    ylabel('Specific heat in J/molK');
    title('Specific heat');
    figure(2)
    plot(Temperature,h,'Color','r','linewidth',2)
    xlabel('Temperature in K');
    ylabel('Enthalpy in J/mol');
    title('Enthalpy');
    figure(3)
    plot(Temperature,s,'Color','k','linewidth',2)
    xlabel('Temperature in K');
    ylabel('Entropy in J/K');
    title('Entropy');
    dir = (['C:\Studies\MATLAB_for_Mechanical_Engineers\File_Parsing\',species]);
    cd(dir)
    saveas(1,'Specific heat.jpg')
    saveas(2,'Enthalpy.jpg')
    saveas(3,'Entropy.jpg')
    cp = [];
    h = [];
    s = [];
    molecular_mass = 0;
    b = b+14;
end
RESULTS
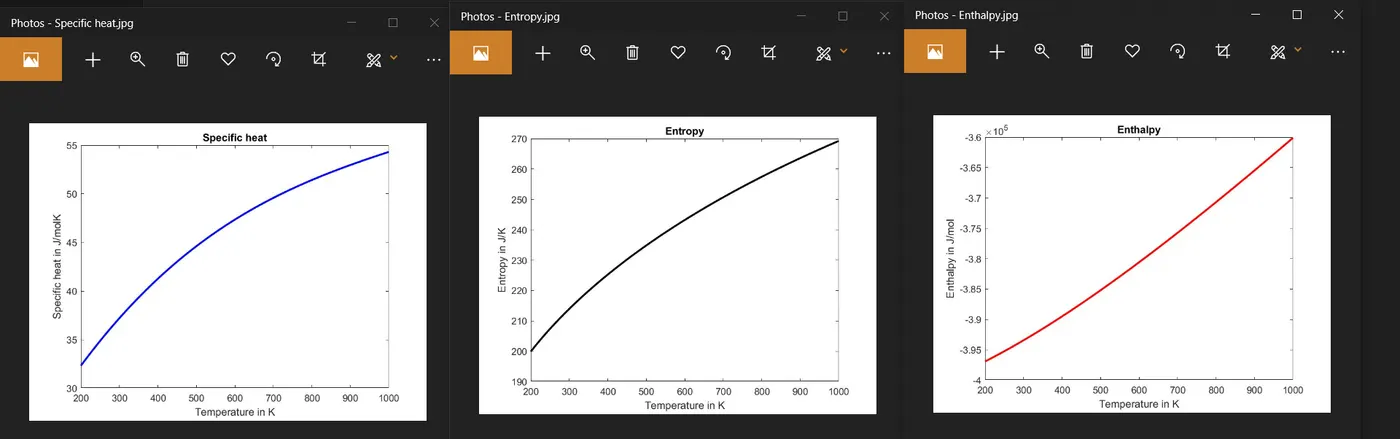
The co-efficients are extracted from the file and plots are created for all three properties with respect to temperature and save automatically as shown below

Plots created for O2 is given below
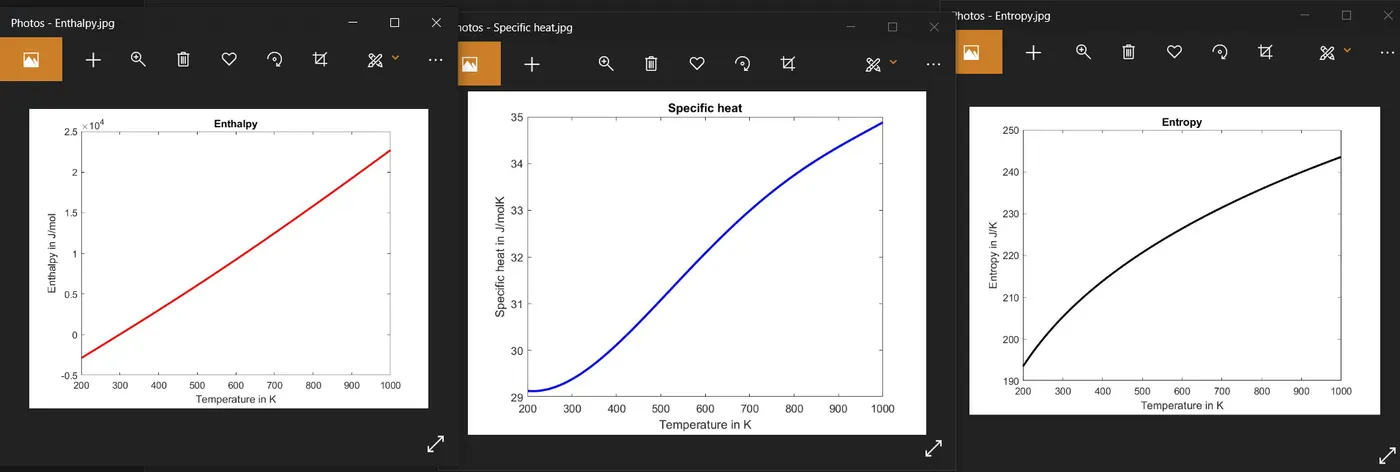
Plots created for N2
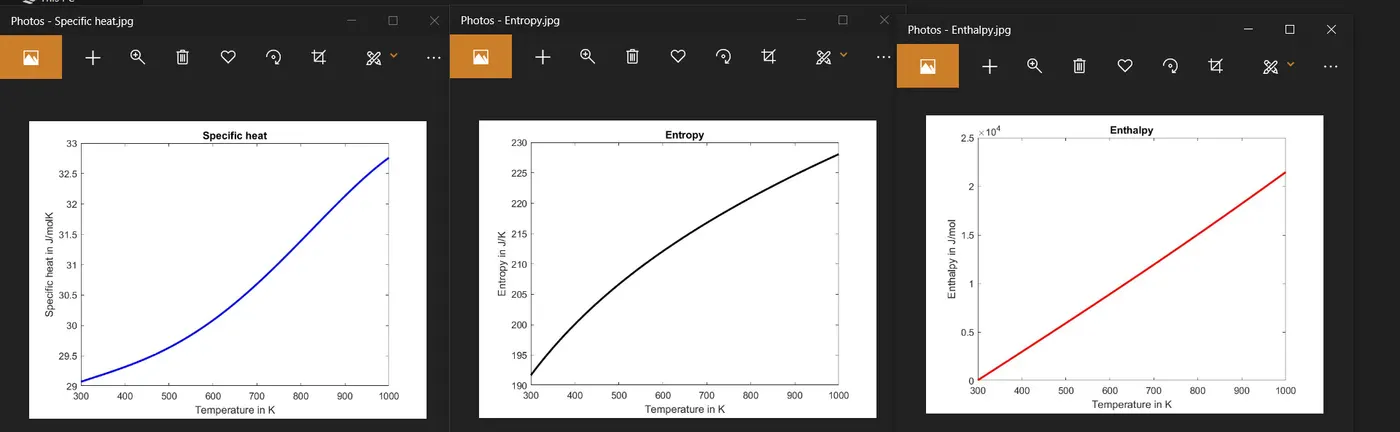
Plots created for CO2