Modelling of a 4-Cylinder compact Diesel Engine in compliance with BS 6 Emission Standards using GT Power
PROBLEM STATEMENT:
To develop a Diesel Engine for commercial application with high fuel efficiency and in compliance with BS6 Emission Standards in GT-Power.
INTRODUCTION:
Achieving upcoming BS-VI emission norms and satisfying customer demands is a very challenging task for the OEM's. There are two main strategies to reduce tailpipe emissions. These methods are common to both gasoline and diesel engines.
- In-Cylinder strategy:
- Bowl/ Injection strategy to optimize the combustion patterns to reduce emissions
- Exhaust Gas Recirculation to reduce NOx
- Downsizing/ Downspeeding to reduce the amount of emissions
- Component design optimization
- After-treatment technology:
- SCR
- DOC
- DPF
- TWC
Different OEM's use different strategies for achieving the emission limits. Achieving BS6 limits demands the use of the right combination of In-cylinder and After-treatment devices and other advanced fuel injection techniques and regulation of air flow within the engine. In this project, a combination of some of the above mentioned strats are employed to come up with a BS6 Compliant engine.
METHODOLOGY AND PLANT MODEL OF ENGINE:
NOTE: Whenever necessary and in cases of lack of data, suitable assumptions are made in the modelling and the calibration of engine. In this regard, the recorded results of the engine may not be accurate. This project only serves the purpose to understand the physics behind the modelling of the engine, understanding the trends in the outcome and variation of the trends while calibrating the different components.
The engine that is to be modelled and calibrated is a 5 Litre, 4-Cylinder, Turbocharged Diesel Engine with CRDI Intake System in compliance with BS6 Emission Standards. The modelling of the engine is done on GT-Power using the FRM Builder Approach. The target Engine Performance to be achieved is shown below:
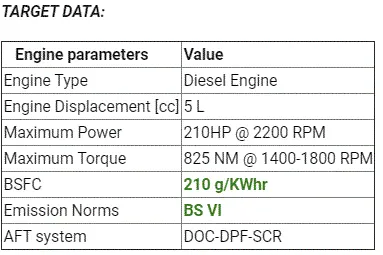
The engine is built phase by phase using the following methodology. The Base Layout of the Engine is shown after the methodology.
- Initially the geometrical aspects of the engine (Bore, Stroke, Compression ratio) is decided based on the total capacity of 5L. Further details about the geometry is mentioned in the geometry section.
- The Engine modeling is done for Max Power and Max Torque on baseline configurations (Geometric) using the FRM builder approach and is filtered on the performance targets. This is considered as end of Phase 1.
- Phase 1 results is used to further fine tune the model and proceed for combustion development by calibrating the necessary parameters for Phase 2.
- Phase 2 involves using a Non-Predictive combustion model [DI-Wiebe] to achieve the performance targets.
- In Phase 3, calibrations is done using a Predictive Combustion Model (DI- Pulse) and other required simulation models such as: Heat Transfer Model ; Friction Model ; Emission Model and After-treatment systems required for BS6 Compliance is set-up.
- In Phase 4, the Calibration of the Engine is done with a trade-off between Performacena and Emissions to arrive at the final model.
The engine plant model shows the basic subsystems present in this engine. They are: Intake, Turbocharger Unit, EGR, the Cylinder Arrangement, the Exhaust system and the Electronic Controller. Each sub-systems are explained in detail in forthcoming sections.
PLANT MODEL OF ENGINE:
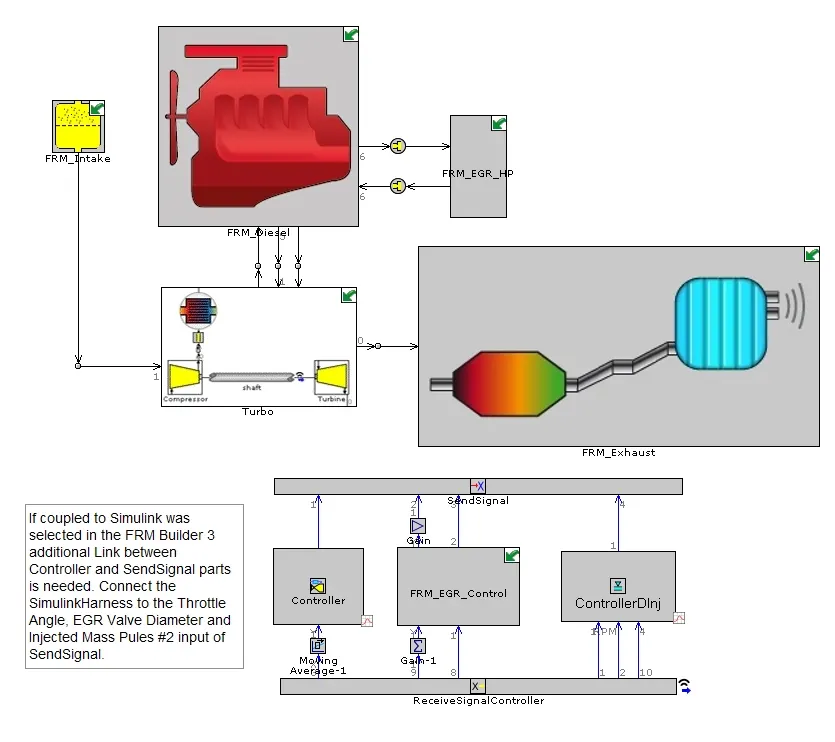
THE DIFFERENT SUB-SYSTEMS IN ENGINE AND SIMULATION MODELS USED:
A) Intake Sub-System:
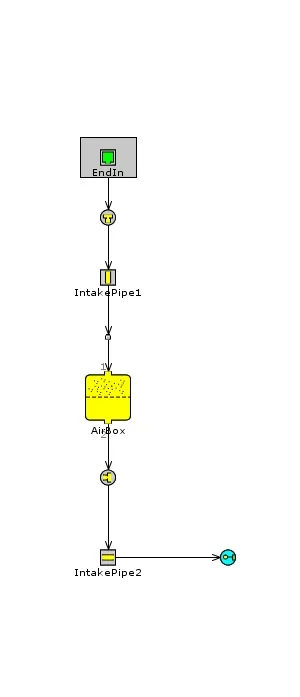
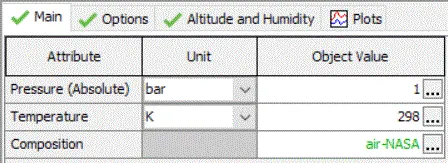
The intake circuit of the Engine is quite simple. It consists of intake pipes which directs the incoming air to the Airbox. The function of the Airbox is to filter the incoming air. The 'Inlet End Environment' is shown above. Air enters at 1 bar and 298K. From the intake, air proceeds to the Turbocharger unit.
B) Turbocharger Unit:
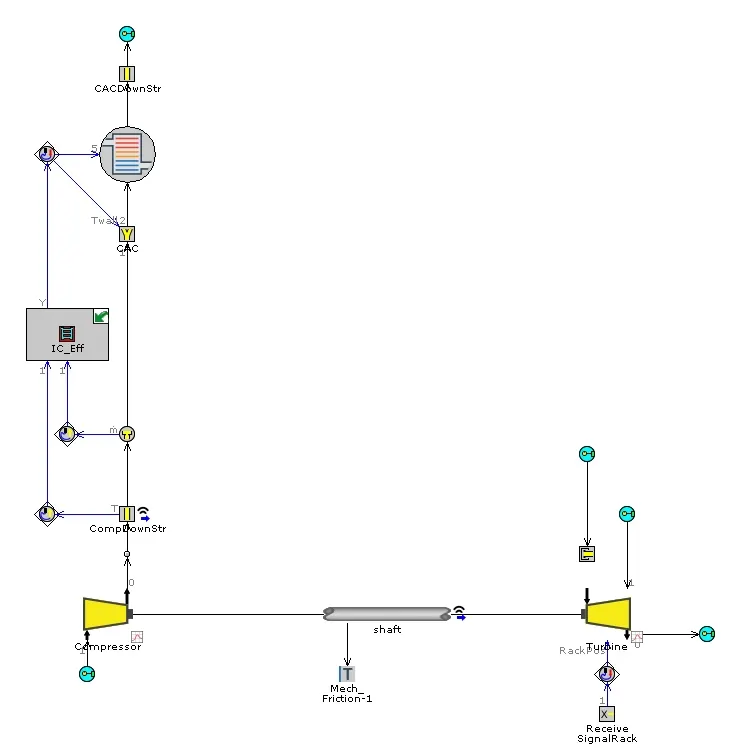
From the intake, air enters the Turbocharger unit. The turbocharger unit consists of a Variable Geometry Turbine (VGT) coupled witgh a Compressor unit. The compressor takes energy from a variable geometry turbine that controls the amount of kinetic energy entering the the turbocharger unit. This can help in preventing mechanical failure by exceeding the max pressure in the cylinder.
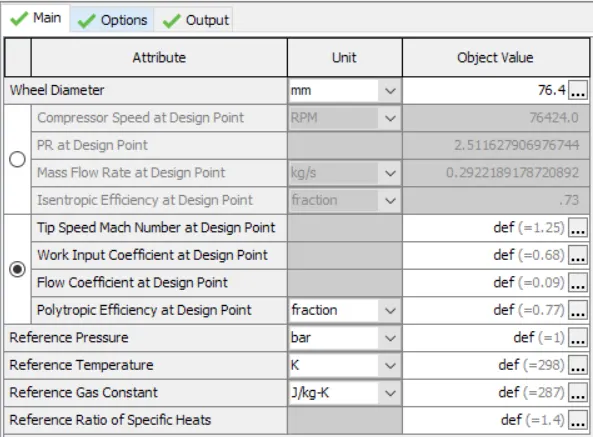
In GT-Power, the compressor and turbine object is defined with a reference temperature and pressure. To supply compressor / turbine data as well as the Performance Maps, a standard SAE data file can be input. This standard SAE data file will be given by the compressor supplier. In cases where the performance maps are not available, GT Power allows the user to input the map data as function of engine parameters using the reference template 'CompressorMapParam'. This template takes the compressor performance data from a single operating point, and generates a fully extrapolated map using a set of physically-based parametric equations. This single operating point (design point) is assumed to be the peak efficiency point on the compressor map, and the inputs at the design point should be specified accordingly.
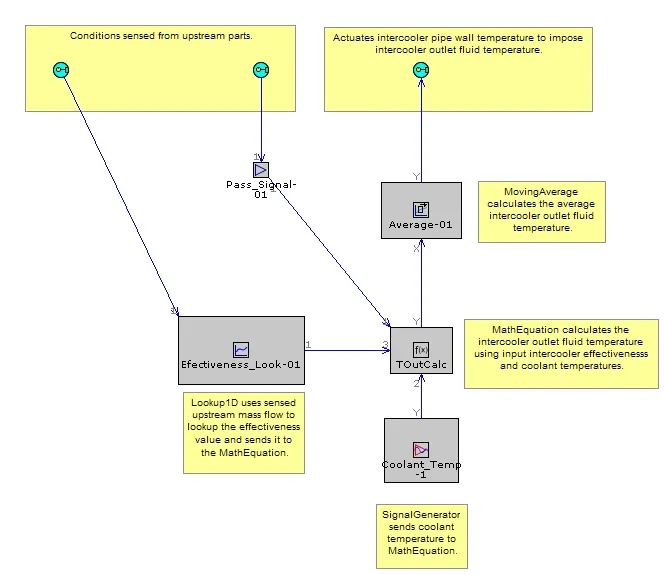
Post compression, the temperature of air will be high. It is of need to reduce the temperature of air which would increase the specific volume of air. Hence at lower temperature more volume of air can be accomodated. For this purpose a Charge Air Cooler (CAC) is present. The CAC is a heat exchanger through which the engine coolant flows. Based on the mass flow rate entering the CAC, the CAC effectiveness is calculated [shown below in the plot] and the coolant is discharged. This sums up the Turbo Unit. Shown below is the electronic circuit of CAC temperature controller.
C) Engine Main Unit:
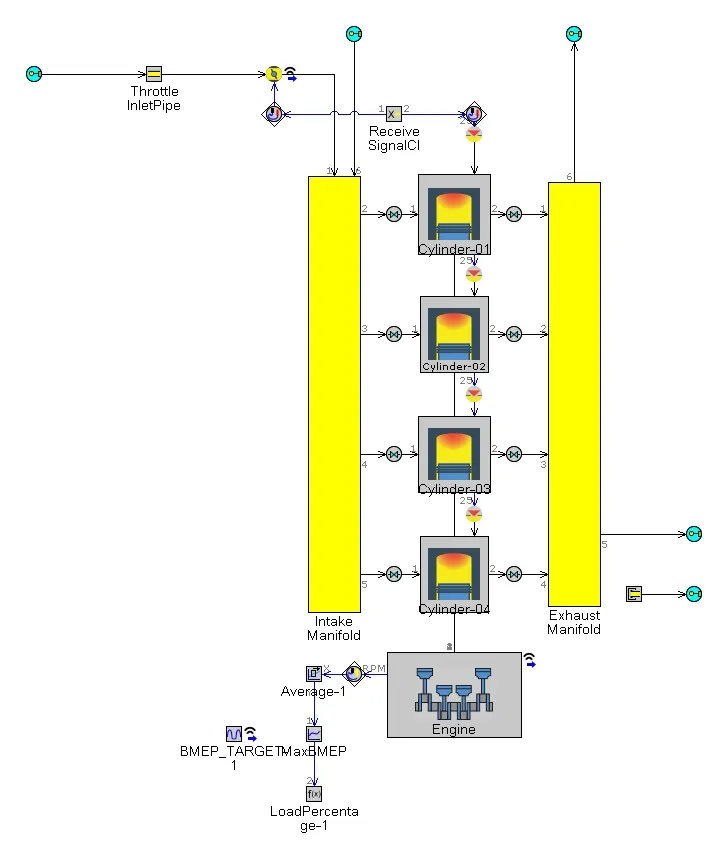
The main engine consists of the Intake and Exhaust manifolds, the valves, Fuel Injector and the cyliders. Shown below is the plant layout.
Design Considerations of Engine:
a) Geometrical Design:
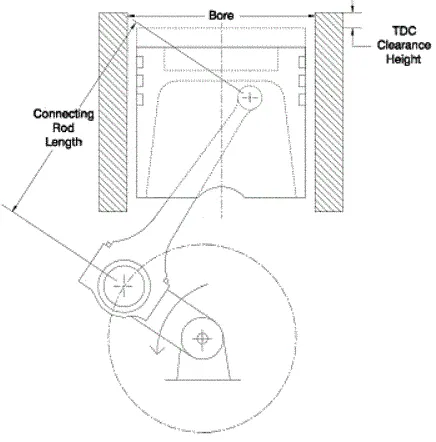
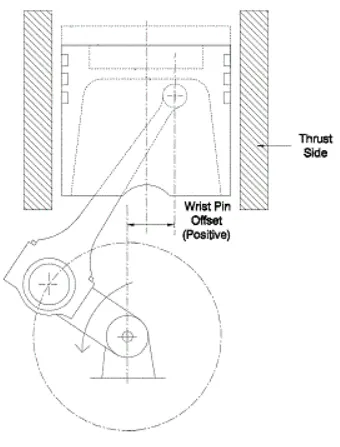
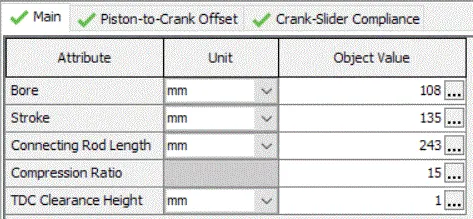
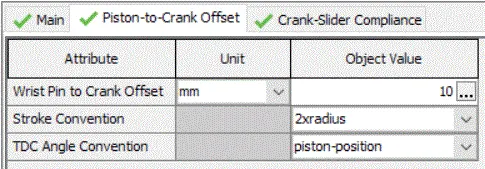
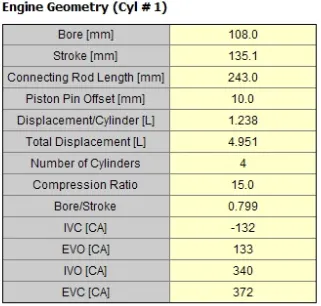
Target is a 4 cylinder 5L engine. Considering the low speed, high torque requirements, an Under-square engine of Bore:Stroke ratio 0.8 is considered. The bore diameter is 108 mm and stroke calculated from B:S ratio is 135 mm. The compression ratio is 15. The connecting rod length of 243 mm is less than twice the stroke value. The clearance height at TDC is 1mm. A wrist pin offset of 10 mm is given to reduce the stess on the connecting rod (which increases the durability) as well as to decrease the force needed to rotate the crank shaft with lesser effort. The firing order of the cylinders are 1 - 3 - 4 - 2.
b) Cylinder Object:
The template EngCylinder - Engine Cylinder is used to specify the attributes of engine cylinders.
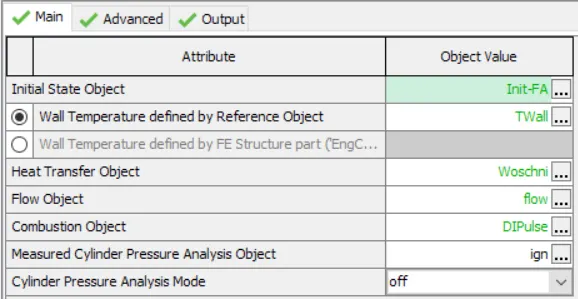
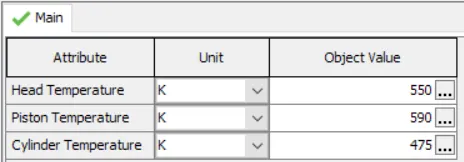
The cylinder contains various objects such as Initial State, Combustion, Heat transfer, Flow. The calibration of these objects are discussed in the calibration section. The intake and the exhaust valves are also modelled and calibrated according to the needs. Before the Intake manifold, an orifice is present to control the amount of air entering the manifold and as well as to maintain the pressure differential. The imposed temperature on the Intake and Exhaust manifold is 330K and 550K respectively. The cylinder template as well as the cylinder imposed temperatures are shown.
c) Intake Valve Specifications:
The template used to model the valve is ValveCamConn - Cam-Driven Valve with Imposed Lift vs. Angle. This template defines the characteristics of a cam-driven valve including its geometry, lift profile, and flow characteristics.
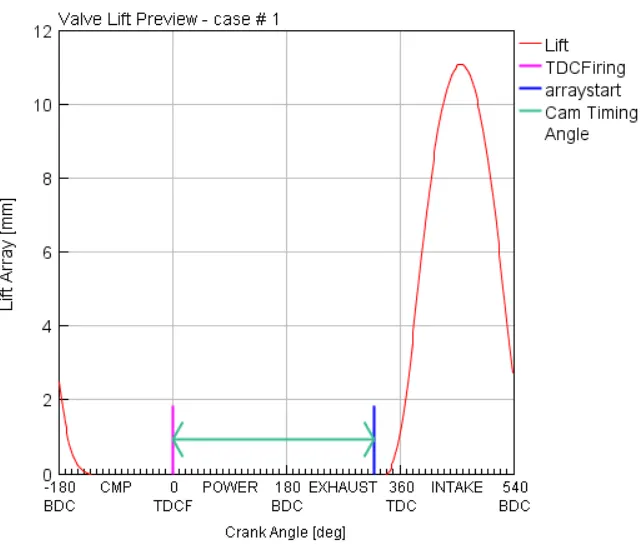
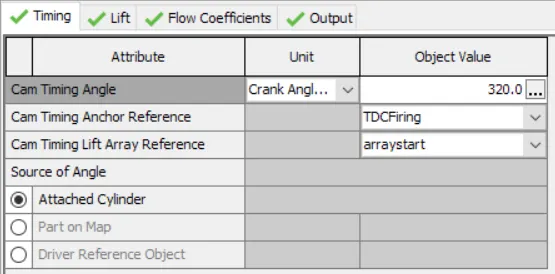
The Intake valve diameter is 43.2 mm. The plot of Intake Lift for the reference cam angle of 320 degrees and the plot of flow coefficient is shown. The pressure drop due to varying shape of ports and frictional losses are comphensated during the input of the flow coefficients in the Intake and Exhaust Valves.
d) Exhaust Valve Specifications:
The Exhaust valve is similar to the Intake counterpart. The template used to model the valve is ValveCamConn - Cam-Driven Valve with Imposed Lift vs. Angle. This template defines the characteristics of a cam-driven valve including its geometry, lift profile, and flow characteristics.
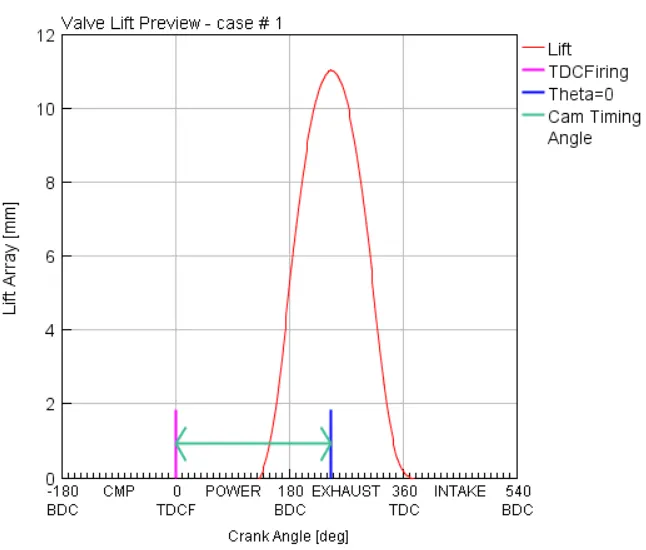
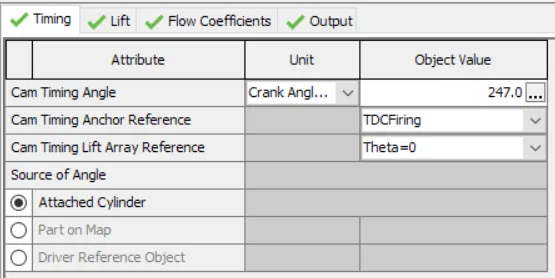
The Exhaust valve diameter is 35.64 mm. The plot of Exhaust Lift for the reference cam angle of 247 degrees and the plot of flow coefficient is shown. The pressure drop due to varying shape of ports and frictional losses are comphensated during the input of the flow coefficients in the Intake and Exhaust Valves.
e) Fuel Injection:
This Engine has a CRDI Fuel Intake system. The Common Rail Diesel Injection (CRDI) is a system where the pressure can be regulated before injection. The electronic injector can either be a Solenoid or Piezo injector. Piezo injectors works ~4 times faster than solenoids. The main advantages of CRDi are:
- Fuel Pressure available on demand.
- Higher Injection pressures and finer atomization of fuel
- Injection pressure created independant of Engine speed
- Multiple injections per cylinder combustion is available.
- Reduction of overall emissions espcially particulate matter
- Improved fuel efficiency and high performance
To model this in GT, the InjMultiProfileConn - Multiple Pulse Injection Connection is used. This injection connection allows for multiple pulse injection of periodic mass flow rate or pressure profiles. It is very similar to 'InjProfileConn', except that this template allows for convenient specification of multiple profiles. The individual profiles are not allowed to overlap. This template is typically used for direct-injection diesel engines.
The specification of Nozzles in the injector is shown below.
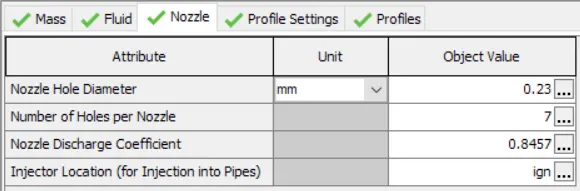
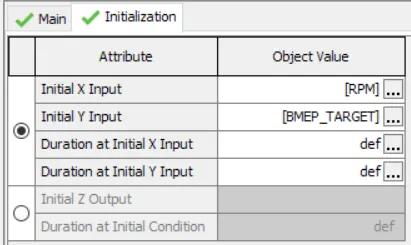
The rail pressure in the injector is 2000 bar. This template uses a separate Injection timing and Injection Profile object. The start of Injection (SOI) is divided into two - Pre-Injection and Main Injection. The instantaneous injection timing is a function of Engine RPM and the BMEP. One such Injection curve is shown as well.
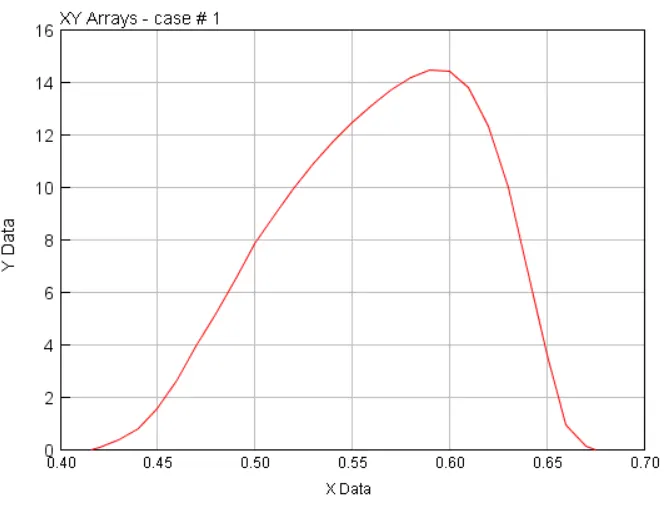
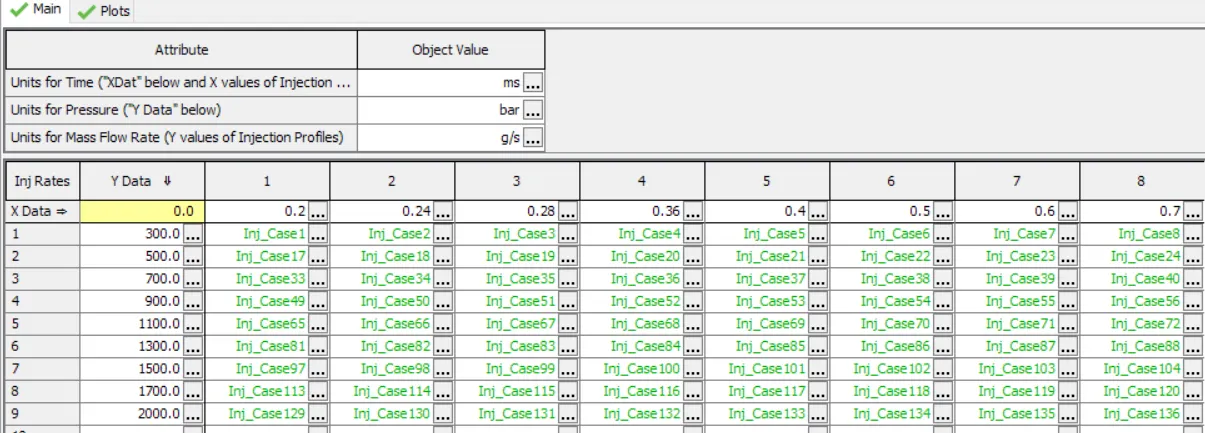
The injection rate map (or) profile is a function of the Pressure and the Mass flow rate. It changes with changes in the factors. Shown below the table of Injection models available which are selected based on the instantaneous value of Pressure and Mass flow rate. Each value holds a different injection profile such as the one shown above.
f) Injection Pulse Calculation:
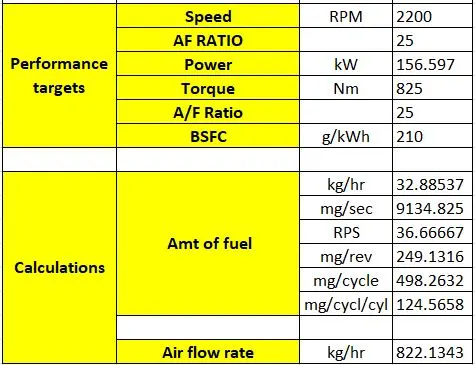
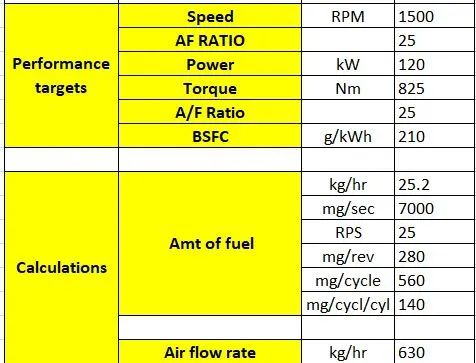
It is important to specify the amount or mass of fuel that is injected per pulse. This value is calculated based on the target BSFC and the target Power. Using target Power and BSFC, the 'amount of fuel in kg/hour' is determined. With RPM as another input, the 'amount of fuel per revolution' is determined which can be further simplified to 'amount of fuel needed per cycle per cylinder' AKA 1 Pulse. The calculations are shown below for Rated Speed of 2200 RPM and Intermediate speed of 1500 RPM:
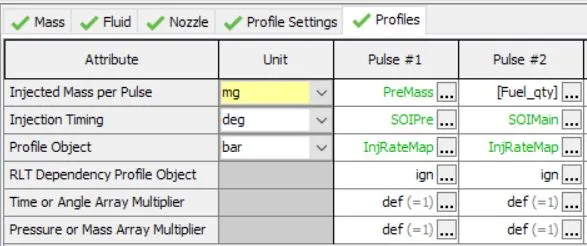
All of the above mentioned data are entered under the 'Profiles Tab' of the Injector template. An image of the same is shown below. With this, the injector modelling is complete.
C) Engine EGR:
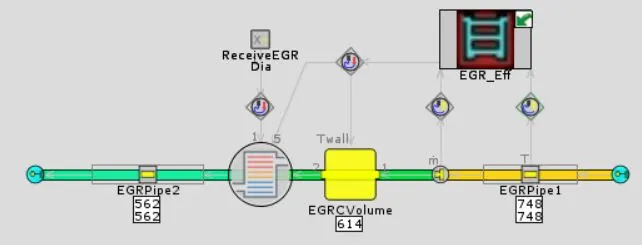
EGR is the next sub-system. Exhaust Gas Recirculation (EGR) is an effective In-cylinder strategy to control NOx emissions from diesel engines. The EGR reduces NOx through lowering the oxygen concentration in the combustion chamber as well as through heat absorption. In the process, the max in cylinder temperature decreases and thereby decreases the NOx formation. The EGR system is active mainly during partial engine loads and at low and medium engine speed areas, where oxygen is in excess. In the high engine load or torque, the EGR system is deactivated as the cylinders being filled only with air, ready for combustion.
Depending on the pressure of the recirculated exhaust gases, there are two types of external EGR systems:
- High Pressure EGR: The exhaust gas are harvested before entering the turbine and reintroduced in the intake manifold after the compressor. Since both the areas are of high pressure, it is called High Pressure EGR
- Low Pressure EGR: The exhaust gas are harvested after the turbine and reintroduced in the intake manifold before the compressor. In this case, both the areas are at low pressure and hence called Low Pressure EGR.
In this project, a High Pressure EGR system is used. Since EGR's activates at partial load conditions when oxygen available is less, EGR does not activate in this project.
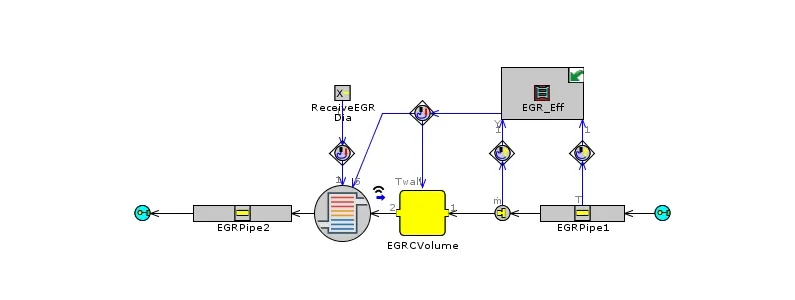
The EGR takes a part of the exhaust air. This charge is initially filtered so that, it does not pollute incoming ambient air to the cylinder. Next it passes through the EGR CAC which reduces the temperature to ~ 373 to 400 K. The temperature must not drop below 353K as the exhaust particles will start to stick on walls on Intake manifold below that temperature. After cooling, the amount of EGR that enters the Intake manifold is controlled electronically by controlling the diameter of the EGR tube. This control is based on instantaneous Engine RPM and Average BMEP.
D) Exhaust System:
The exhaust system contains the After-treatment devices to limit the emission. Under BS6 norms, the allowed levels of emissions are 0.46 g/kWh of NOx, 0.01 g/kWh of PM for heavy vehicles. The current BS4 emissions limits are mentioned as well in later sections.
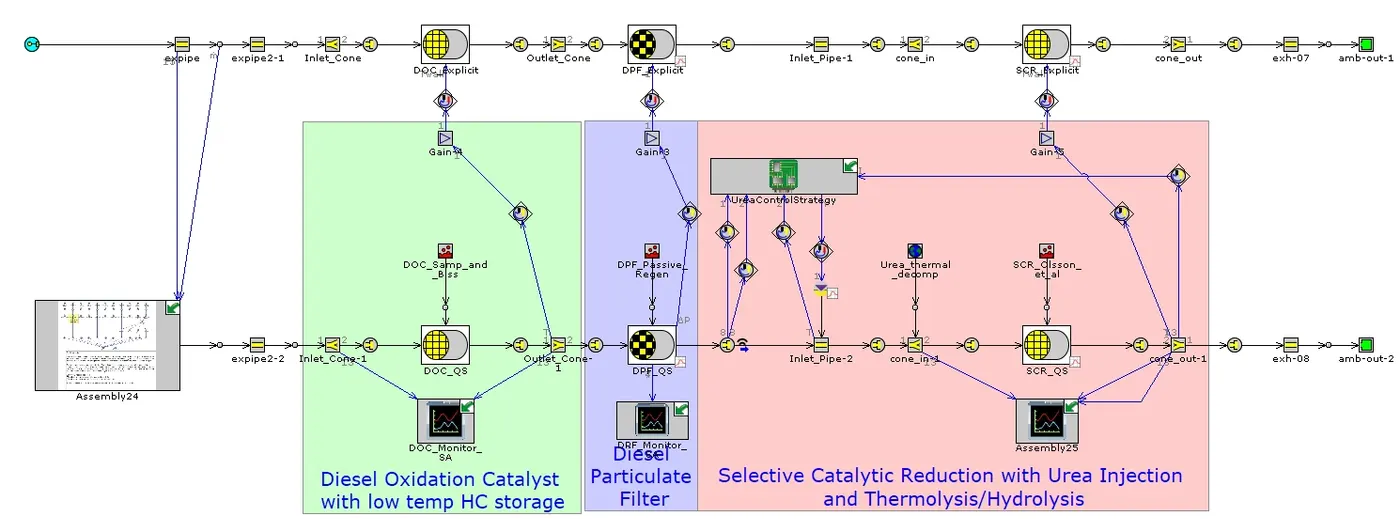
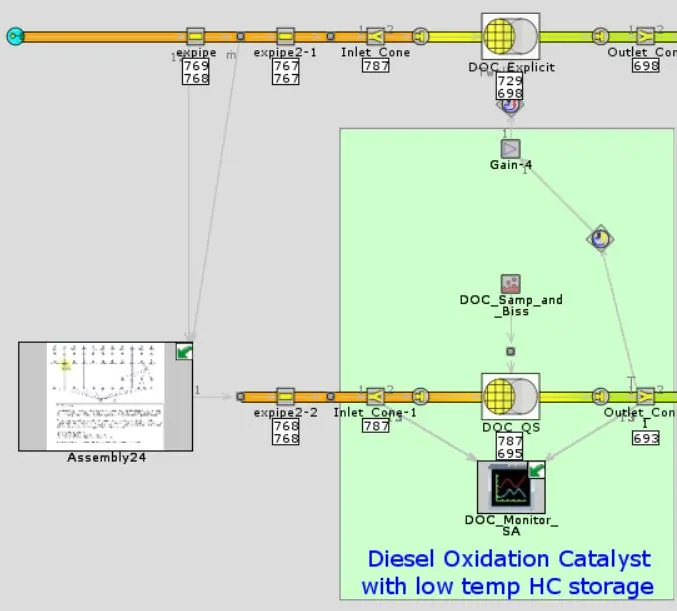
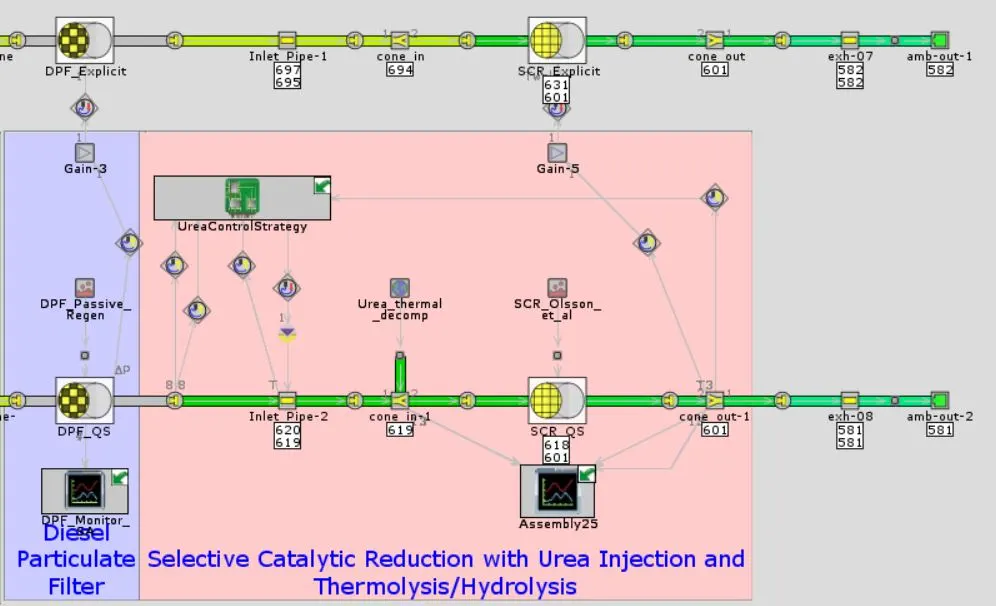
The aftertreatment systems in CI engines consists of three separate devices called Diesel Oxidation Catalyst (DOC) , Diesel Particulate Filter (DPF) and Selective Catalytic Reduction (SCR). The main function of DOC is to reduce the CO and HC concentrations and maintain a ratio of 1:1 in the concentrations of NO and NO2. This is because, in the reaction mechanism of NO and NO2, their ratios must be almost 1:1 for the faster reaction to occur. DPF is basically a filter to remove the particulate matter (PM) from the exhaust gases. SCR deals with NOx emissions. The detailed model of the After-treatment system modelled in this project is shown below.
a) DOC Modelling:
The two main functions of DOC is to reduce the CO, HC concentrations and to maintain 1:1 ratio of NO, NO2 gases present in the exhaust. Maintaining 1:1 ratio is of prime importance as only then the surface reactions will proceed at higher rates of conversion. This poses as a main challenge in the implementation of the DOC ATS. Shown below is the modelling of DOC.
i) Geometry:
ii) DOC Surface Reactions:
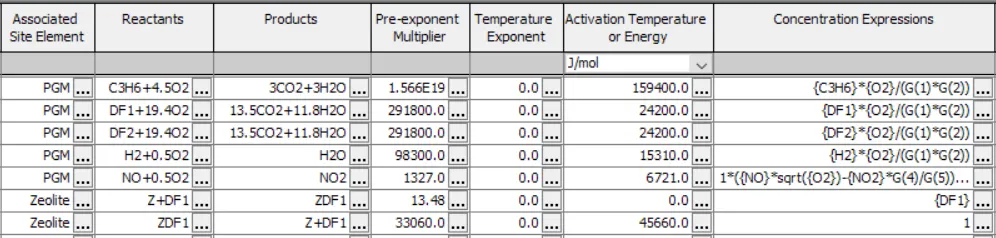
The surface reactions are governed by the Arhennius Rate Law expression which is shown in the SI Engine section. The DOC surface reactions are based on surface reactions as reported in "Hydrocarbon storage modeling for diesel oxidation catalysts", Chaitanya S. Sampara, Edward J. Bissett, and Dennis Assanis, Chemical Engineering Science, 63 pp. 5179-5192 (2008).
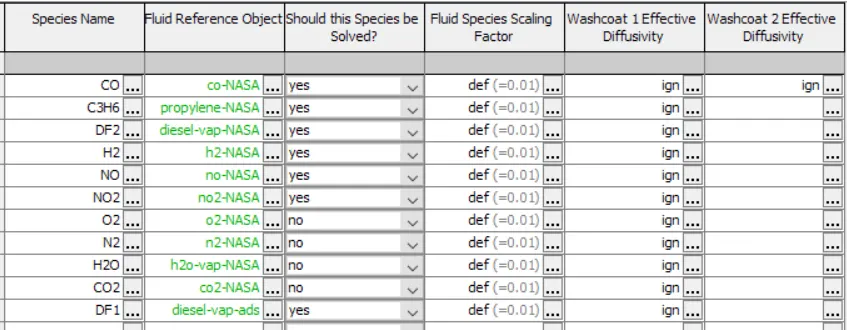
The species and reactions involved as well as Inhibition reactions are shown below respectively.
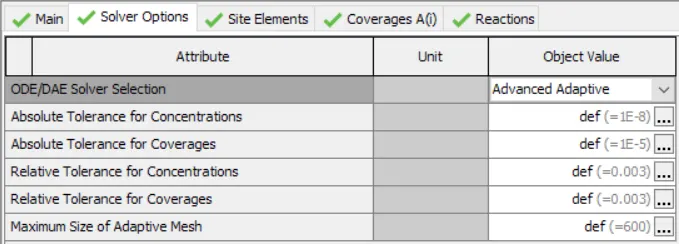
Advanced Adaptive is a flow-through reactor solution method that uses an adaptive mesh to adjust to the demands of the moving reaction fronts. It is generally faster than the other solvers. This is the recommended chemistry solver for flow-through catalyst models for speed.
iii) Conversion Monitoring:
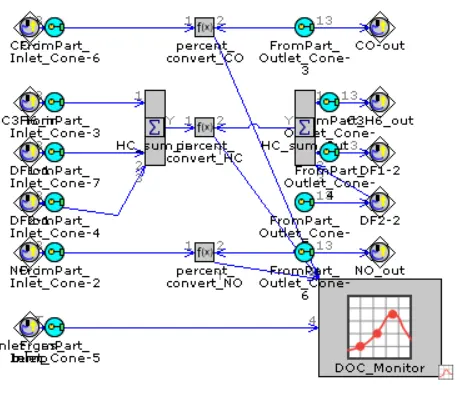
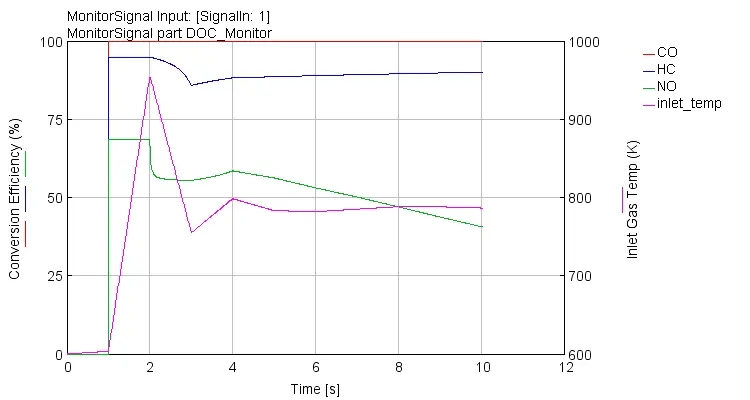
The main function of this module is to calculate the conversion efficiency of every species based on the formula max(0,100*((inlet_conc-outlet_conc)/(max(1e-10,inlet_conc)))). The convertor takes in inputs of concentration from the inlet and outlet of the catalyst brick and other parameters such as Inlet gas temperature to yield a final conversion percenatge based on the above formula. This conversion efficiency is calculated for each exhaust species present in the model. The circuit is shown below:
b) DPF Modelling:
The main fuction of DPF is to reduce the particulate matter (PM) present in the exhaust gases due to the heterogeneous mixture of air and fuel in CI Engine. Usually high filtering efficiencies of ~98% are easily achieved by the filters. But the main challenge faced here is the regeneration of the filters.
After a few cycles of engine operation, the PM gets embedded on the surface of filters which further blocks the movement of the exhaust air. This is when regeneration process has to take place. There are two types of regeneration: Active and Passive. Active regeneration works by injecting extra fuel in order to increase the the temperature of the exhaust gases and burn off the soot in the DPF. Passive regeneration occurs when the load and speed of the engine produce temperatures greater than 350 degrees C, and it burns off the trapped soot as the vehicle operates. The need for regeneration is decided by measuring the pressure drop across the filter. Shown below is the modelling of DPF.
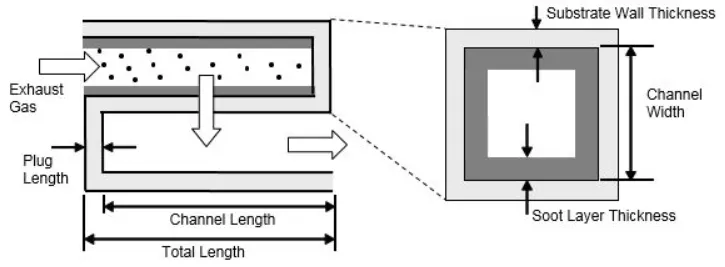
i) Geometry:
ii) DPF Surface Reactions:
The considered species are shown below:

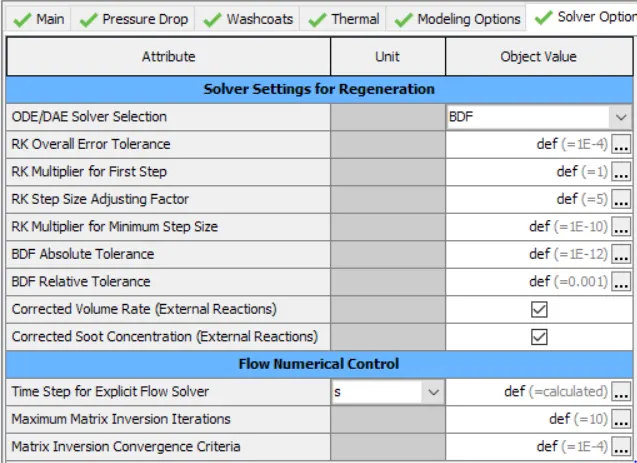
The reaction that occurs is shown: C + NO2 `implies`CO + NO. The solver settings used in DPF modelling is shown:
iii) Conversion Monitoring:
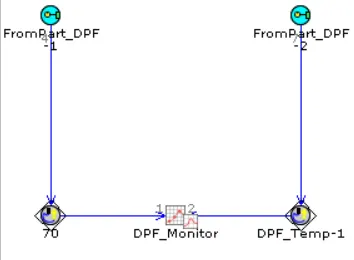
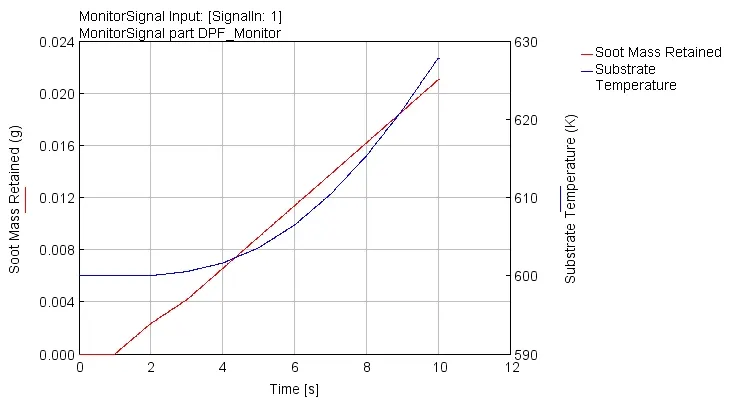
The conversion monitoring circuit is shown. The parameter monitored is 'Soot Mass Retained'. This retained mass is important to determine when the regeneration of DPF has to be done.
c) SCR Modelling:
The SCR Modelling is the most complex system to model. The main function of SCR is reduce NOx emissions. This is achieved by injecting liquid urea. The liquid urea is converted to ammonia by thermal decomposition and is uniformly mixed with the exhaust gases. The inlet temperature of urea injection into the SCR is of vital importance. The minimum temperature of urea injection is 180 degrees celcius. Below this temperature, urea gets deposited onto the pipes. The limit and time of urea injection is based on the following factors:
- Temperature
- Amount of Ammonia slip
- NO and NO2 ratio
- Urea thermal decomposition
There are different sensors that keeps track of above parameters all of which sends signals to the Aftertreatment Control Unit (ACU), which decides the amount and time of urea injection. The model is shown below:
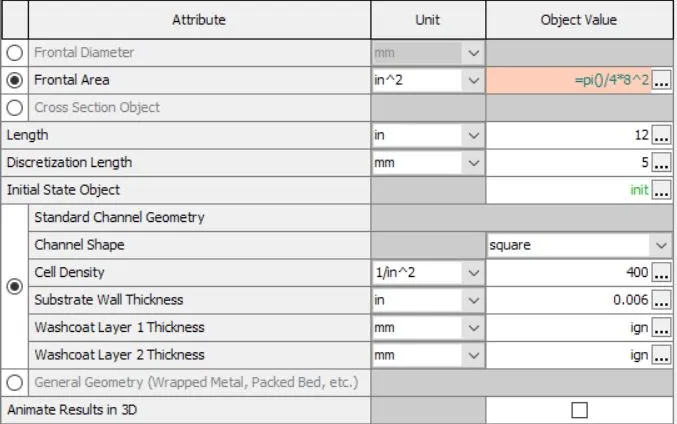
i) Geometry:
ii) SCR Surface Reactions:
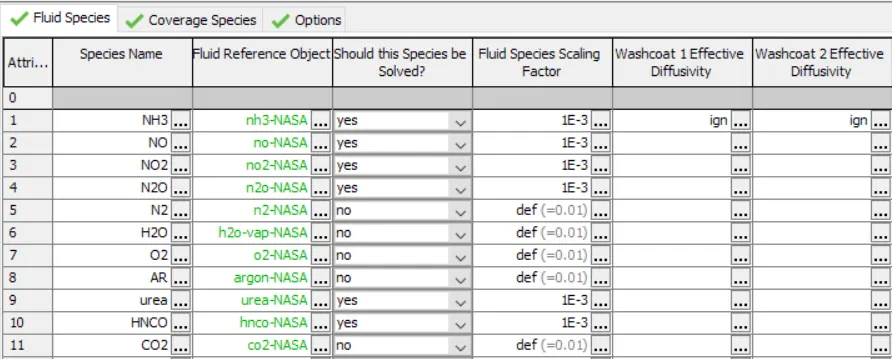
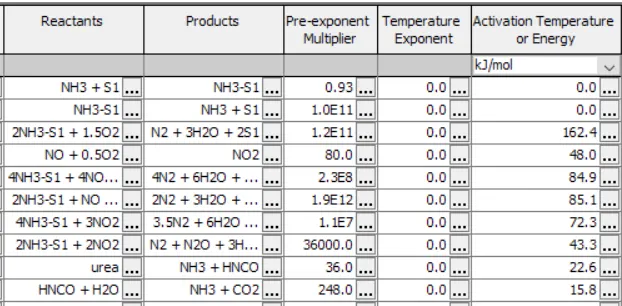
The considered species and reactions are shown below:
iii) Conversion Monitoring:
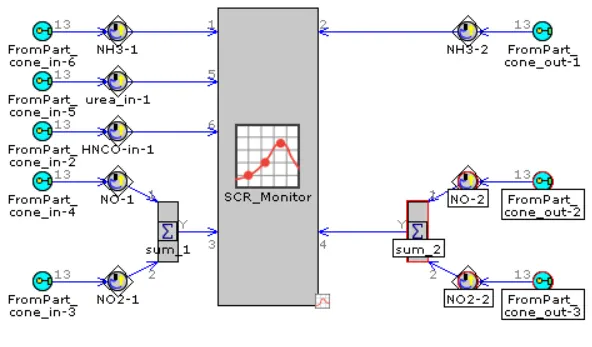
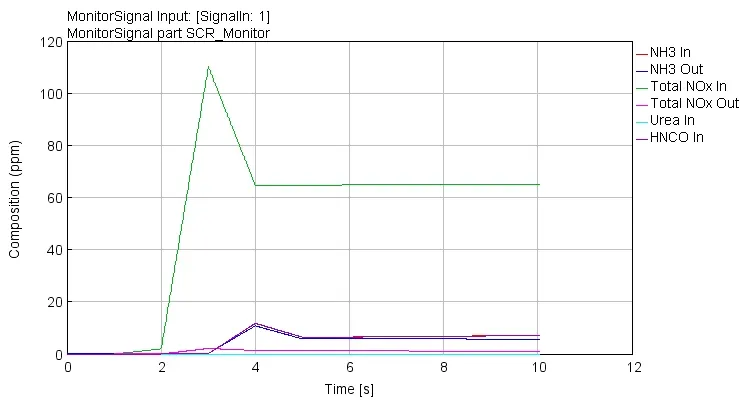
The conversion monitoring circuit is shown. The parameter monitored is ppm of NOx. In addition, ammonia levels and slip are also monitored.
E) GT - Controller:
To control and monitor the various signals and processes present in the engine, GT provides a controller which can access any signal in the system and control the same. In this project, there is basically a Receive Signal module, different parameter controllers and an Send Signal module as shown below. There are three important parameters that are controlled in this model. They are:
1) Compressor Boost pressure needed at increase the volumetric efficiency of air entering the engine;
ControllerTurboRack - Turbocharger VGT Rack Controller. This template is used to target various engine performance parameters in turbocharged applications. It functions as a targeting controller, analogous to the usage of a 'PID Controller', but without the inconvenience of finding good gains for every operating condition. At every timestep, it calculates the rack position based on several physical quantities of the engine and turbocharger system. This controller includes built-in overspeed control, in which it will keep the turbocharger from spinning higher than the maximum speed defined by the turbine or compressor maps.
2) EGR Valve Opening Control based on Engine speed and BMEP
ControllerEGRValve- This template contains a model-based controller used to target EGR rate by controlling throttle angle or an orifice diameter. This template is only designed to be used in Periodic simulations.
3) Fuel Injection timing control based on BMEP.
ControllerDInject - Injector Controller for Direct Injection. This template is used to target various engine performance parameters at part-load operation by adjusting the injected fuel quantity.
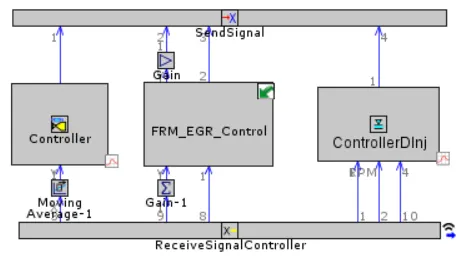
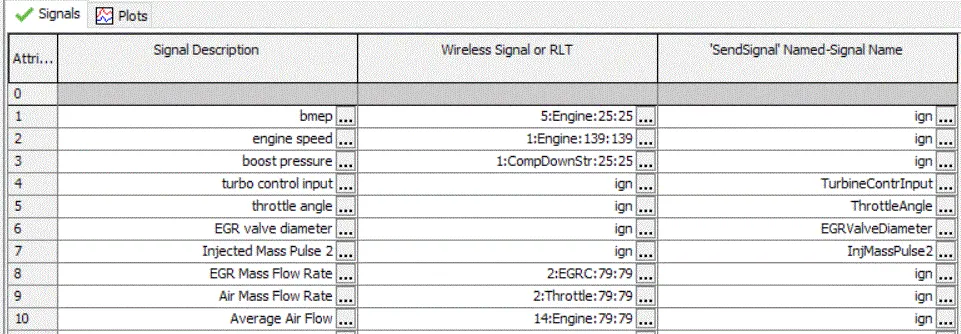
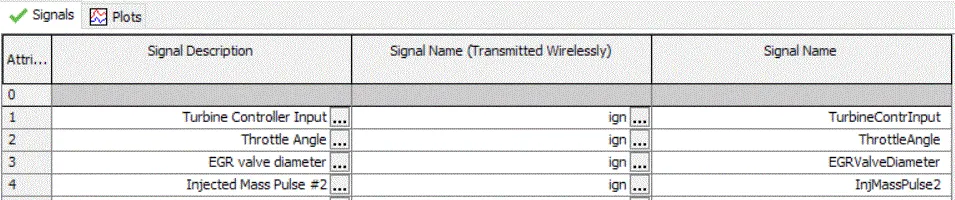
For controlling the parameters mentioned above, the controller receives signal from various parts of the engine and after control sends back the new signal. Instead of having different clusters of signals, GT Controller provides an option of having a single Receive and Send Signal module. It is shown below (Receive and Send respectively):
F) SIMULATION MODELS AND CALIBRATIONS:
a) Simulations Models and Optimizations in Turbocharger:
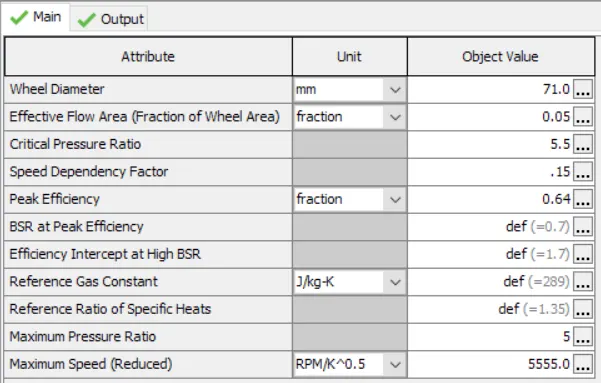
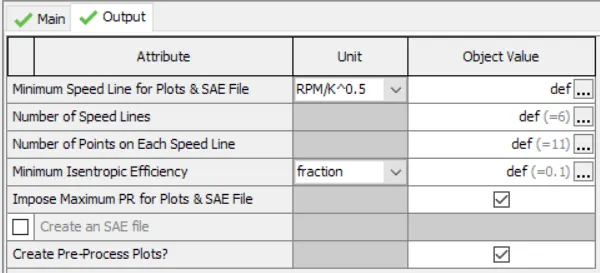
The wheel diameter of the compressor is 76.4 mm and that of the turbine is 71 mm. With these specs, a maximum pressure ratio of 5 is set as the limit with reference to the Initial pressure of 1 bar. The compressor map is shown at engine RPM of 2200 below. It can be found that the the operating point (Represented by Black Point) is close to the centre.
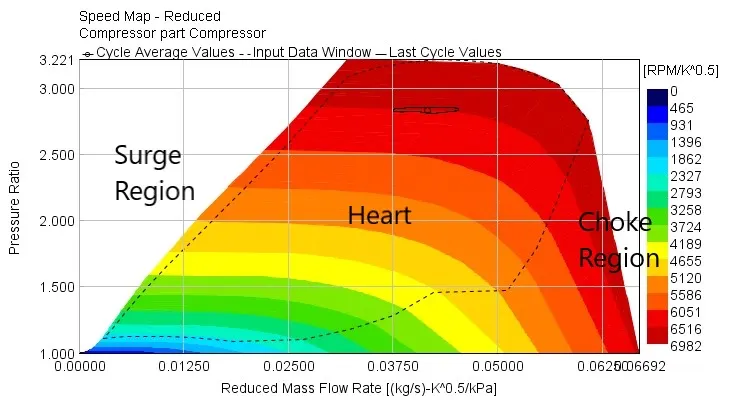
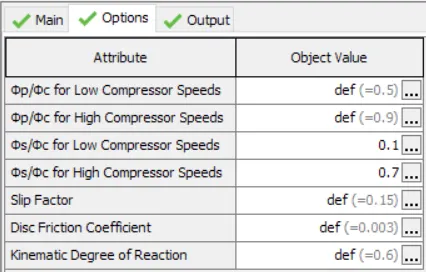
The compressor maps are calibrated such that the operating points are as close to the heart region of the map even at lower engine speeds.
a) The ratio of the flow coefficient at peak efficiency (for the given speed line) to the flow coefficient at choke for low compressor speeds. Increasing this value of this attribute will shift the choke line to lower flow rates for low compressor speeds. The value is set to "def” = 0.5
b) The ratio of the flow coefficient at peak efficiency (for the given speed line) to the flow coefficient at choke for high compressor speeds. Increasing this value of this attribute will shift the choke line to lower flow rates for high compressor speeds. The value is set to “def” = 0.9
c) The ratio of the flow coefficient at the surge line to the flow coefficient at choke for low compressor speeds. Increasing the value of this attribute will shift the surge line to higher flow rates for low compressor speeds. The value is set to 0.1
d) The ratio of the flow coefficient at the surge line to the flow coefficient at choke for low compressor speeds. Increasing the value of this attribute will shift the surge line to higher flow rates for high compressor speeds. The value is set to 0.7
No changes have been made to turbine settings. They are shown below.
b) Simulations Models and Optimizations in Engine:
i) Heat Transfer Model:
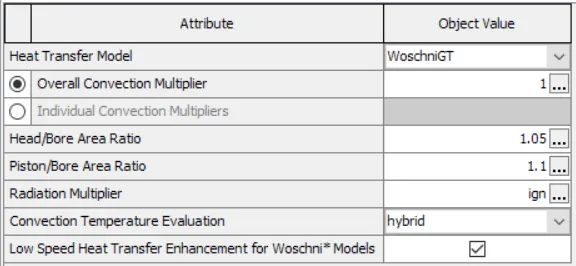
Wohchni GT has been chosen as the heat transfer model.
WoschniGT indicates that the in-cylinder heat transfer will be calculated by a formula which closely emulates the classical Woschni correlation without swirl. The most important difference lies in the treatment of heat transfer coefficients during the period when the valves are open, where the heat transfer is increased by inflow velocities through the intake valves and also by backflow through the exhaust valves. This option is recommended when measured swirl data is not available. The same is shown below.
ii) Flow Model:
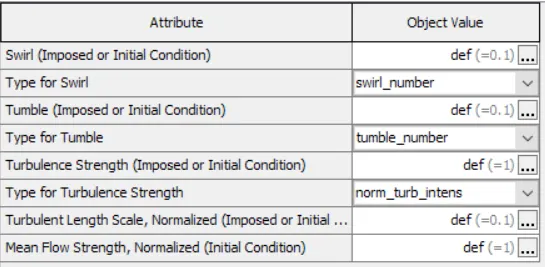
This template calculates the swirl, tumble, and turbulence.
Since there is no data available on siwrl and tumble pattern, these turbulences are ignored in this project. The flow model has been setup accordingly. Swirl and Tumble have been set as 'def' i.e. 0.1 which represents the Initial swirl number and tumble as 0.1
iii) Combustion Model:
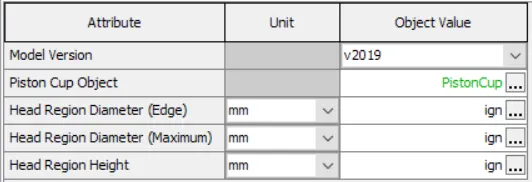
The model used is 'EngCylCombDIPulse' - Direct-Injection Diesel Multi-Pulse Combustion Model. This combustion model predicts the combustion rate and associated emissions for direct-injection diesel engines with single and multi-pulse injection events.
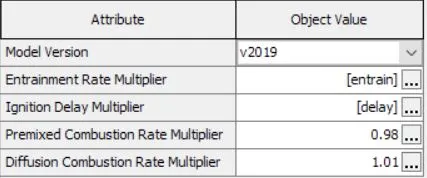
The cylinder contents are discretized into three thermodynamic zones, each with their own temperature and composition. The main unburned zone contains all cylinder mass at IVC, the spray unburned zone contains injected fuel and entrained gas, and the spray burned zone contains combustion products. The DIPulse model also includes several submodels which simulate the relevant physical processes taking place during injection and combustion. There are four attributes which should be used for calibration.
Fuel Injection – Each contiguous injection event is defined as an injection pulse and is tracked separately from all other pulses. Any number of pulses may be injected, and there is no inherent distinction made between pilot, main, or post injection pulses. The injected fuel is added to the spray unburned zone.
Entrainment – As the spray penetrates, it slows down as the surrounding unburned and burned gases are entrained into the pulse. The intermixing of pulses occurs through entrainment. The entrainment rate is determined by applying conservation of momentum and can be modified by the Entrainment Rate Multiplier.
Evaporation – Droplet evaporation is modeled with a coupled solution of heat and mass transfer which appropriately accounts for both diffusion-limited and boiling-limited evaporation
Ignition – The mixture in each pulse undergoes an ignition delay modeled with an Arrhenius expression which can be modified by the Ignition Delay Multiplier (Cign). The ignition delay is calculated separately for each pulse based on the conditions within the pulse, and accounts for entrainment and evaporation within the pulse as well as pulse-to-pulse interactions.
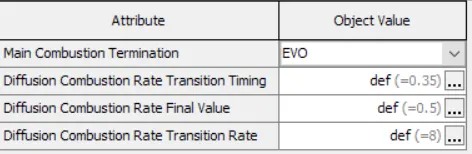
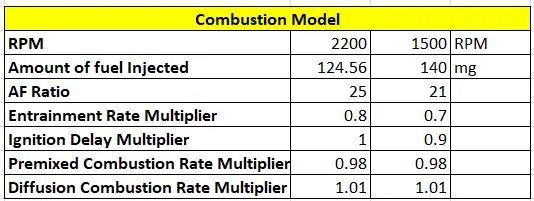
The values of these attributes which are entered in the model is shown. The values that are entered have been obtained after a series of trial and errors based on the tradeoff between the target performance that is required to be met and the emission criteria. The termination of combustion is set to EVO (Exhaust Valve Open) which indicates that combustion calculations will end at Exhaust Valve Opening (EVO).
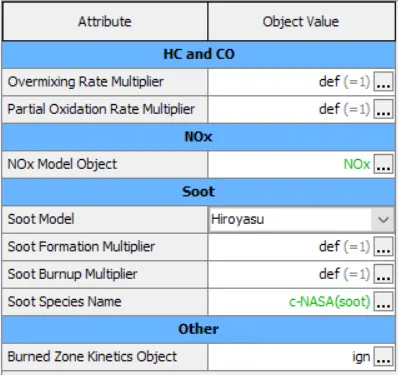
After entering the combustion multipliers, the emissions models have also been enabled to capture realistic emissions values.
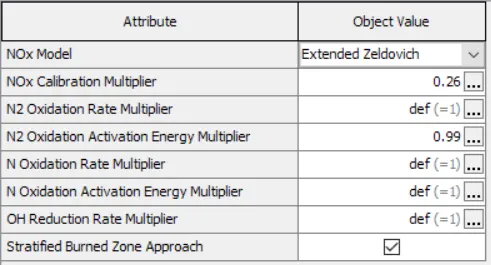
The NOx template used is EngCylNOx - NOx Model for Combustion. This template may be used to predict the formation of NO during combustion. The results of this template are very sensitive to the equivalence ratio (availability of oxygen) and temperature. The NOx model chosen is Extended Zeldovich which indicates that extended Zeldovich mechanism will be used to model the total NOx in the cylinder. Other multipliers have been set to default values.
The soot model selected is Hiroyasu Soot which uses a Two step formation/oxidation model proposed by Hiroyasu and Kodota. The Soot multipliers are set to 1.
Optimizations in Combustion Model:
The DI-Pulse contains the four multipliers namely Entrainment, Ingition delay, Premixed Combustion rate and Diffusion Combustion rate. There is always a tradeoff between the emissions and the obtained BSFC. At lower RPM's and at Intermediate speed of engine, the emissions is at a higher scale due to richer mixture with AF ratio of ~21. Hence to reduce emissions and maintain BSFC at lower RPM's the combustion model is optimized by slightly decreasing the Entrainment and Ignition delay multipliers as shown. The reduction in the entrainment and delay time will be utilized in the combustion and hence concentration of burnt fuel increases.
iv) Engine Friction Model:
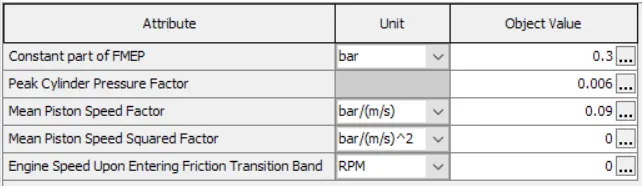
The model used is 'EngFrictionCF' - Chen-Flynn Engine Friction Model. This object defines the Chen-Flynn engine friction model described in the Engine Performance Manual. The engine friction is calculated using the attributes as follows:
`FMEP = FMEPunderset(const)() + A*Punderset(cyl,max)() + B*cunderset(p,m)() + C*cunderset(p,m^2)()`
where,
`FMEPunderset(const)()` is Constant Part of FMEP [bar]
A = Peak Cylinder Pressure Factor [-]
B = Mean Piston Speed Factor [bar s/m]
C = Mean Piston Speed Squared Factor [bar s2/m2]
cp,m = Mean Piston Speed [m/s]
PCyl,max = Maximum Cylinder Pressure [bar]
c) Optimizations in After-treatment systems:
In after-treatment systems one of the main design considerations is the geometrical size of the catalyst reactors. In this project, the size of the AFT's are determined through trial and errors.
i) Optimizations in DOC:
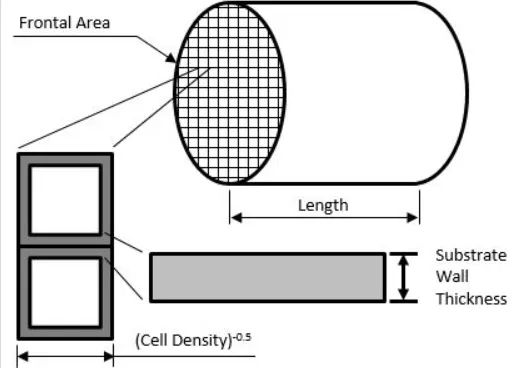
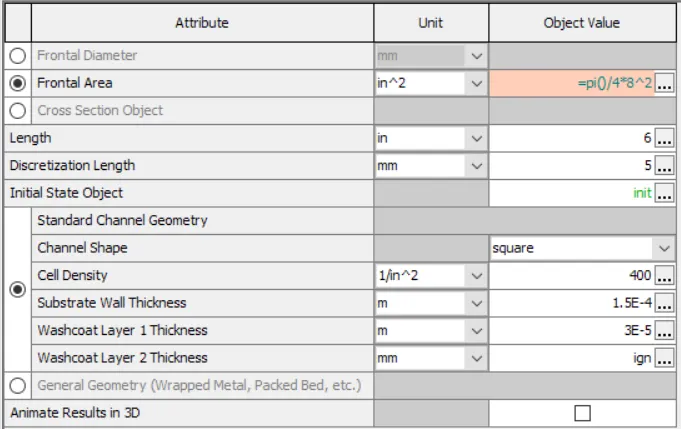
The main geometrical considerations of components with flow over catalyst surface is the length, frontal area (or) diameter and the channel shape. A method of Trial and Error is adopted to arrive at the optimal geometry of the Catalyst Brick. Shown below is the various emission levels and performance wrt different diameters and lengths of the catalyst brick. Initially, the length of the DOC channel is determined as emissions are lesser sensitive to length than compared to diameter. Keeping the length fixed, the diameter is varied and the final value is arrived at.
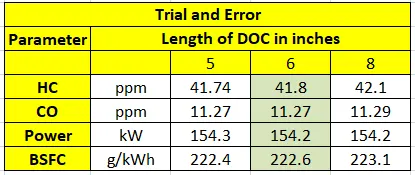
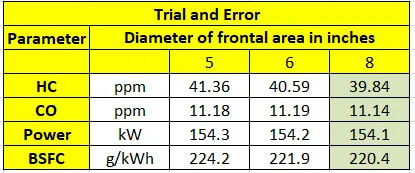
The selected geometry is highlighted in olive color. The relative change in the values of emissions is less with change in the length of the DOC channel as well as any length below this dimension seems unrealistic. Hence, a length of 6 inches is selected. Keeping the length fixed, if the diameter is increased to 8 inches, the CO and HC emissons decrease to a better result. Since the application of this engine is commercial vehicle, assuming space constraint is relatively lesser than passenger vehicles, diameter of DOC is selected as 8 inches.
The channel shape is selected as square section. The other parameters such as channel shape, cell density and substrate wall thinkness are kept as per the default values as accurate data is not available on the variation of emissions on those parameters.
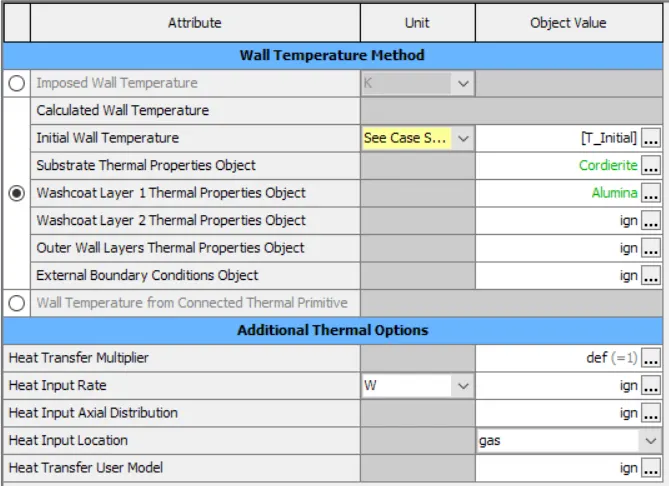
Channel shape is a square with cell density of 400 cells per square inch with a substrate wall thickness of 1.5E-4 m with a washcoat thinkness of 3E-5 m. The substrate material is Cordierite which has a thermal conductivity of 1.5 W/m-K and the washcoat material is Alumina with a thermal conductivity of 8 W/m-K.
ii) Optimizations in SCR:
A method of Trial and Error is adopted to arrive at the optimal geometry of the SCR Brick. Shown below is the various emission levels and performance wrt different diameters and lengths of the catalyst brick at rated speed of engine. First the length of the SCR channel is determined as emissions are lesser sensitive to length than compared to diameter. Keeping the length fixed, the diameter is varied and the final value is arrived at.
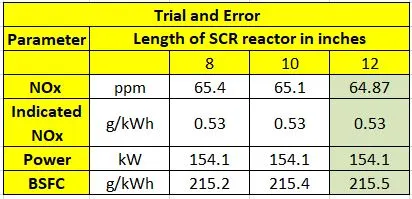
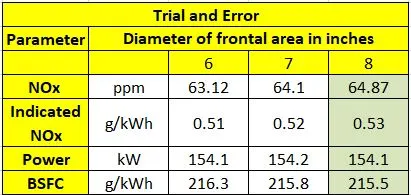
From the results, with respect to length of channel, a length of 12 inches is chosen as it gives a lesser value of NOx for almost the same power and BSFC. Keeping the lentgh fixed, a diameter of 6 inches gives least NOx emissons but the fuel efficieny is relatively lesser. A diameter of 8 inches is ideal as BSFC decreases by 1 g/kWh for a change of 1.7 ppm of NOx.
The channel shape is selected as square section. The other parameters such as channel shape, cell density and substrate wall thinkness are kept as per the default values as accurate data is not available on the variation of emissions on those parameters.
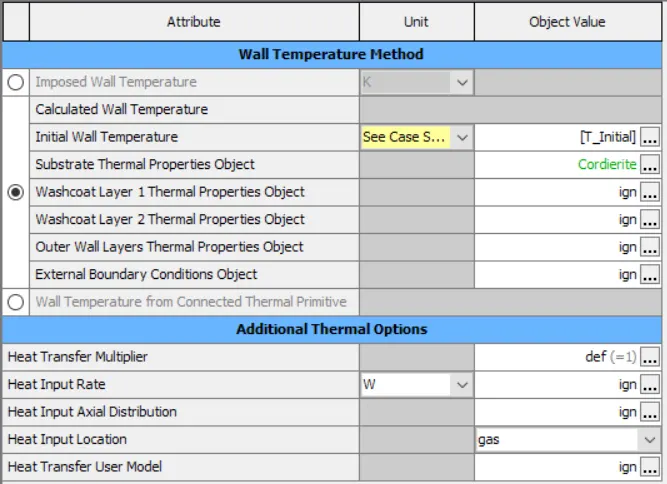
Channel shape is a square with cell density of 400 cells per square inch with a substrate wall thickness of 0.006 inch. The substrate material is Cordierite which has a thermal conductivity of 1.5 W/m-K.
iii) Optimizations in DPF:
The working diameters of both DOC and SCR have turned out to be 8 inches. Hence to maintain a constant flow velocity in the system, a diameter of 8 has been chosen in the DPF system as well. As of the moment, the engine is producing only a low amount of soot and hence this diameter change will prove more effective to capture more soot and PM.

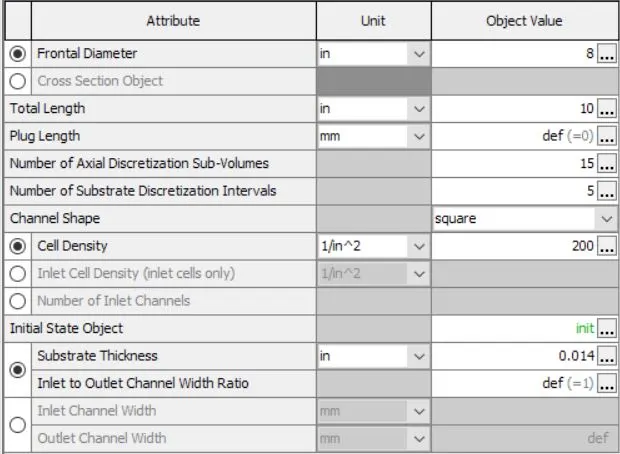
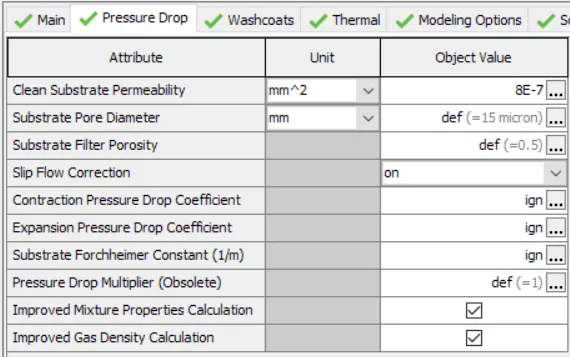
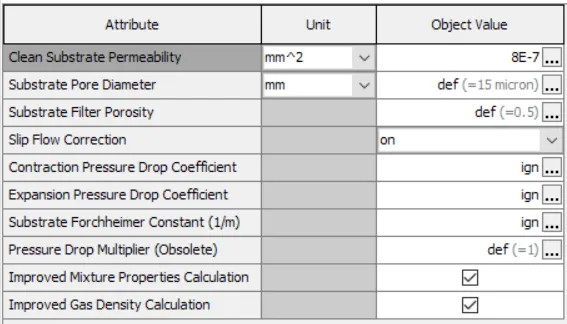
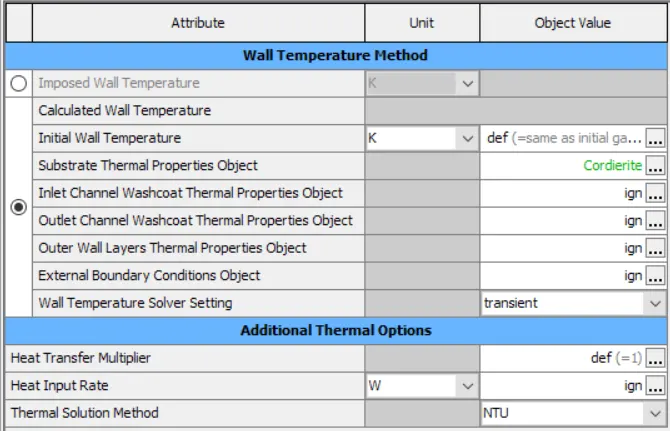
The specifications of the DPF are shown below. The frontal diameter is 8 inches and the total length of the channel is 10 inches. The channel shape is a square section with a cell density of 200 cells per square inch. The clean substrate permeability is 8E-7 square mm which is the permeability factor for a clean filter. This is used to calculate the pressure drop through a clean filter that can be used as a reference. The substrate material is Cordierite which has a thermal conductivity of 1.5 W/m-K.
G) CASE SETUP OF THE SIMULATION:
BMEP Calculation for Max Power and Max Torque Cases:
BMEP is given by Brake Mean Effective Pressure = ( n * t * 2 * 3.14 ) / d
Where,
n = No of Revolutions per Power Stroke
t = Torque
d = Displacement
And,
n = 1 (For Two Stroke Engine)
n = 2 (For Four Stroke Engine)
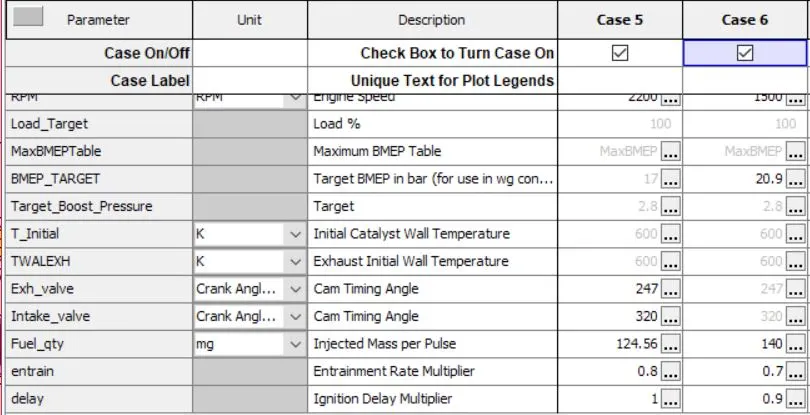
For the max Torque of 825 Nm, at 1500 RPM, the BMEP = (2*825*2*3.14)/0.004951 = ~20.9 bar
At the max Power condition, the obtained torque is 669.3 Nm, at 2200 RPM. The BMEP = (2*669.3*2*3.14)/0.004951 = ~17 bar
The simulation is run at Rated Speed [RPM=2200] and Intermediate Speed [RPM=1500]. The case setup is shown below.
H) RESULTS AND OUTPUTS:
a) RLT Pressure Plots at Rated Speed:
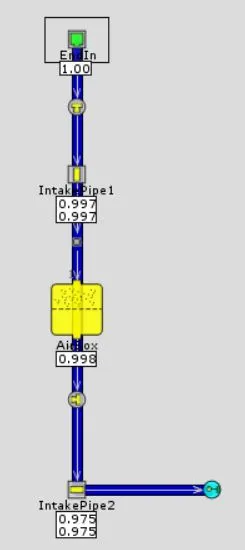
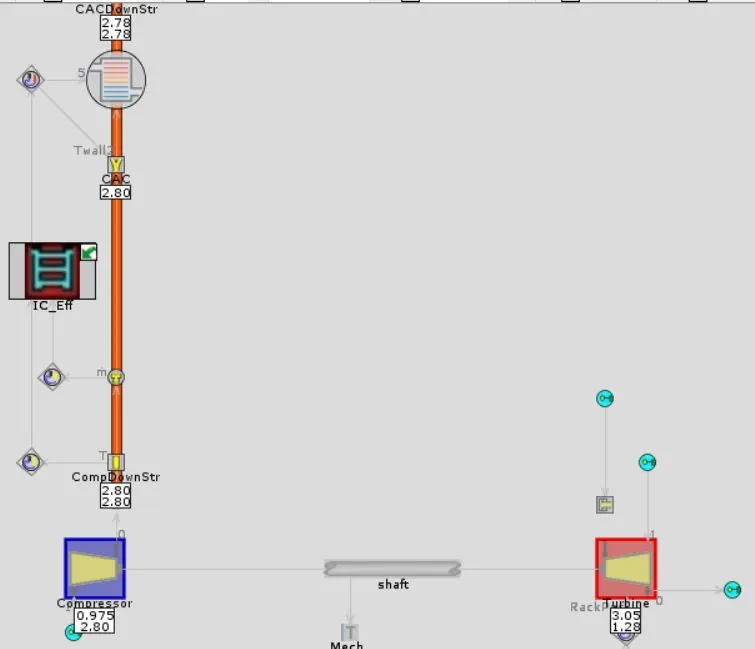
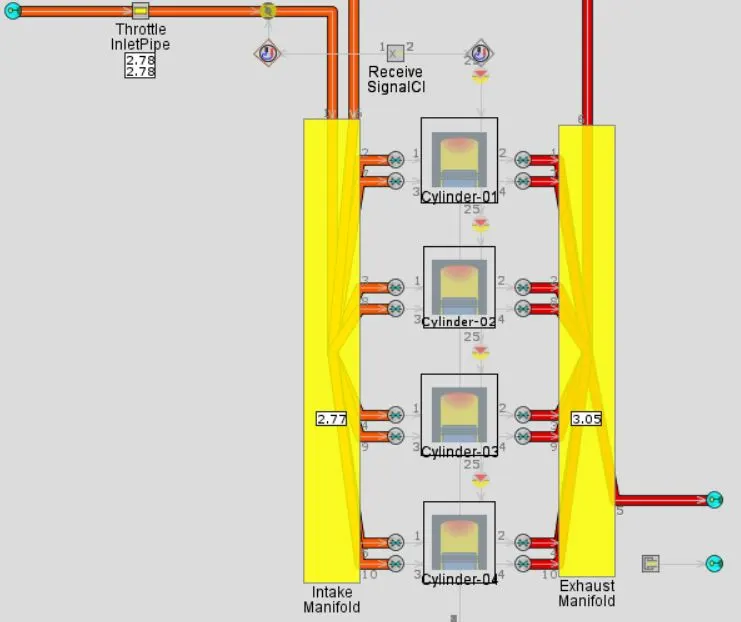
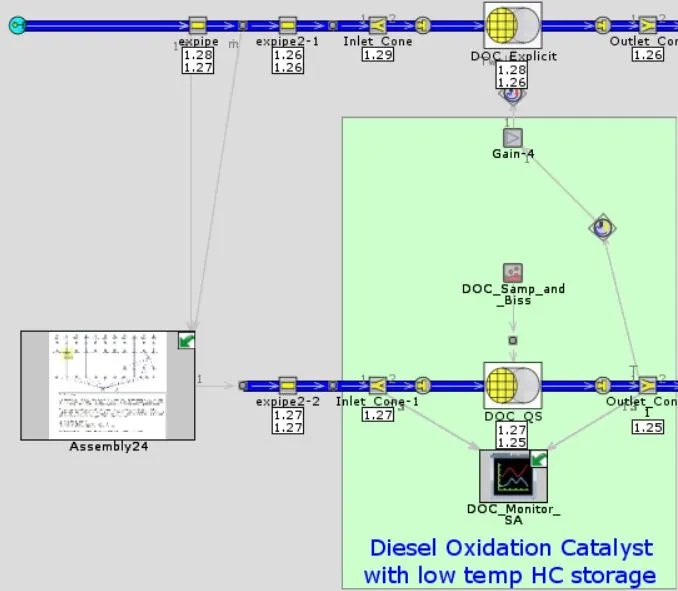
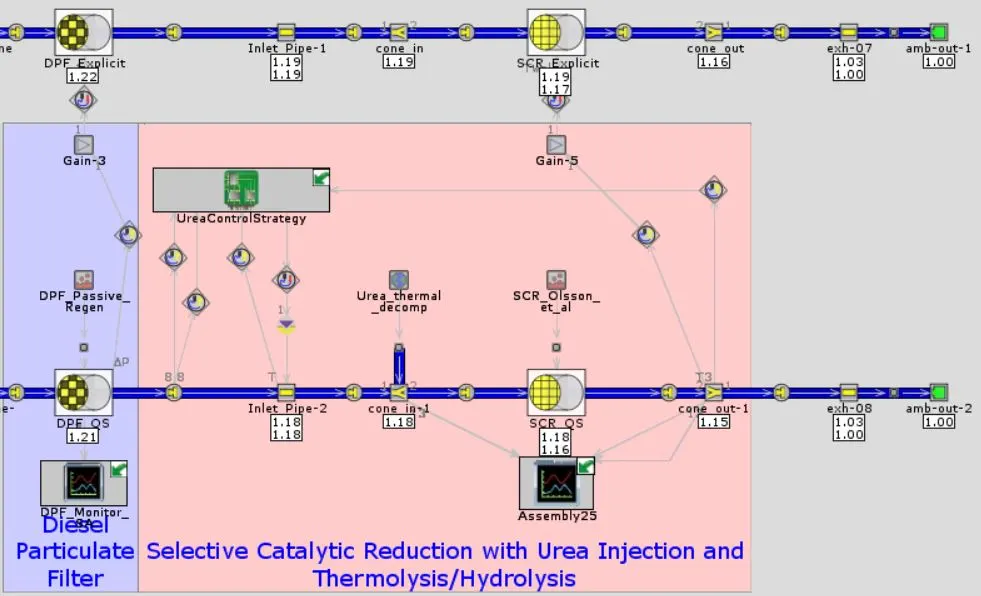
The pressure values are around ambient values in the Intake. The air is then compressed due to which pressure increases. The turbine receives high temperature and high pressure exhaust gases and hence is at higher temperatures. The turbine does work to rotate the turboshaft and hence loses some pressure. After compression, air passes to the Intake manifold, cylinder and then exhaust system. Due to combustion, the pressure inreases inside the cylinder. If the EGR system is activated, the pressure decreases in the direction of the EGR process and air is back to the cylinder. Shown below are pressures in bar of every component in this engine model.
Pressure drop across Intake and Turbo sub-system:
Pressure drop across Main Engine sub-system:
Pressure drop across Exhaust sub-system (part-1):
Pressure drop across Exhaust sub-system (part-2):
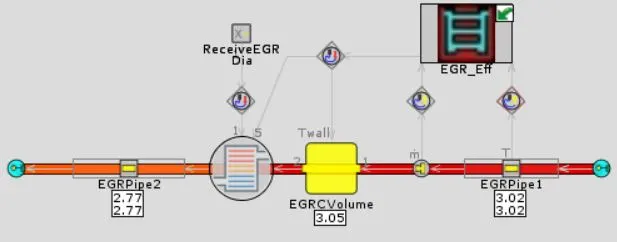
Pressure drop across EGR:
b) RLT Temperature Plots at Rated Speed:
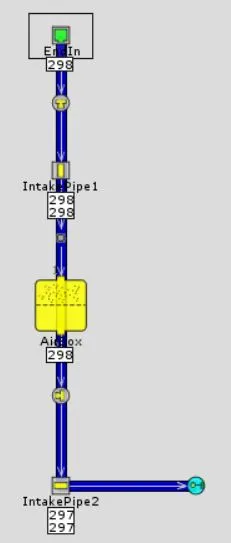
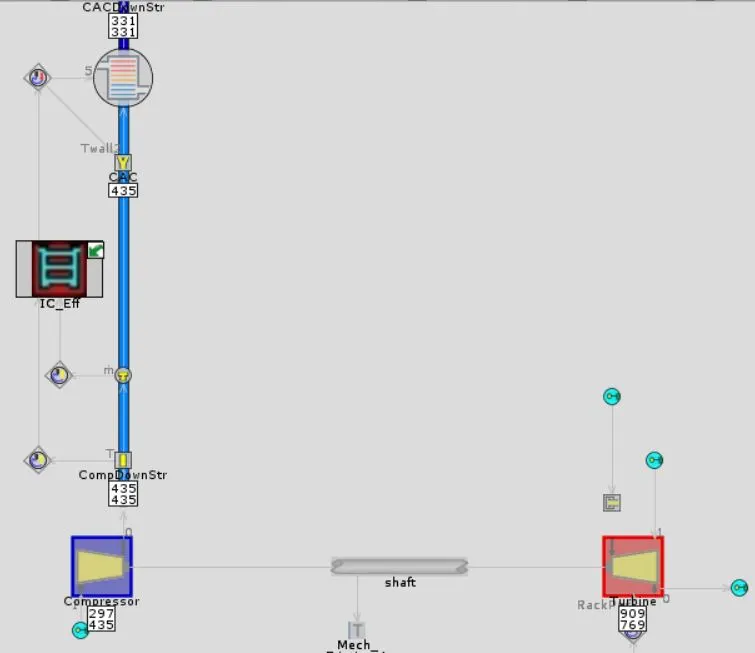
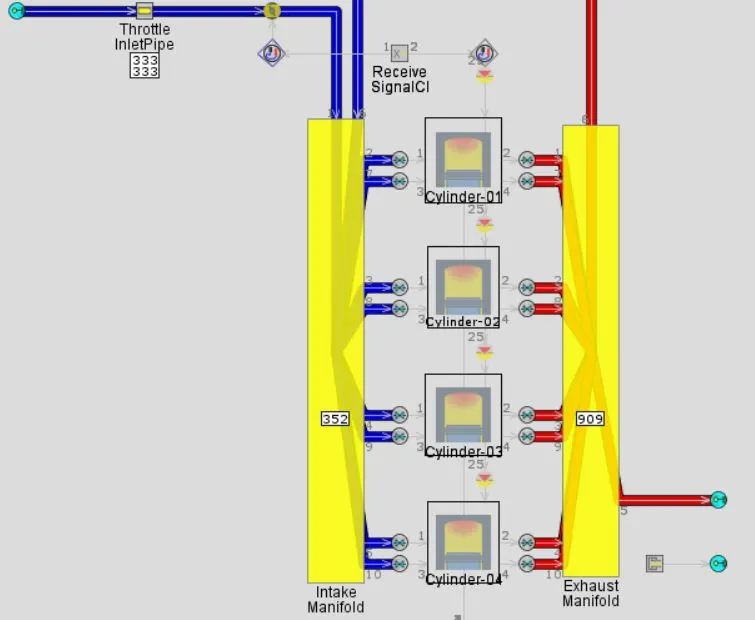
The temperature values are around ambient temperature in the Intake. The air is then compressed due to which the temperature increases. The turbine receives high temperature exhaust and hence is at higher temperatures. Part of this high temperature is lost after the turbine does work to rotate the turboshaft. After compression, air passes to the Intake manifold, cylinder and then exhaust system. If the EGR system is activated, the temperature decreases in the direction of the EGR process due to cooling and air is back to the cylinder. Shown below are temperatures in Kelvin of every component in this engine model.
Temperature drop across Intake and Turbo sub-system:
Temperature drop across Main Engine sub-system:
Temperature drop across Exhaust sub-system (part-1):
Temperature drop across Exhaust sub-system (part-2):
Temperature drop across EGR:
c) BS6 Emission Levels:
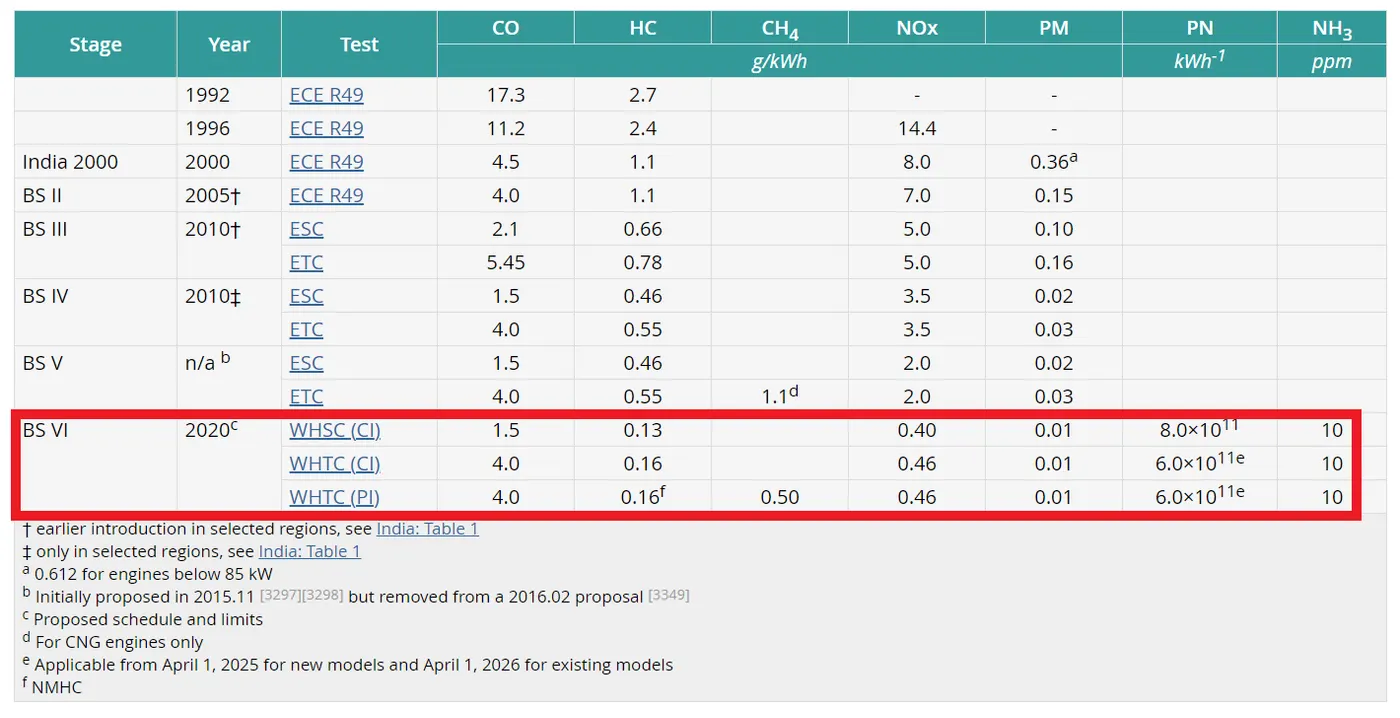
The emission levels of BS6 are listed below. Allowed levels are:
- 1.5 g/kWh of CO
- 0.13 g/kWh of HC
- 0.40 g/kWh of NOx
- 0.01 g/kWh of PM
- 10 ppm of NH3
The emission levels of BS4 are listed:
- 1.5 g/kWh of CO
- 0.46 g/kWh of HC
- 3.5 g/kWh of NOx
- 0.03 g/kWh of PM
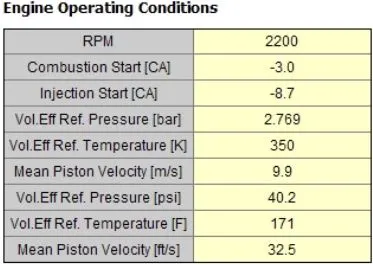
d) Performance and Emissions at Rated speed of 2200 RPM:
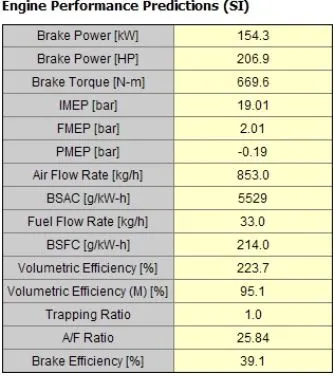
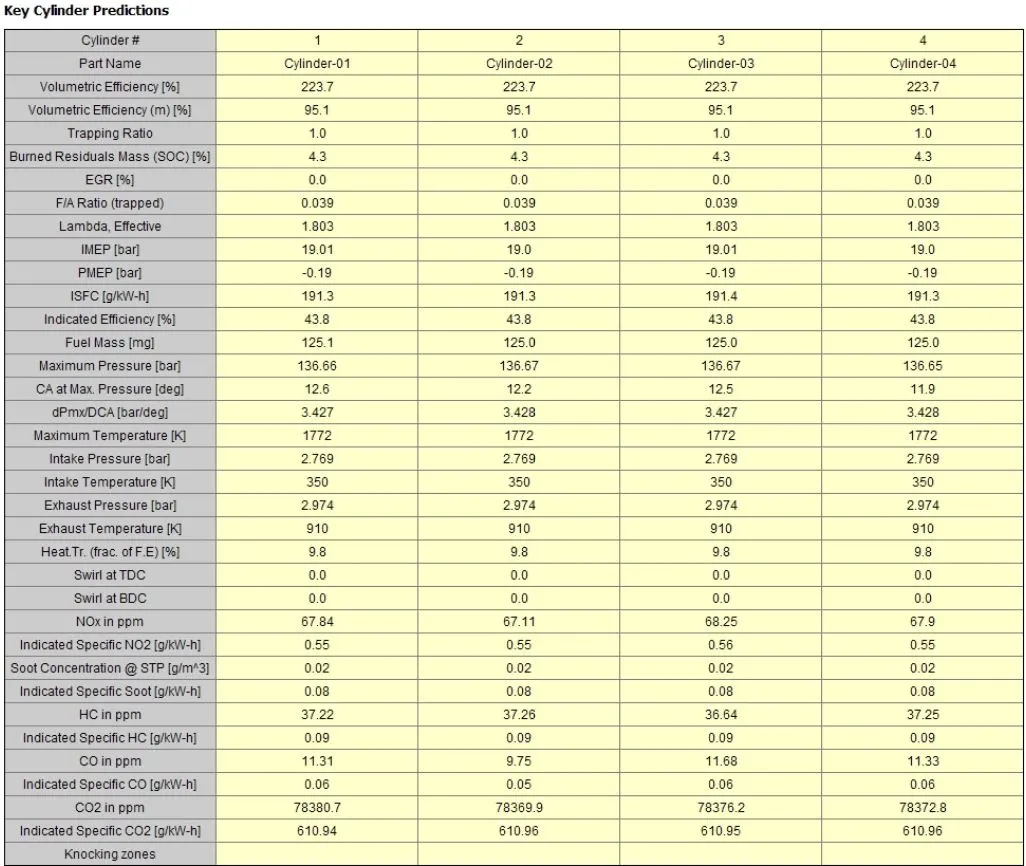
Shown below is the performance of the Engine at rated speed of 2200 RPM.
The errors of the achieved performance wrt given targets are shown below. The inference obtained from the results are listed as well:

- At the rated speed, the engine achieves a max power of 154.3 kW compared to the target value of 156.6 kW with an error percent of -1.46
- The torque obtained at rated speed is 669.6 Nm compared to target value of 669.6 Nm with an error percent of -0.01
- The air-fuel ratio achieved is 25.84 compared to the target value of 25 with an error percenatge of 3.36
- Finally, the engine is fuel efficient as the BSFC obtained is 214 g/kWh compared to the target value of 210 g/kWh with an error percent of 1.90
- The NO2 emission obtained is 0.55 g/kWh compared to target of 0.40 g/kWh with an error percent of 37.5
- The HC emission obtained is 0.09 g/kWh compared to target of 0.13 g/kWh with an error percent of -30.76
- The CO emission obtained is 0.06 g/kWh compared to target of 1.5 g/kWh with an error percent of -96
- The obtained performance is quite good and obtained emissions are lower than the specified BS6 limits except for NOx. The NOx emissions are on higher side due to a highly possible fact that, turbulence in cylinder is completely ignored due to lack of data. This can affect the emission values obtained by a great deal.
Other important outputs are mentioned below:
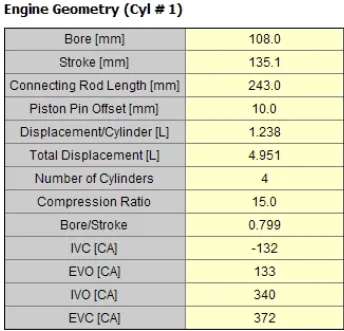
- Bore: 108mm, Stroke: 135mm, Bore/Stroke Ratio: 0.8, Connecting Rod Length: 243mm, Piston Pin offset: 10mm, Compression Ratio: 15, Total Displacement: 4.951 L.
- IVC: -132 CA, EVO: 133 CA, IVO: 340 CA, EVC: 372 CA
- The IMEP is 19 bar and FMEP is -2 bar. Hence BMEP is 17 bar.
- The mean piston speed is 9.906 m/s
- The Mechanical Efficiency (or) Brake Efficiency obtained is 39.1 %
- The fuel flow rate is 33.0 kg/hr and air flow rate is 853 kg/hr. Taking the ratio of these quantities gives air fuel ratio of 25.8
- The volumetric efficiency wrt to TC is 223.7 % and volumetric efficiency of manifold is 95.1 %
- The heat transfer % is 9.8. The low value maybe due to the lack of turbulence in cylinder.
Performance at Altitude of 1000m above sea level:
Given, the engine is developed for commercial application, the performance and emissions are also recorded at Rated soeed [RPM = 2200] for an altitude of 1000 m above sea level. Shown below are the results:
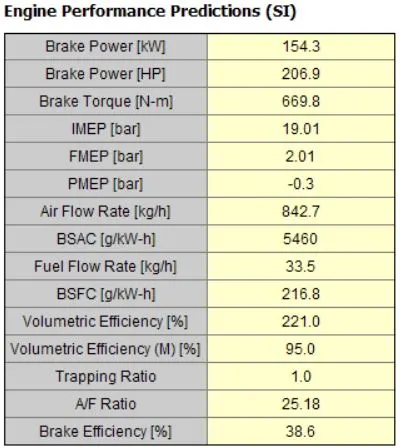
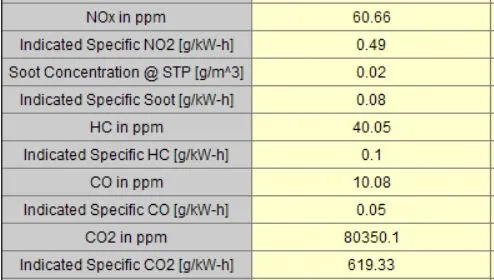
From the results, it can be understood that, the engine tries to maintain the same power and torque at the expense of fuel efficiency. The BSFC has increased from 214 g/kWh to 216.8 g/kWh by a percentage of 1.3. The air-fuel ratio has reduced from 25.84 to 25.18 by a percentage value of 2.5. There is a reduction in Brake efficiency by 1.2%
There is a decrease in NOx as there is a decrease in oxygen content with increase in altitude by 10.58 %. There is an increase in HC emissions by a percentage of 11.1 due to the fact that there is a higher possibility of incomplete combustion. There is a reduction in CO emissions by 16.6%. The soot concentration produces remains same.
e) Performance Plots at Rated speed:
i) Pressure vs CA
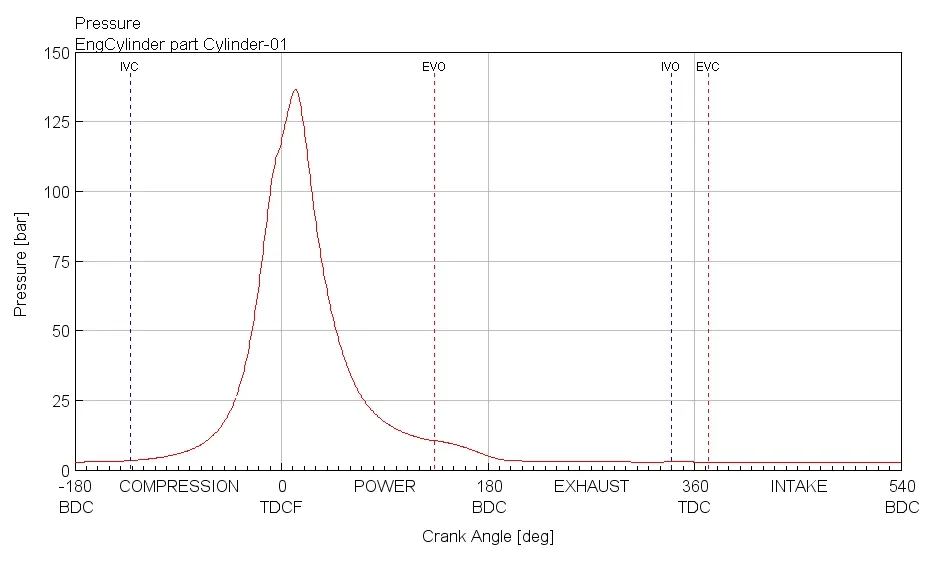
Max Pressure of 136.04 bar is reached at +12.04 CA from TDCF. The max pressure occurs just after TDC, so that no power that is generated by combustions gets wasted.
ii) Pressure Volume Diagram:
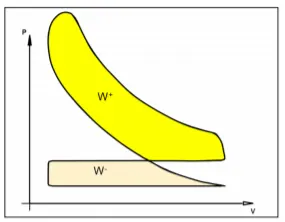
This plot can be used to calculate the total work done by the engine. The compression ratio can be estimated as well.
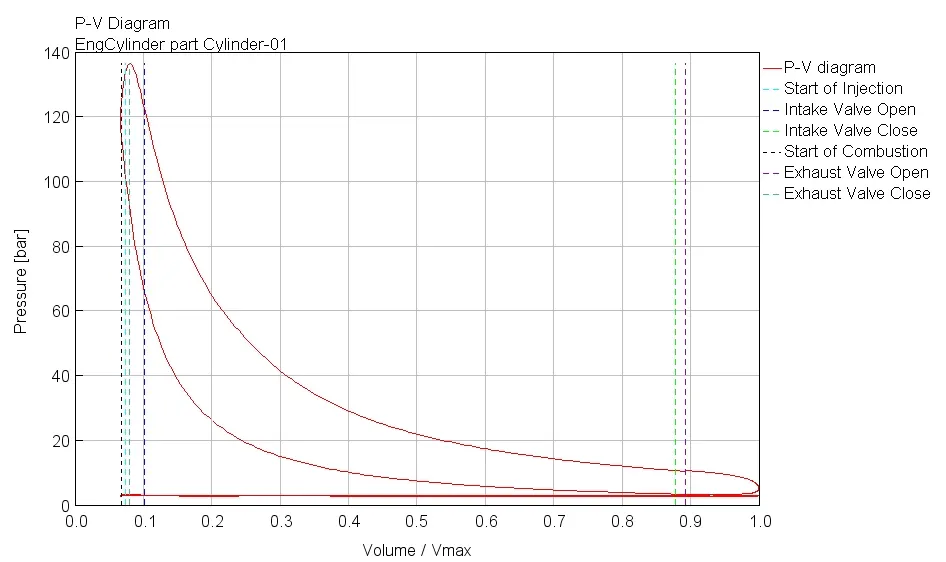
With reference of the representative diagram shown below, the Gross IMEP is defined as the area W+ and the IMEP that gets consumed is defined as area W-; The gross IMEP is defined as the difference between the two areas: (W+) - (W-). The same method can be used to calculate the gross IMEP from the PV plot. Since the exact data points are not available, the calculation has not been done.
iii) Temperature vs CA:
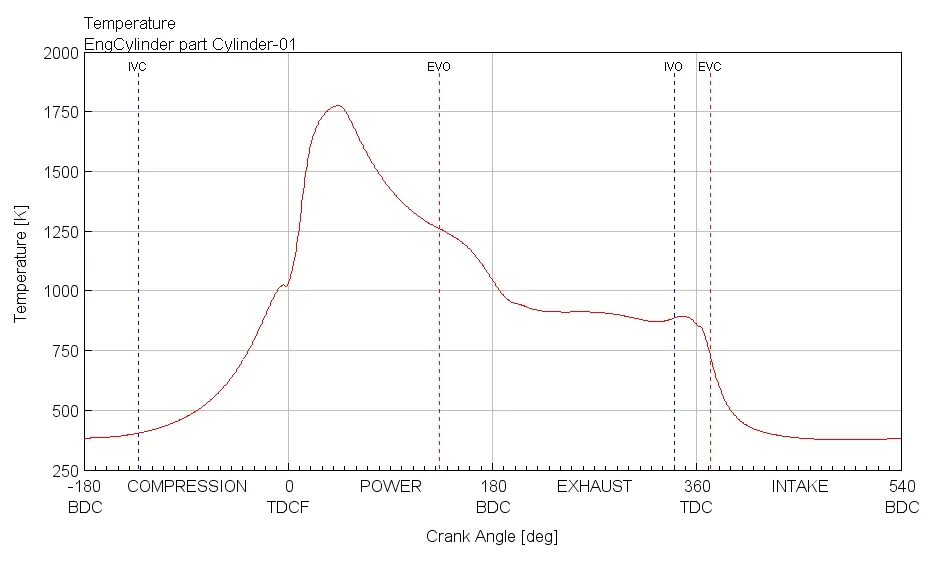
A max temperature of 1775 K is attained at +44 CA from TDCF.
iv) Pumping Loop:
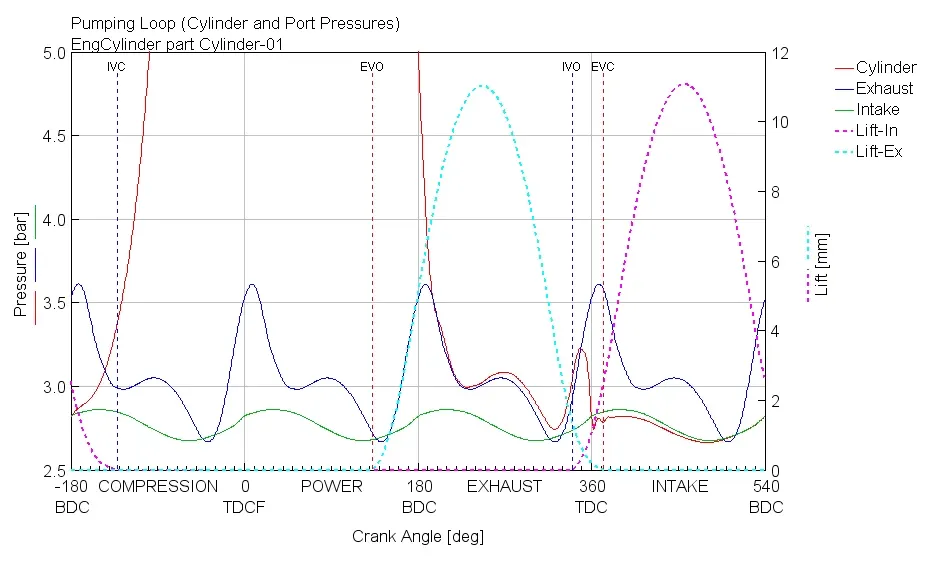
The pressure in the cylinder at during opening and closing of the valves are shown below. The cylinder pressure reduces drastically as the exhaust valve opens. The plot also shows the small time interval of valve overlap at the gas exchange TDC.
v) Mass flow rate through Valves:
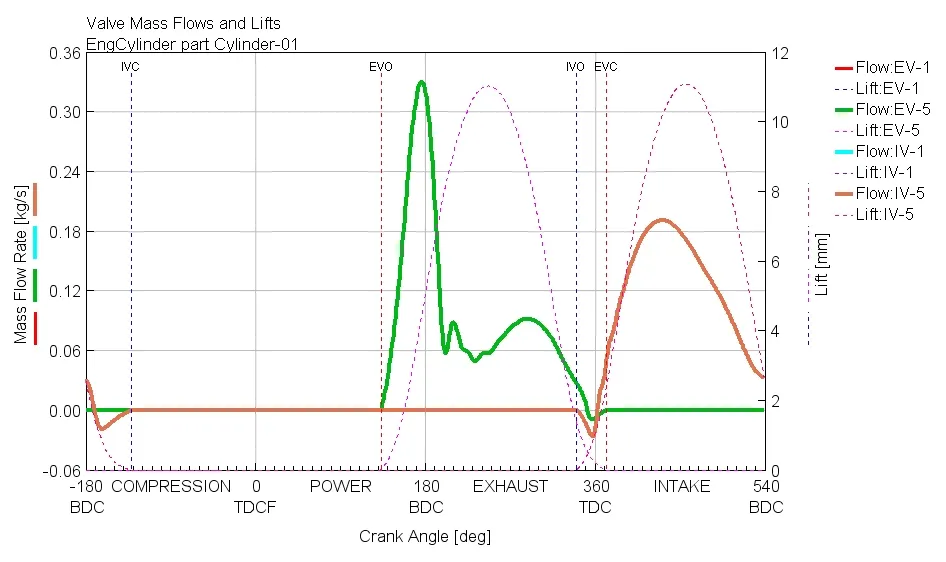
The exhaust air is discharged at two intervals. The maximum mass flow rate of exhaust occurs before the max lift of Exhaust valve and a second peak occurs before EVC. A small time interval of valve overlap happens near gas exchange TDC and a backflow occurs in the cylinder during this interval.
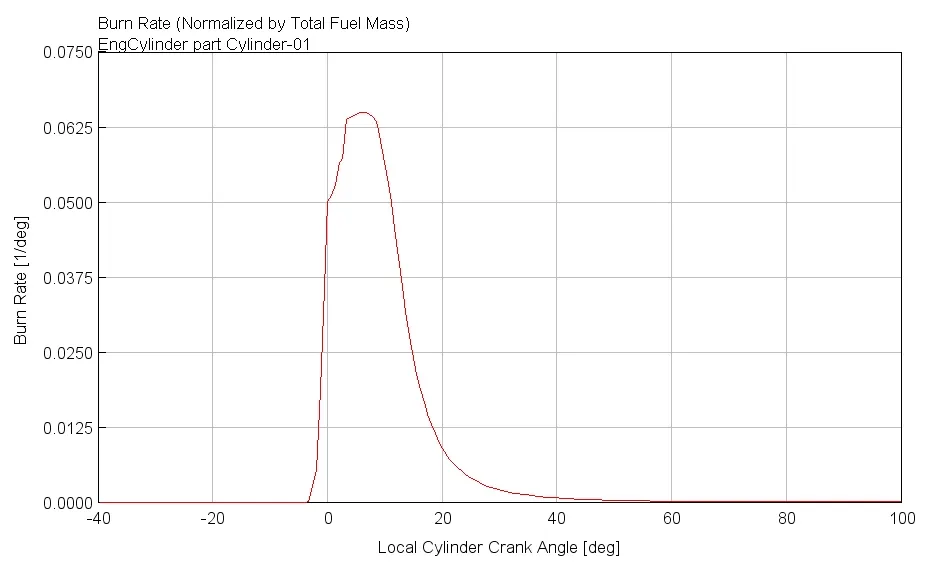
vi) Normalized Burn rate:
The obtained burn rate from DI-Pulse Combustion model.
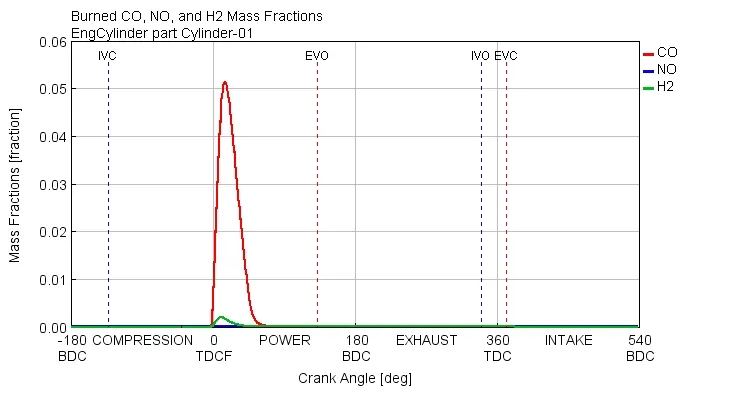
vii) Burned+Unburned CO, NO, and H2 Mass fractions:
The CO mass fraction is around 0.0509, that of NO is 2.9E-6 and that of H2 is around 0.0019
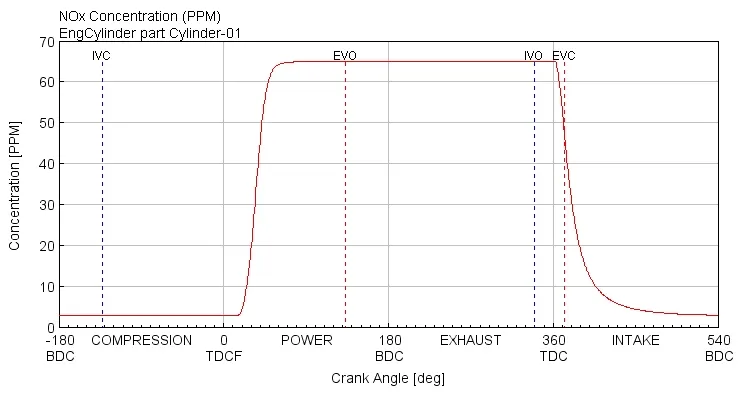
viii) NOx generated:
The max NOx concentration produced is around 67.8 ppm.
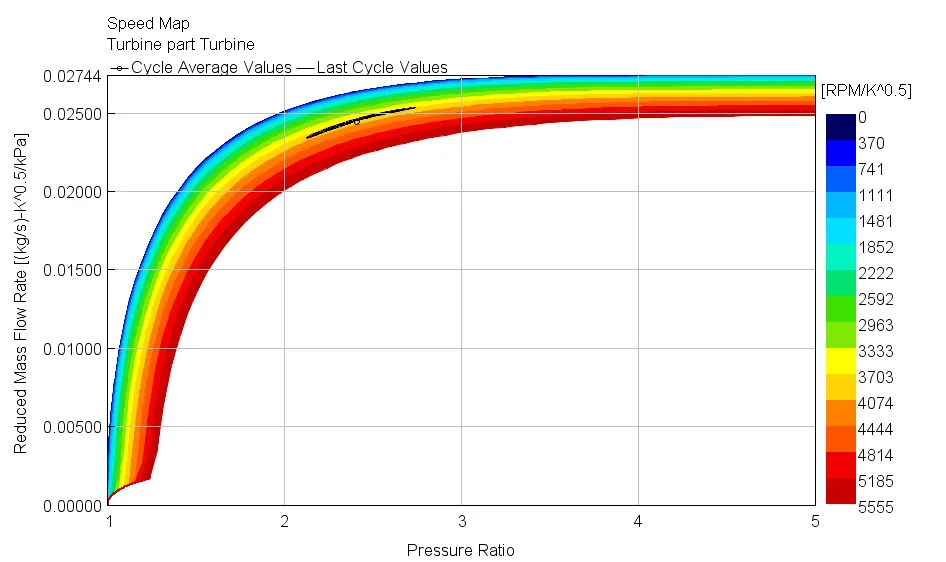
ix) Turbine Speed Map with Operating Point:
At the operating point, the pressure ratio is 2.4, reduced mass flow rate is 0.0244 kg/sec-K^0.5/kPa and ~3333 RPM/K^0.5
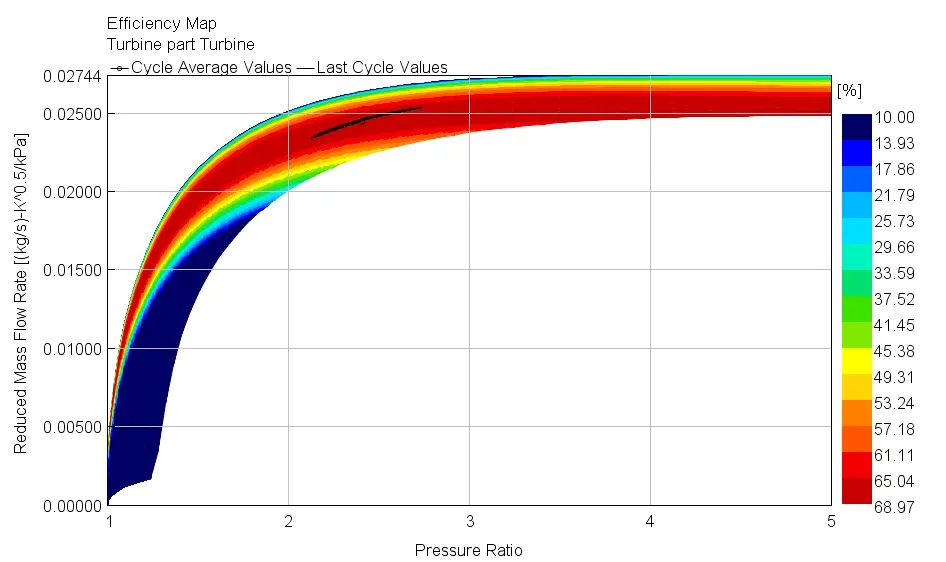
x) Turbine Efficiency Map with Operating Point:
At the operating point, the efficiency is ~67 %
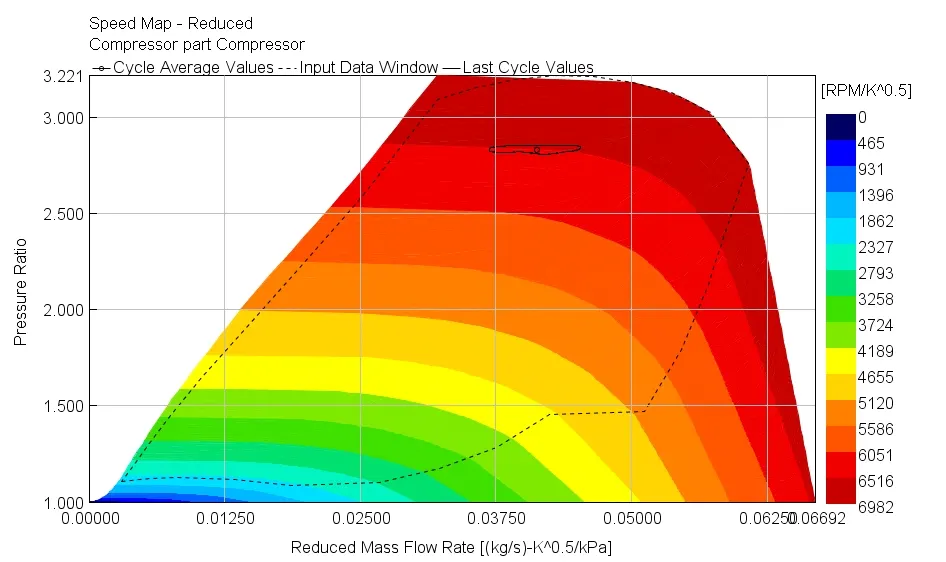
xi) Compressor Speed Map with Operating Point:
At the operating point, the pressure ratio is 2.8, reduced mass flow rate is 0.0411 kg/sec-K^0.5/kPa and ~6500 RPM/K^0.5
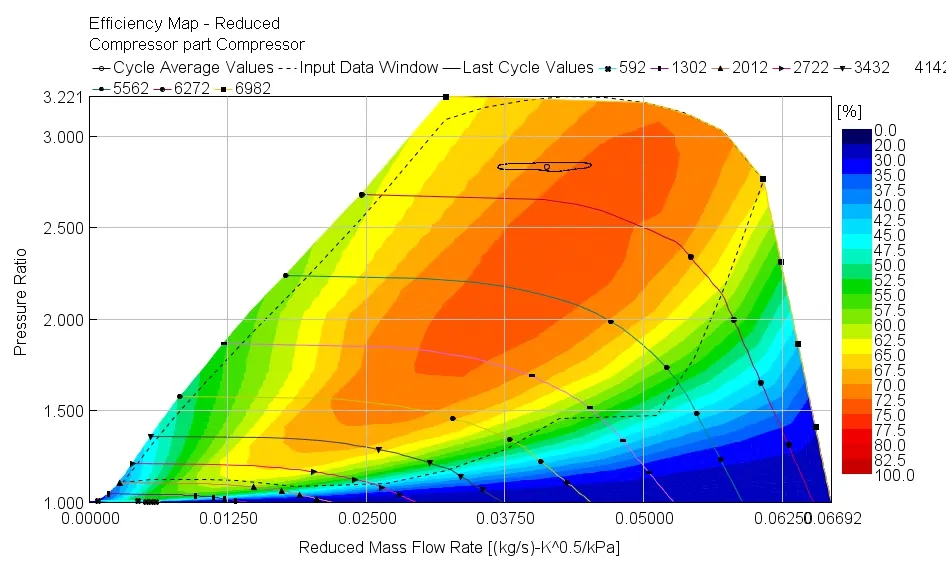
xii) Compressor Efficiency Map with Operating Point:
At the operating point, the efficiency is ~70 %
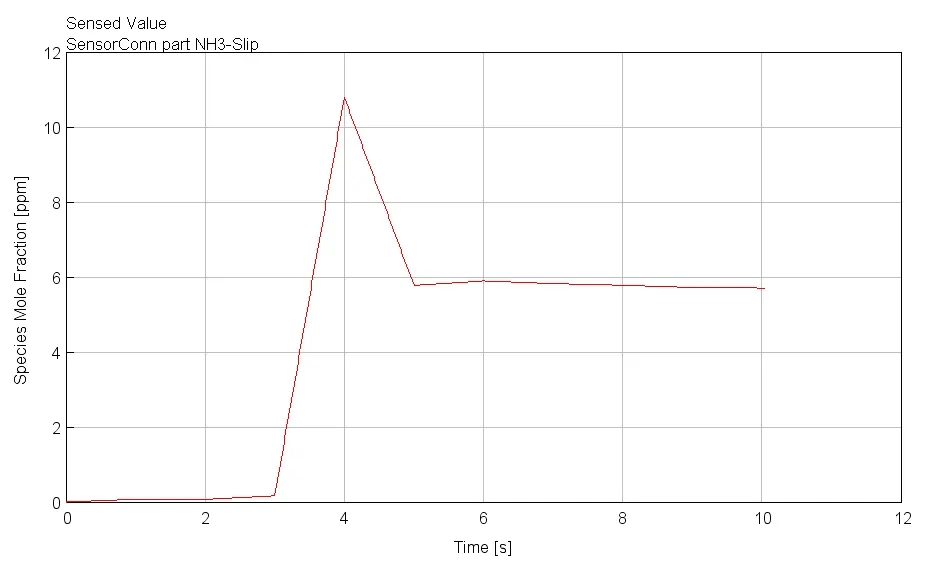
xiii) NH3 Slip at SCR Module:
The NH3 Slip obained at steady state is 6.1 PPM which is less than the specified BS6 Emission norms [max NH3: 10 ppm]
xiv) DOC Monitor:
The conversion efficiency increases rapidly once the light-off temperature is reached. When there is a fall in the temperature of the Inlet gas, the conversion efficiency also decreases.
xv) DPF Monitor:
The DPF monitor shows increase in the mass of soot that gets trapped. The substrate temperature increases as well.
xvi) SCR Monitor:
The typical curve of SCR is shown below where there is a decrease in the NOx out concentration with time.
f) Performance and Emissions at Intermediate speed of 1500 RPM:
Shown below is the performance of the Engine at rated speed of 2200 RPM.
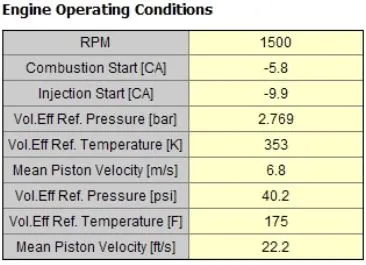
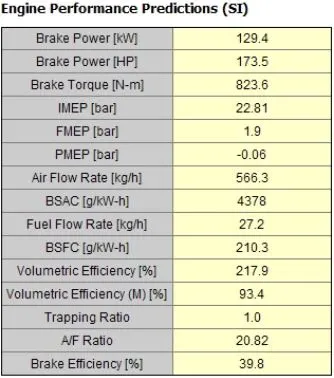
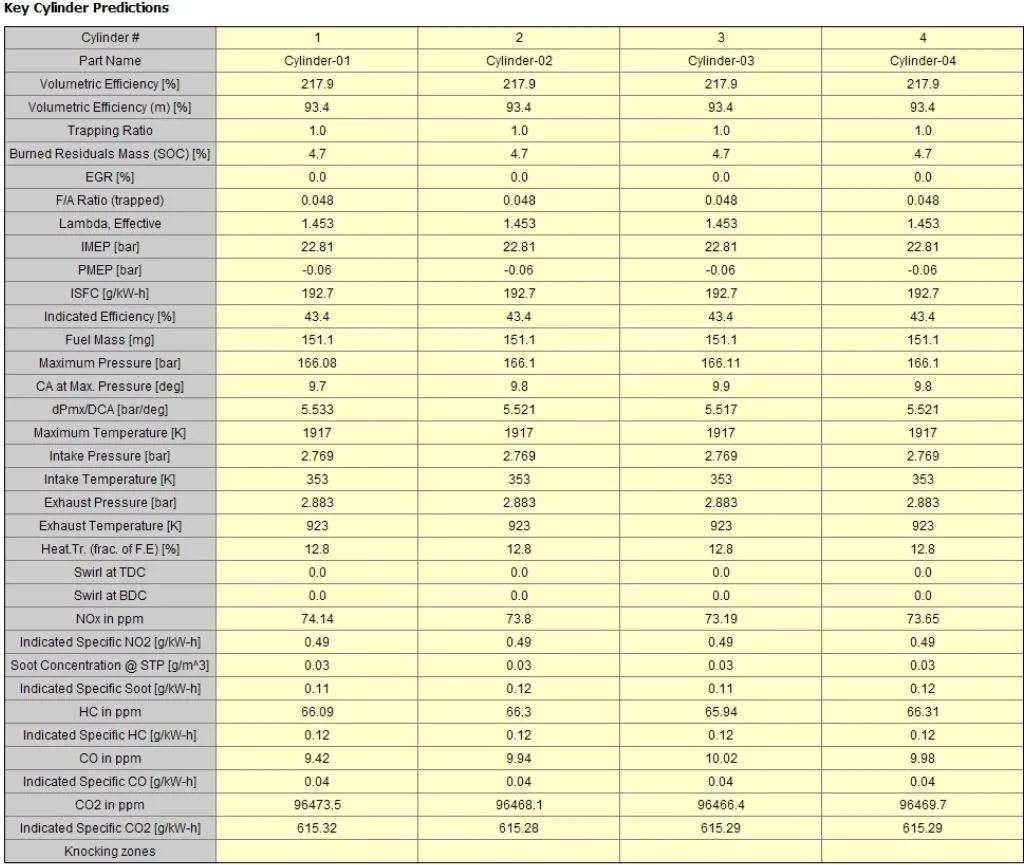
The errors of the achieved performance wrt given targets are shown below. The inference obtained from the results are listed as well:

- At the Intermediate speed, the engine achieves a power of 129.4 kW compared to the target value of 129.6 kW with an error percent of -0.015
- The max Torque obtained at intermediate speed is 823.6 Nm compared to the target value of 825 Nm with an error percent of -0.16
- The air-fuel ratio achieved is 20.82 compared to the target value of 21 with an error percenatge of -0.857
- Finally, the engine is fuel efficient as the BSFC obtained is 210.3 g/kWh compared to the target value of 210 g/kWh with an error percent of 0.14
- The NO2 emission obtained is 0.49 g/kWh compared to target of 0.40 g/kWh with an error percent of 22.5
- The HC emission obtained is 0.12 g/kWh compared to target of 0.13 g/kWh with an error percent of -7.69
- The CO emission obtained is 0.04 g/kWh compared to target of 1.5 g/kWh with an error percent of -97.33
- The obtained performance parameters are quite good and the obtained emission levels are lower than the specified BS6 limits except for NOx. The NOx emissions are on higher side due to a highly possible fact that, turbulence in cylinder is completely ignored due to lack of data. This can affect the emission values obtained by a great deal.
Other important outputs are mentioned below:
- Bore: 108mm, Stroke: 135mm, Bore/Stroke Ratio: 0.8, Connecting Rod Length: 243mm, Piston Pin offset: 10mm, Compression Ratio: 15, Total Displacement: 4.951 L.
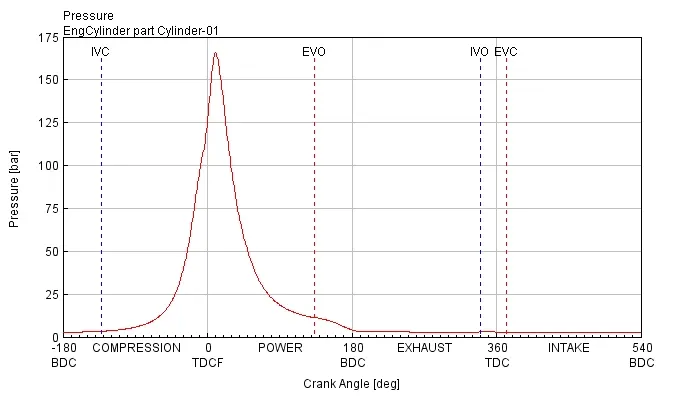
- IVC: -132 CA, EVO: 133 CA, IVO: 340 CA, EVC: 372 CA
- The IMEP is 22.81 bar and FMEP is -1.9 bar. Hence BMEP is 20.9 bar.
- The mean piston speed is 6.76656 m/s
- The Mechanical Efficiency (or) Brake Efficiency obtained is 39.8 %
- The fuel flow rate is 27.2 kg/hr and air flow rate is 566.3 kg/hr. Taking the ratio of these quantities gives air fuel ratio of 20.81
- The volumetric efficiency wrt to TC is 217.9 % and volumetric efficiency of manifold is 93.4 %
- The heat transfer % is 12.8. The low value maybe due to the lack of turbulence in cylinder.
g) Performance Plots at Intermediate Speed:
i) Pressure vs CA
Max Pressure of 165.84 bar is reached at +9.80 CA from TDCF. The max pressure occurs just after TDC, so that no power that is generated by combustions gets wasted.
ii) Pressure Volume Diagram:
This plot can be used to calculate the total work done by the engine. The compression ratio can be estimated as well.
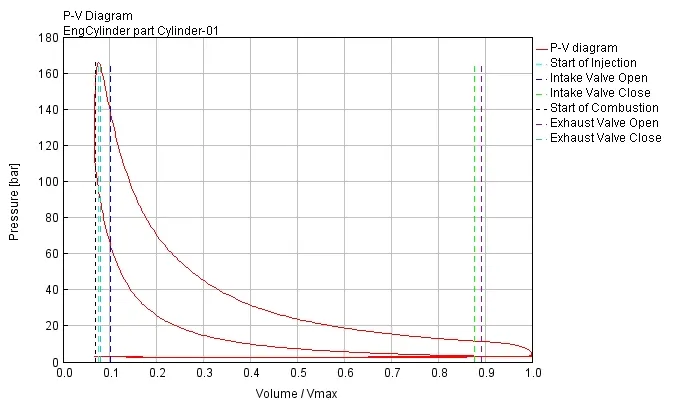
With reference of the representative diagram shown below, the Gross IMEP is defined as the area W+ and the IMEP that gets consumed is defined as area W-; The gross IMEP is defined as the difference between the two areas: (W+) - (W-). The same method can be used to calculate the gross IMEP from the PV plot. Since the exact data points are not available, the calculation has not been done.
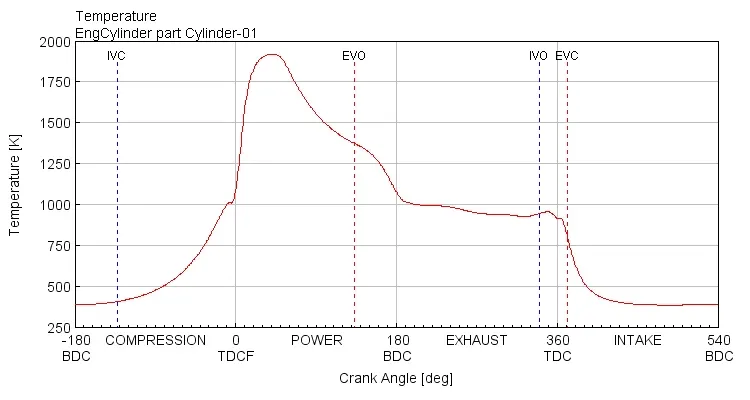
iii) Temperature vs CA:
A max temperature of 1917 K is attained at +40.86 CA from TDCF.
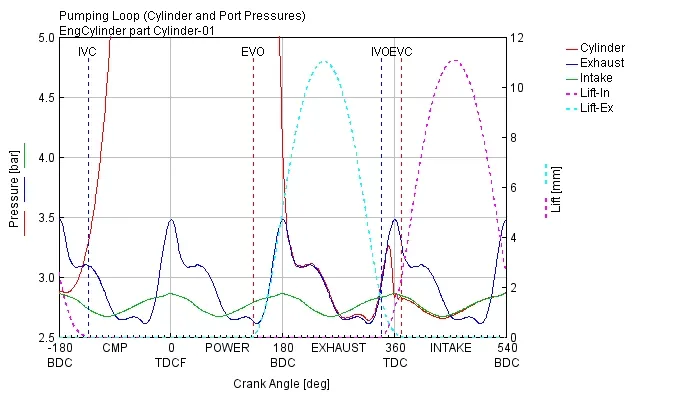
iv) Pumping Loop:
The pressure in the cylinder at during opening and closing of the valves are shown below. The cylinder pressure reduces drastically as the exhaust valve opens. The plot also shows the small time interval of valve overlap at the gas exchange TDC.
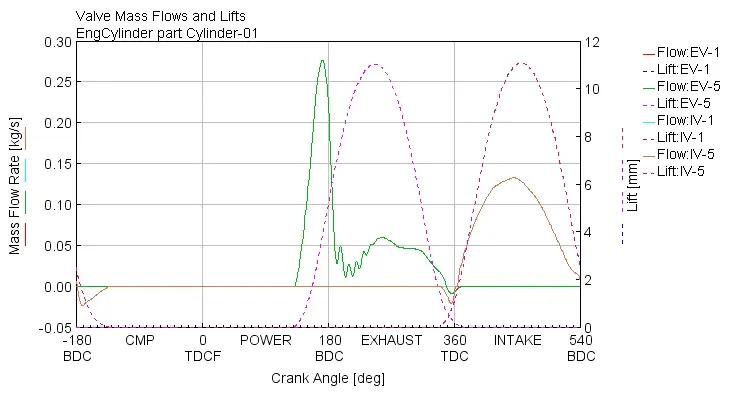
v) Mass flow rate through Valves:
The exhaust air is discharged at two intervals. The maximum mass flow rate of exhaust occurs before the max lift of Exhaust valve and a second peak occurs before EVC. A small time interval of valve overlap happens near gas exchange TDC and a backflow occurs in the cylinder during this interval.
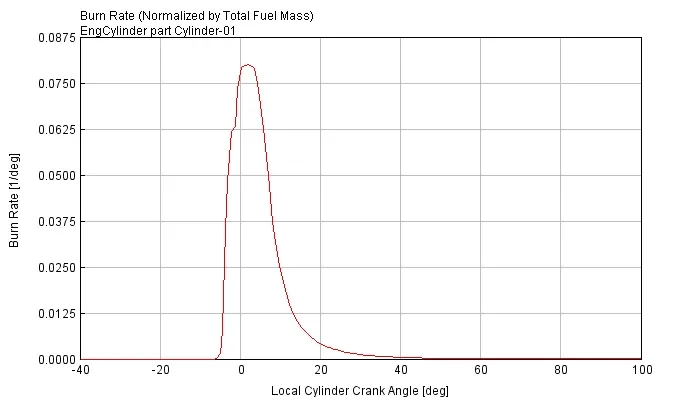
vi) Normalized Burn rate:
The obtained burn rate from DI-Pulse Combustion model.
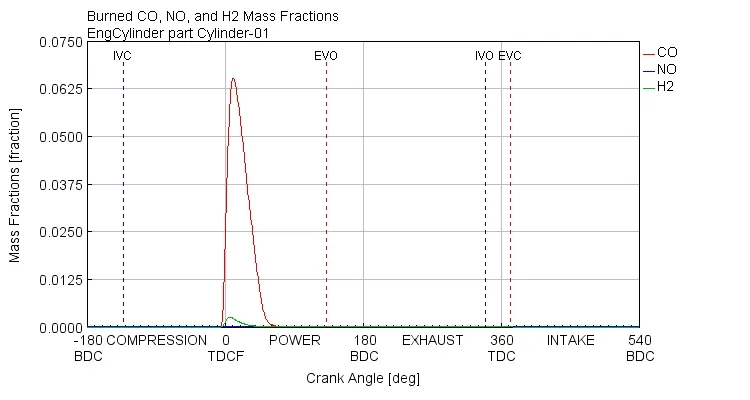
vii) Burnt + Unburnt CO, NO, H2 Mass Fractions:
The mass fraction of CO is around 0.0651, that of NO is 5.32E-6 and that of H2 is around 0.00261.
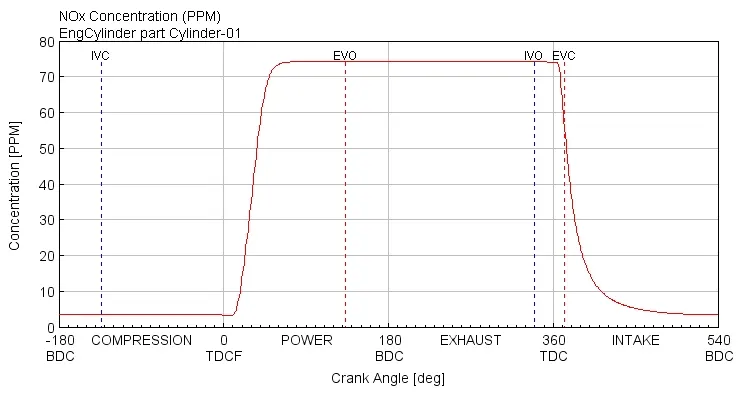
viii) NOx generated:
The max NOx concentration produced is around 74.4 ppm.
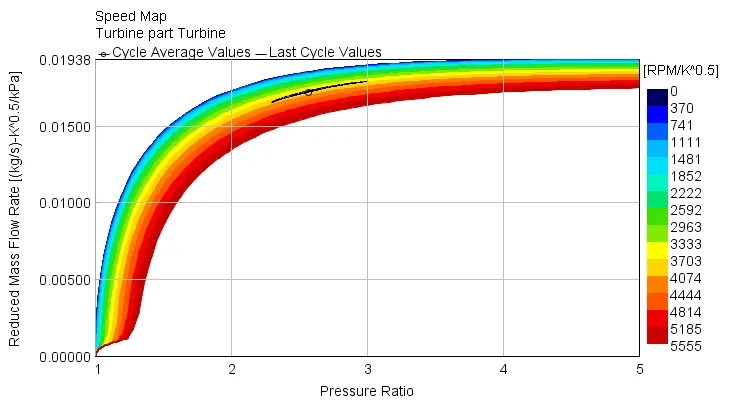
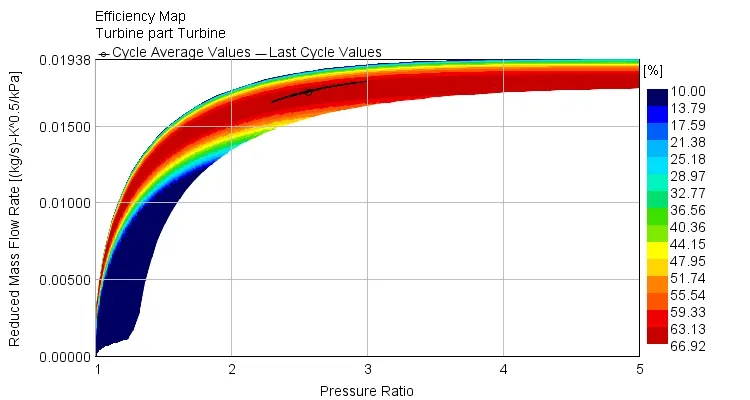
ix) Turbine Speed Map with Operating Point:
At the operating point, the pressure ratio is 2.57, reduced mass flow rate is 0.017 kg/sec-K^0.5/kPa and ~3700 RPM/K^0.5
x) Turbine Efficiency Map with Operating Point:
At the operating point, the efficiency is ~66 %
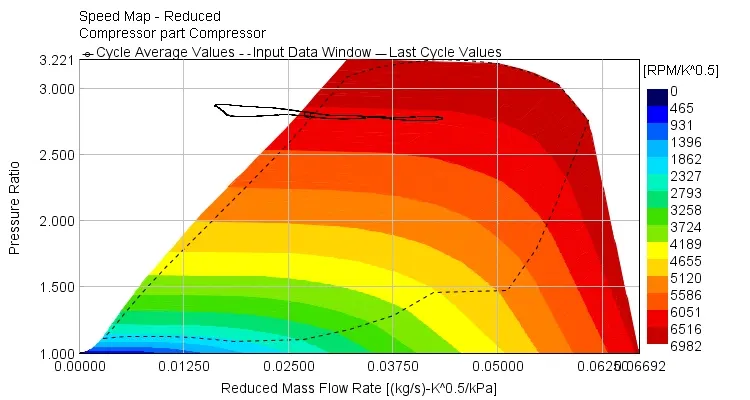
xi) Compressor Speed Map with Operating Point:
At the operating point, the pressure ratio is 2.8, reduced mass flow rate is 0.0273 kg/sec-K^0.5/kPa and ~6000 RPM/K^0.5
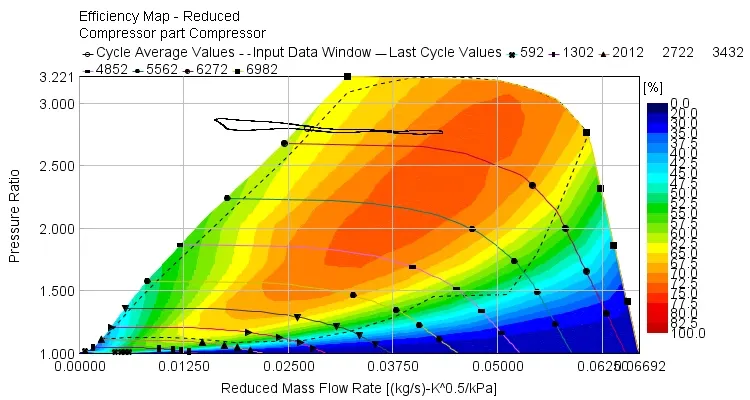
xii) Compressor Efficiency Map with Operating Point:
At the operating point, the efficiency is ~65 %
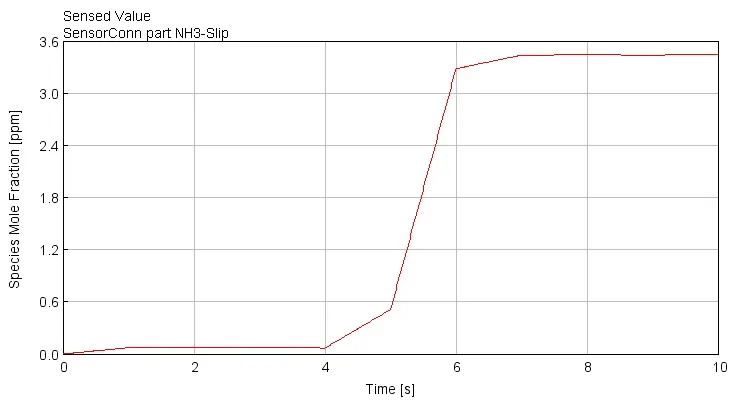
xiii) NH3 Slip at SCR Module:
The NH3 Slip obained at steady state is 3.44 PPM which is less than the specified BS6 Emission norms [max NH3: 10 ppm]
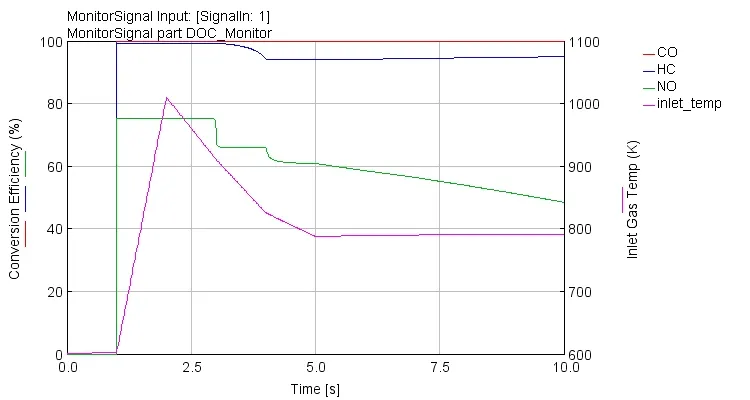
xiv) DOC Monitor:
The conversion efficiency increases rapidly once the light-off temperature is reached. When there is a fall in the temperature of the Inlet gas, the conversion efficiency also decreases.
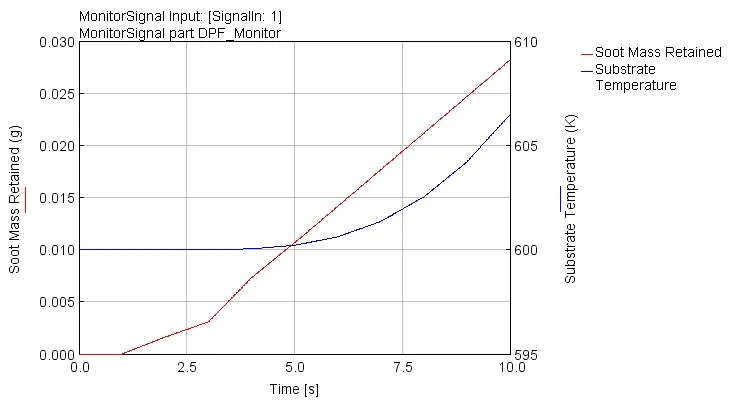
xv) DPF Monitor:
The DPF monitor shows increase in the mass of soot that gets trapped. The substrate temperature increases as well.
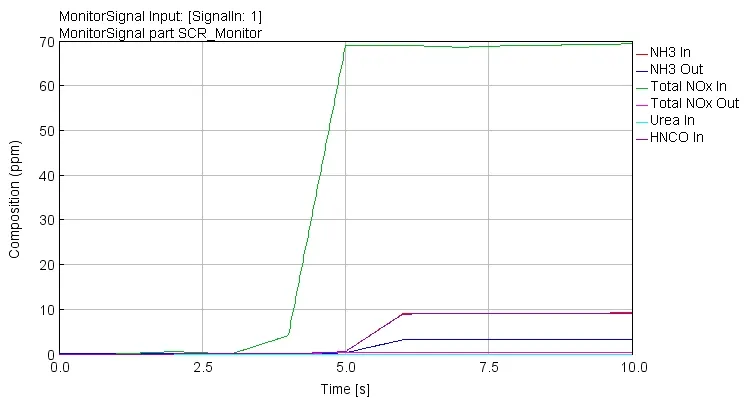
xvi) SCR Monitor:
The typical curve of SCR is shown below where there is a decrease in the NOx out concentration with time.
I) FUTURE SCOPE:
a) Exploration of alternative fuels and latest technologies:
References:
1) Fischer-Tropsch Diesel Fuels -Properties and Exhaust Emissions: A Literature Review; Publisher: SAE
2) Alternatives to Petroleum Diesel Fuel; by A. Demirbas; Journal: Energy Sources, Part B: Economics, Planning, Policy; Volume 2-2007, Issue 4, Pages 343-351 | Published online: 29 Oct 2007
3) Biodisel: An alternative fuel produced from vegetables by Transesterification, K.M. Shereena, T. Thangaraj; Department of Zoology, Kongunadu arts and Science College (Autonomous), Coimbatore-641 029, Tamil Nadu, India
There are alternatives to diesel fuel. They are: 1) Vegetable oil, 2) Biodiesel, 3) Fischer-Tropsch (F-T) diesel and 4) Dimethyl ether (DME). Vegetable oils can be manufactured from Soyabean, sunflower, peanut which can be used as alternatives in the CI Engine. F-T diesel and DME can be manufactuted by processing Natural gas.
The Fischer-Tropsch product composition is strongly influenced by catalyst composition. Natural gas and coal can be converted to diesel fuel through Fischer-Tropsch (F-T) processes. The F-T process can be modified to get desirable end properties.The F-T diesel fuel is typically one of two types – a very high cetane number (>74), zero aromatic product or a moderate cetane (~60) and a low aromatic (=15%) product. The lubricity of both types of F-T diesel fuels is poor, but can be improved with additives.
Fischer-Tropsch diesel fuel can be used neat without engine modification or can be blended in any proportion with conventional diesel fuel. A number of studies have collected emissions data from F-T diesel and F-T/ conventional diesel fuel blends in engine and chassis dynamometers. In almost every case, NOx, CO, and PM emissions are reduced with neat F-T diesel fuel. The impact of F-T diesel fuel on HC emissions is more variable, although the HC emissions are very low in any case. Average NOx reductions are 13% and average PM reductions are 26% compared to conventional diesel fuel.
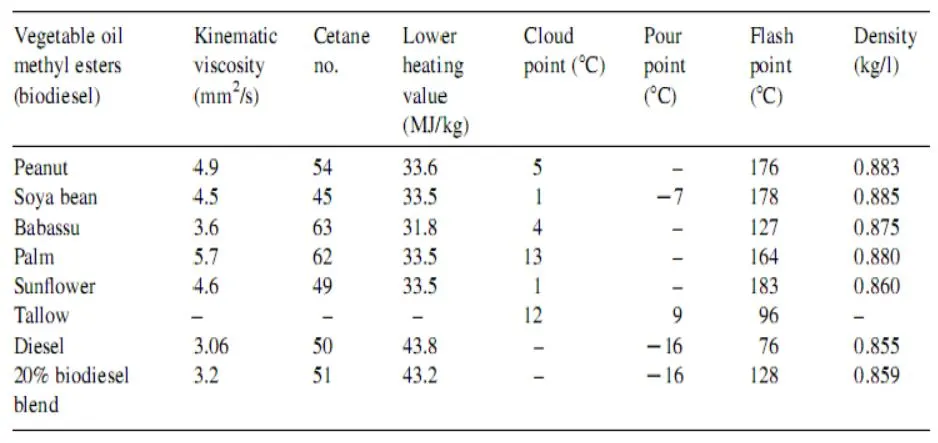
The vegetable oils obtained are highly viscous and have to go through a process called Trans-esterification which reduces the viscosity of the oils. From the table shown below, the properties of biodiesel and diesel fuel shows many similarities, and therefore, biodiesel is rated as a strong candidate as an alternative to diesel. However problem persists at cold starting conditions.
b) New technologies that are being researched which can be implemented:
References: BOSCH Technologies
To date, two factors have hindered the reduction of NOx emissions in diesel vehicles: A) The free-style drive of the vehicle that demands an equally dynamic recirculation of exhaust gases. B) Equally important is the influence of temperature on the exhaust gases. To ensure optimum NOx conversion, the exhaust gases must be hotter than 200 degrees Celsius. In urban driving, vehicles frequently fail to reach this temperature.
Bosch has come up with a combination of new technology that produces a maximum NOx of 13 mg/km in standard legally-compliant RDE cycles against the Euro 6 standard of 120 mg/km. In urban areas, a NOx concentrations of 40 milligrams per kilometer were recorded.
A combination of advanced fuel-injection technology, a newly developed Highly Responsive Air-Flow Management System for the engine which is highly responsive air-flow system is achieved by using RDE-optimized turbocharger., and intelligent temperature management that ensures that the exhaust system stays hot enough to function within a stable temperature range has made such low readings possible.
Shown below is the diagramatic representation of the technology.
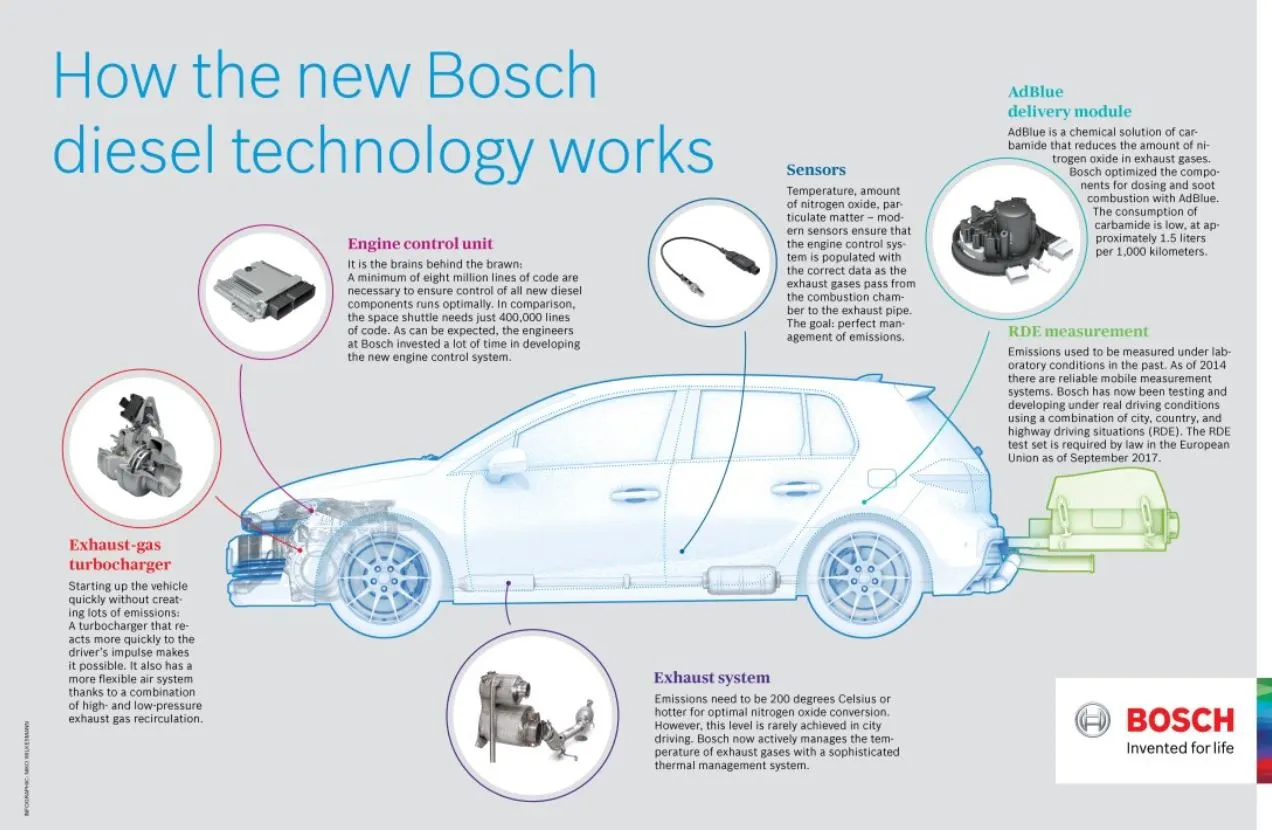
Apart, from the BOSCH Technology, other advanced technologies that can be used are CRDI Injection with Solenoid or Piezo Injectors that are controlled electronically and hence will lead to an Ideal Combustion and unconditionally lesser emissions. Other practices are the use of Turbochargers with a combination of higher and lower pressure EGR's.
J) UNIQUE SELLING POINTS (USP's) and Customer's point of Considerations:
- The designed engine is a compact commercial diesel engine [Compression ratio - 15] optimized for higher torques and high load carrying conditions. As the engine CR of the engine is low, it is relatively economical than most of its competitors.
- In compliance with BS6 emission standards.
- Best suited for Pick-up Trucks which is a highly economical and developing class of vehicles in commercial sector.
- Optimized Fuel efficiency and Emissions for Heavy duty cycles and lower RPM's.
- Equipped with Advanced fuel injection technologies like CRDI and Advanced air flow management with a Variable Geometry Turbine (VGT) Compressor Unit coupled with High Pressure EGR that keeps in check the right apsiration requirements of the engine at all times.
K) CONCLUSION:
A 4-Cylinder Diesel Engine for commercial road application in compliance with BS6 Emission limits is developed and modelled in GT-Power. Advanced fuel Injection techniques and air flow control techniques are used. A combination of In-cylinder strategies and After-treatment technologies are employed to achieve the required emission limits. The engine performance and emissions are recorded at Rated Speed of 2200 RPM and Intermediate Speed of 1500 RPM. Alternative fuels and New technologies in the field of diesel engines are discussed.
References:
- GT-ISE Manuals and Documentation
- IC Engine Fundamentals by John B Heywood
- Trends of Rotational Speed on Performance of 4 Cylinder Direct Injection Hydrogen Fueled Engine, M.M. Rahman, M.K. Mohammed and R.A. Bakar
- Wikipedia