Cyclone Separator Challenge
Cyclone separator analysis
Aim:-
To perform analysis on cyclone separator and calculate the separation efficiency and pressure drop. Then analysis the separation efficiency and pressure drop by varying particle diameter and particle velocity.
Introduction:-
Cyclones are devices that employ a centrifugal force generated by a spinning gas stream to separate particles from the carrier gas (Gimbun et al., 2005). Cyclone separators operate under the action of centrifugal forces. Fluid mixture enters the cyclone and makes a swirl motion and, due to centrifugal forces, the dense phase of the mixture gains a relative motion in the radial direction and is separated from main flow (Avci and Karagoz, 2003). In this design, particle-laden gas enters the
cyclone at the top of the cylinder and makes several revolutions due to the shape of the entry forming a vortex with a high tangential velocity which accelerates particles outward to the wall for collection. Below the bottom of the gas exit tube, the spinning gas gradually migrates inward, to a “central core” axially along the cylinder centerline, and from there up, finally out exit tube (Zhu and Lee,1999). Their simple design, low capital cost and nearly maintenance-free operation make them ideal for use as
pre-cleaners for more expensive final control devices such as baghouses or electrostatic precipitators.
Cyclones are particularly well suited for high temperature and pressure conditions because of their rugged design and flexible components materials. Cyclone collection efficiencies can reach 99 % for particles bigger than 5 μm, and can be operated very high dust loading. Cyclones are used for the removal of large particles for both air pollution control and process use (Silva et al.,2003). Application in extreme condition includes the removing of coal dust in power plant, and the use as a spray dryer or gasification reactor (Gimbun, 2005).
Engineers are generally interested in two parameters in order to carry out an assessment of the design and performance of a cyclone. These parameters are the collection efficiency of particle and pressure drop through the cyclone (Dirgo and Leith, 1985). An accurate prediction of cyclone pressure drop is very important because it relates directly to operating costs. Higher inlet velocities
give higher collection efficiencies for a given cyclone, but this also increases the pressure drop across the cyclone. Therefore, a trade off must be made between higher collection efficiency and low pressure drop across the cyclone (Griffiths and Boysan, 1996).
The vortex finder size is an especially important dimension, which significantly affects the cyclone performance as its size plays a critical role in defining the flow field inside the cyclone, including the pattern of the outer and inner spiral flows. The vortex finder affected the collection efficiency and pressure drop of cyclones, and proposed an energy-effective cyclone design (Lim et al.2003).
The purpose of this study is to help in understanding of the pressure drop of cyclones by experimentally exploring the effects of gas inlet velocity, the vortex finder diameter and length, at different gas concentration, on the cyclone performance. The pressure drop of cyclones with 3
different vortex finders diameters have been evaluated and compared. This study focused on the effects of the vortex finder diameter on the pressure drop as little work has been performed on cyclones in relation to this dimension.
Theory:-
Cyclone separator works on the principle of centrifugal separation. The exhaust gas coming from the factories has been treated, since it contains dust particles. This dust laden gas is made to pass through the tangential inlet. Then, it reaches the cylinder portion. Now, the linear flow is transformed into swirling motion, i.e. a swirl (outer vortex) is created. Due to the surface roughness of cylinder and cone portion, particles come into contact with the wall, and they fall into the collector (Alex C. Hoffmann, 2005). The gas due to the centrifugal force moves towards the outer boundary and the outer vortex is maintained. Simultaneously, the swirl continues towards the end and it reverses its direction and inner vortex is created (T. G. Chuah 2003). The upward movement is mainly due to the low density of the gas, and we know that gas always travels from low pressure to high pressure. The cleaner gas comes out of the vortex finder. Parameters used to design cyclone separator are height in inlet, cylindrical and conical section, width of inlet, exit diameter and vortex finder diameter. The flow of a cyclone separator is mainly swirling flow, which is obtained due to the geometry of the equipment. There are two types of vortex occurring in a cyclone; an outer vortex, which is created during the flow from inlet to collector in the downward direction, whereas the inner vortex is created during the flow from collector to the vortex finder in the upward direction. Swirling Flow – Real Vortex flow
This types of flow takes place in different types of equipment such as cyclones, hydrocyclones etc. The major classification of swirling flow is
Forced Vortex Flow
A swirling flow is defined as tangential velocity distribution of a rotating solid body
Free Vortex Flow
A flow in which, fluid swirl without friction. In swirling flow, the tangential velocity distribution will occur in-between these two ends. Consider that the swirling fluid behaves like a solid body having an infinite viscosity. Then, the fluid layers at different radii won’t have shearing motion between them. Here, the fluid elements at radial positions are forced, which will have the same angular velocity Ω which is equal to Vθ, where vθ is the tangential velocity that gives the equation of a forced vortex flow. Vθ = Ωr
CYCLONE EFFICIENCY EMPIRICAL MODELS
- Iozia and Leith Model:-
Iozia and Leith [4] logistic model is a modified version of Barth Model, which is developed based on force balance. The model assumes that a particle carried by the vortex endures 165 the influence of two forces: a centrifugal force, Z and a flow resistance, W. The collection efficiency hi of particle diameter dpi can be calculated from
β is an expression for slope parameter derived based on the statistical analysis of experimental data of a cyclone with D = 170.
0.25 m given as and dpc is the 50% cut size given by Barth
+1.05
where core length, zc, and core diameter, dc, are given as
zc = (H − S)−
zc = H − S for dc < B
dc = 0.47D
- Li and Wang Model:-
The Li and Wang [3] model includes particle bounce or re- entrainment and turbulent diffusion at the cyclone wall. A two dimensional analytical expression of particle distribution in the cyclone is obtained. Li and Wang model was developed based on the following assumptions:
- The radial particle velocity and the radial concentration profile are not constant for uncollected particles within
the cyclone.
- Boundary conditions with the consideration of turbulent diffusion coefficient and particle bounce reentrainment on the cyclone wall are:
c = c0, at q = 0
at r = D/2
The tangential velocity is related to the radius of cyclone by: uRn = constant. The concentration distribution in a cyclone is given as:
Where
And
The resultant expression of the collection efficiency for particle of any size is given as
hi = 1 – exp {-lq1} [15]
where
q1 = 2p(S + L)/a
- Koch and Licht Model:-
Koch and Licht [2] collection theory recognized the inherently turbulent nature of cyclones and the distribution of gas residence times within the cyclone. Koch and Licht described particle motion in the entry and collection regions with the additional following assumptions:
- The tangential velocity of a particle is equal to the tangential velocity of the gas flow, i.e. there is no slip in the tangential direction between the particle and the gas.
- The tangential velocity is related to the radius of cyclone by: uRn = constant.
A force balance and an equation on the particles collection yields the grade efficiency hi
Where
n = 1 −
G is a factor related to the configuration of the cyclone, n is related to the vortex and is the relaxation term.
- Lapple Model:-
Lapple modelwas developed based on force balance with out considering the flow resistance. Lapple assumed that a particle entering the cyclone is evenly distributed across the inlet opening. The particle that travels from inlet half width to the wall in the cyclone is collected with 50% efficiency. The semiempirical relationship developed by Lapple to calculate a 50% cut diameter, dpc, is
where Ne is the number of revolutions
The efficiency of collection of any size of particle is given by
Pre-processing and meshing:-
A predefined geometry model is imported in ANSYS Spaceclaim as shown in figure 1. Then by using volume extract command we can extract the fluid volume from the main geometry. The solid fluid volume is shown in figure 2. Then the model is updated to ANSYS meshing. In meshing global setting tab we have chosen a cutcell meshing meshing option under assembly mesh setting. And input a global size of mm. after completing necessary setting we have generated mesh, in figure 3 it shows a mesh. One input and two output boundary named is given as shown in figure 4. From thye above mesh setting we get a total number of cell as 66731 and total number of element as 64238 .
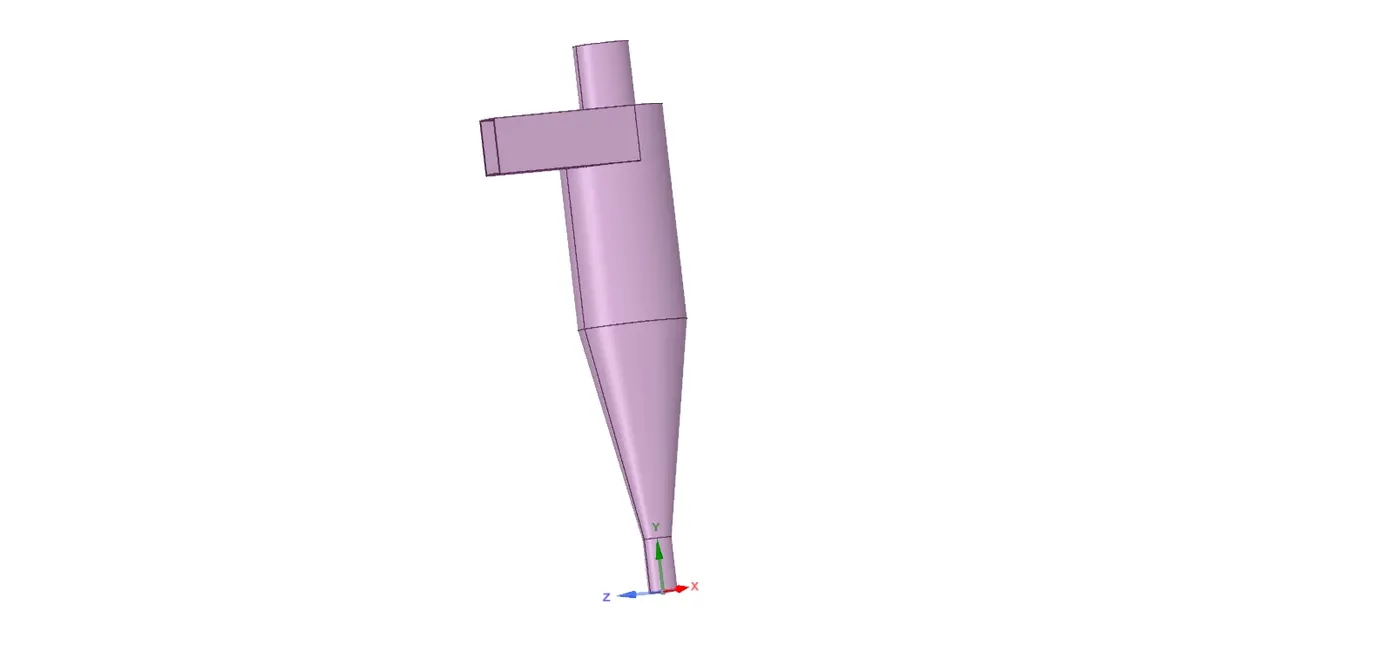
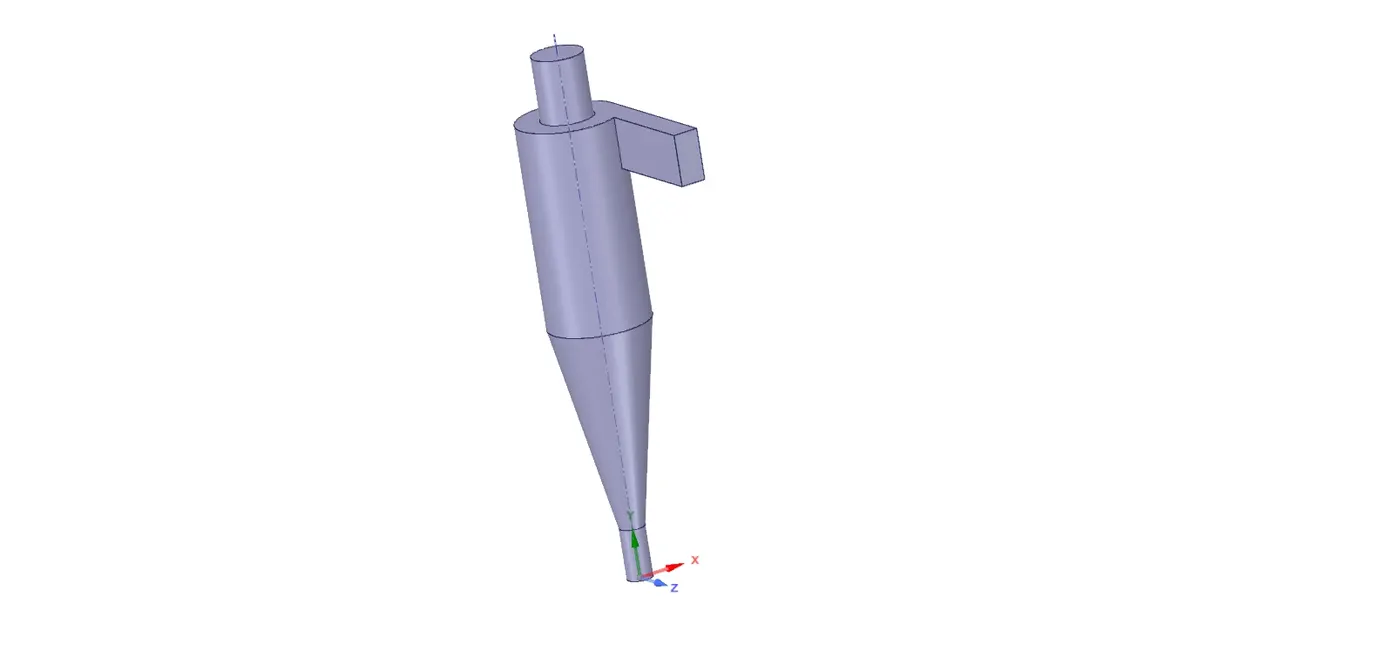
Figure 1, Main Geometry . Figure 2, Fluid volume.
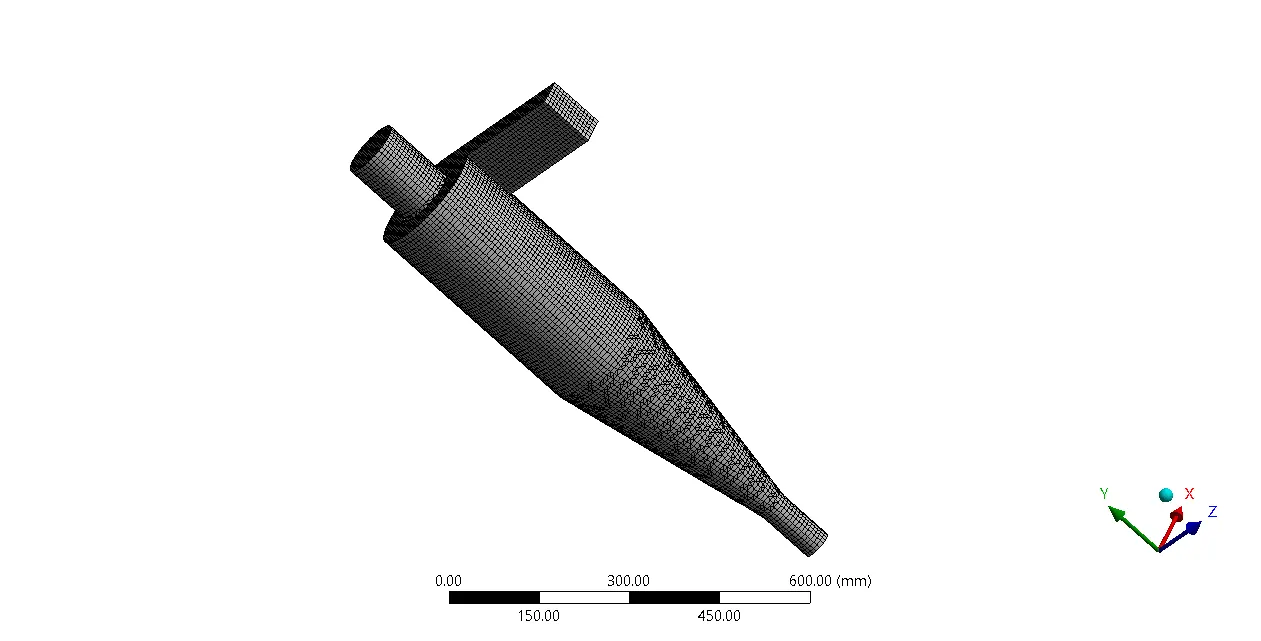
Figure 3, Meshed geometry.
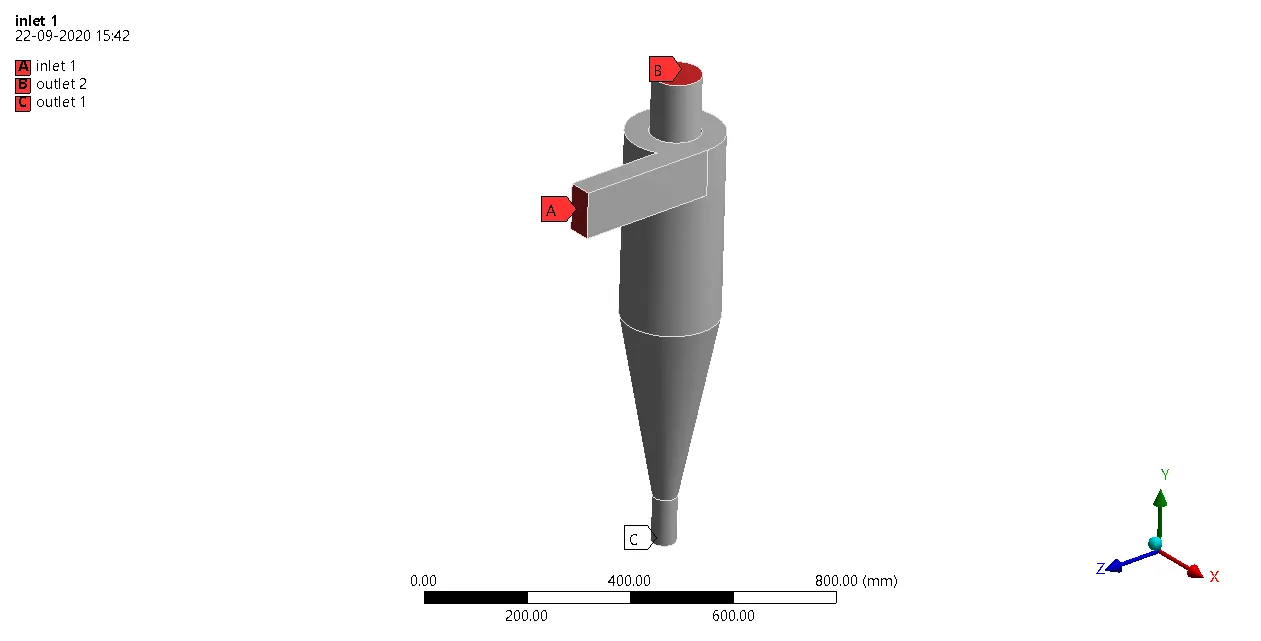
Figure 4, Boundary name defination.
Solver setting:-
As now as we reach at defining numerical section in Fluent. Here we choose a pressure based, steady state is selected with gravity enable in -Y direction with constant 9.81 m/s. In viscous model we chose a K- epsilon model with RNG and swirl dominated flow, standard wall function is selected foe near wall function. Our main purpose for this simulation is to track the particle, so we have to activate a Discrete phase modelling. Enabling interaction with continuous phase also check update DPM sources every flow iteration of 10. Maximum number of step for article tracking is 50000 and step length factor 5. For setting injection property choose injection type surface because we chose a inlet surface for injection particle and chose inlet 1. Particle type is inert material Anthracite with diameter distribution uniform. We have to perform a analysis on giver cyclone model with different scenarios.
Case 1:- By varying the particle diameter from 1mm to 5mm and particle velocity and flow velocity as 3 m/s.
Case 2:- By varying the flow velocity and particle velocity from 1 m/s to 5m/s. keeping the particle diameter as 5mm
Select velocity in X direction under point properties tab and particle diameter as. Fluid material is selected as default air and inert particle is anthracite. Properties of both material are shown in Table 1
|
Material |
Density |
Viscosity |
|
Air |
1.225 𝑘𝑔/𝑚3 |
1.7894e-05 𝑘𝑔/𝑚-s |
|
Anthracite |
1550 𝑘𝑔/𝑚3 |
- |
Boundary condition for inlet is defined as velocity inlet with velocity magnitude according to ours cases. In DPM tab we chose Discrete phase Boundary type as reflect. For outlet consider as pressure outlet. For outlet 1, Gauge pressure be 0 and discrete phase boundary type as trap.
For outlet 2, gauge pressure be 0 and discrete phase boundary type as escape. Pressure velocity coupling scheme as SIMPLE. Pressure second order and momentum second order upwind. Initialized the solution by using standard initialization and compute values from inlet. Run the simulation for 600 iteration. After completing the calculation we have to export particle history data. In console we can see DPM iteration detail of tracked particle.
Calculation:-
Collection Efficiency
A very simple model can be used to determine the effects of both cyclone design and
operation on collection efficiency. In this model, gas spins through a number N of revolutions in the outer vortex. The value
of N can be approximated as the sum of revolutions inside the body and inside the cone.
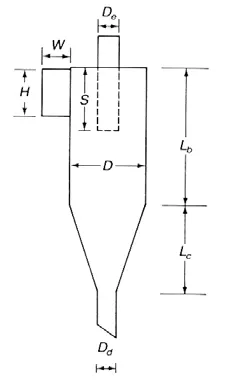
where
N = number of turns inside the device (no units)
H = height of inlet duct (m or ft)
Lb = length of cyclone body (m or ft)
Lc = length (vertical) of cyclone cone (m or ft).
To be collected, particles must strike the wall within the amount of time that the gas travels in the outer vortex. The gas residence time in the outer vortex is
Dt = path length / speed =p D N /Vi
where
Dt = time spent by gas during spiraling descent (sec)
D = cyclone body diameter (m or ft)
Vi = gas inlet velocity (m/s or ft/s) = Q/WH
Q = volumetric inflow (m3/s or ft3/s)
H = height of inlet (m or ft)
W = width of inlet (m or ft).
The maximum radial distance traveled by any particle is the width of the inlet duct W. The centrifugal force quickly accelerates the particle to its terminal velocity in the outward (radial) direction, with the opposing drag force equaling the centrifugal force.
The terminal velocity that will just allow a particle initially at distance W away from the wall to be collected in time is
Vt =W/ Dt
where Vt = particle drift velocity in the radial direction (m/s or ft/s).
The particle drift velocity is a function of particle size.
Assuming Stokes regime flow (drag force = 3πμdpVt) and spherical particles subjected to a centrifugal force mv2/r ,
with m = mass of particle in excess of mass of air displaced, v = Vi of inlet flow, and r = D/2, we obtain
where
Vt = terminal drift transverse velocity (m/s or ft/s)
dp = diameter of the particle (m or ft)
ρp= density of the particle (kg/m3)
ρa= air density (kg/m3)
m = air viscosity (kg/m.s).
Substitution of the 2nd equation into the 3rd eliminates Dt. Then, setting the two expressions for Vt equal to each other and rearranging to solve for particle diameter, we obtain
It is worth noting that in this expression, dp is the size of the smallest particle that will be collected if it starts at the inside edge of the inlet duct. Thus, in theory, all particles of size dp or larger should be collected with 100% efficiency.
Note that the units must be consistent in all equations.
One consistent set is m for dp, R and W; m/s for Vi and Vt kg/m.s for m; and kg/m3 for and . An equivalent set in English units is ft for dp, R and W; ft/sec for Vi and Vt lbm/ft.sec for m; and lbm/ft3 for and .
Lapple then developed a general curve for standard conventional cyclones to predict the collection efficiency for any particle size .If the size distribution of particles is known, the overall collection efficiency of a cyclone can be predicted by using the.
Theodore and DePaola (1980) then fitted an algebraic equation to the curve, which makes Lapple’s approach more precise and more convenient for application to computers. The efficiency of collection of any size of particle is given by
Where
collection efficiency of particles in the jth size range (0 < < 1).
Pressure drop:-
In general, the term ‘pressure drop’ means drop in total pressure i.e. Static pressure and Dynamic pressure. In other words, the pressure lost during the flow between inlet and outlet. It occurs mainly due to the frictional losses in the body of the cyclone. It is very difficult to measure pressure drop due to the presence of swirl in the exiting gas (Khairy Elsayed 2011). Moreover, the static pressure can be measured easily, whereas the dynamic pressure at the exit is difficult to measure experimentally. The pressure drop over a cyclone is normally divided in to three sections:
- Losses in the entry,
- Losses in the separation space (the main cyclone body), and
- Losses in the vortex finder.
The entry losses in cyclones with tangential inlets are negligible since the flow is linear, and it moves to the main cyclone body without many obstructions. Once the flow enters the cyclone body, the linear flow transforms into a swirl flow due to the shape of the body. So, the dynamic pressure increases accordingly. But, this increase in dynamic pressure is lost due to the friction in the walls. Therefore, the losses in the cyclone body are much higher to the other section. In the vortex finder, the clean gas comes out through it, but due to the swirl present in the flow, some pressure is lost. Thus, these are the main sections of pressure drop.
In our case the dimensions of cyclone separator is shown in table 2,
|
S.NO |
Parameter |
Dimension |
|
1 |
W |
0.05 m |
|
2 |
H |
0.1 m |
|
3 |
De |
0.1 m |
|
4 |
D |
0.204 m |
|
5 |
Lb |
0.402 m |
|
6 |
Lc |
0.4 m |
|
7 |
Ddc |
0.05 m |
|
8 |
S |
0.250 m |
Table 2,
Cyclone separation efficiency calculation:-
From the above equations we can directly solve for cyclone separation efficiency according to our case 1, first we look at the case where we are going to change the particle diameter and other parameter remains the same. Now at end the results of calculation are shown in Table 3.
|
S.no |
Particle diameter |
Flow velocity |
Particle velocity |
Efficiency |
|
1 |
1mm |
3 m/s |
3m/s |
2.14 % |
|
2 |
2mm |
3 m/s |
3 m/s |
10 % |
|
3 |
3mm |
3 m/s |
3 m/s |
20% |
|
4 |
4mm |
3 m/s |
3 m/s |
30.7% |
|
5 |
5mm |
3 m/s |
3 m/s |
40.9% |
Table 3,
For case 2 where we are going to make particle diameter fixed to 5mm and change flow velocity and particle velocity from 1m/s to 5m/s. the results of calculation are shown in table 4,
|
S.no |
Particle diameter |
Flow velocity |
Particle velocity |
Efficiency |
|
1 |
5mm |
1 m/s |
1 m/s |
15.4 % |
|
2 |
5mm |
2 m/s |
2 m/s |
26.6 % |
|
3 |
5mm |
3 m/s |
3 m/s |
40.9% |
|
4 |
5mm |
4 m/s |
4 m/s |
42.7% |
|
5 |
5mm |
5 m/s |
5 m/s |
47.8% |
Table 4,
Pressure drop calculation :-
The equation that we use to calculate the pressure drop is now both the pressure inlet and pressure outlet is calculated by fluent solver and the result are plotted in table 5.
|
S.NO |
Pressure inlet (Pa) |
Pressure outlet (Pa) |
Pressure drop (Pa) |
|
1 |
2.14 |
0.000596 |
2.146 |
|
2 |
10.778 |
0.00519 |
10.763 |
|
3 |
25.85 |
0.0144 |
25.835 |
|
4 |
47.325 |
0.0265 |
47.298 |
|
5 |
75.295 |
0.0438 |
75.251 |
Table 5
Result:-
In CFD post first we have to import fluent particle track file which we export in fluent. Now in fluent PT for anthracite we have to increase the maximum track particle to 100 and colour the particle in variable as anthracite particle time. So we can see from contour as shown in Figures 15 To 19 that some of the particle is escaped through outlet 2 and most of them is trapped in outlet 1. As the particle diameter is increasing the more particle is trapped in outlet 1 which is generally called as dust collector. From the Figure 20 to 24. we can see that as the diameter of particle is increasing from 1mm to 5mm, its efficiency is increasing as shown in figure. To visualise the vortex core region click on location and vortex core region and specify the swirling strength. Figure from shows the swirling strength for 1mm to 5mm diameter particle size. covergence plot i shown in Figure 5 to 14. by the convergence plot we can say that the simulation is smoothly converged and amplitude of residual is decreasede and at last become steady.
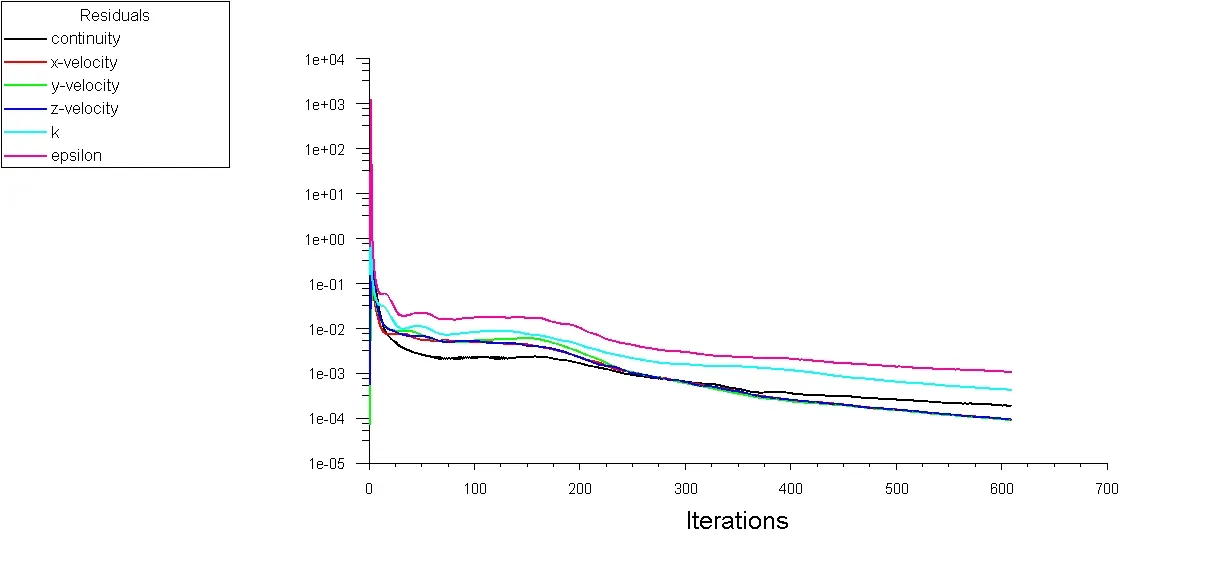
Figure 5, Convergence plot for particle size 1`mu`m Figure 6, Convergence plot for particle size 2`mu`m`
Figure 7, Convergence plot for particle size 3`mu`m. Figure 8, Convergence plot for particle size 4`mu`m`
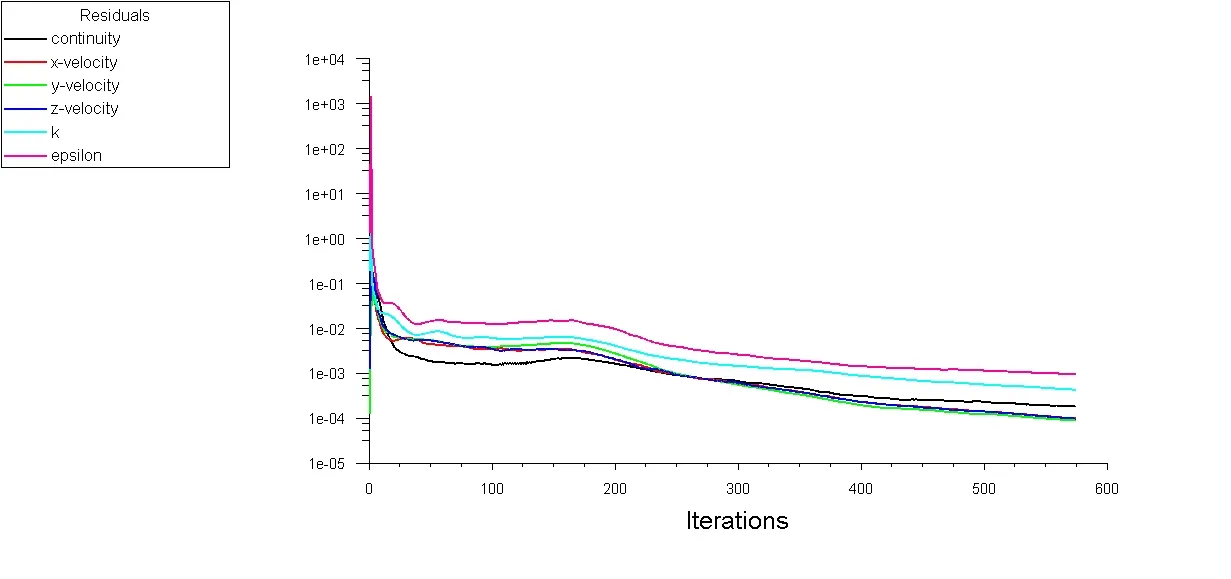
Figure 9, Convergence plot for paticle size 5`mu`m. Figure 10, convergence plot for flow velocity 1m/s.
`Figure 11, convergence plot for flow velocity 2m/` Figure 12, convergence plot for flow velocity 3m/s`
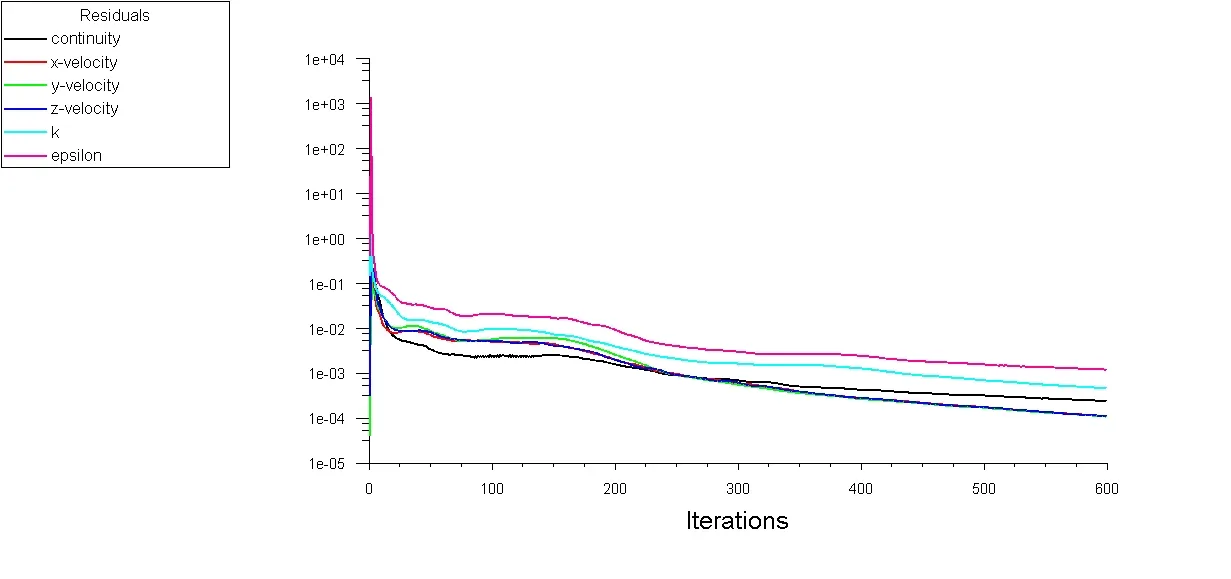
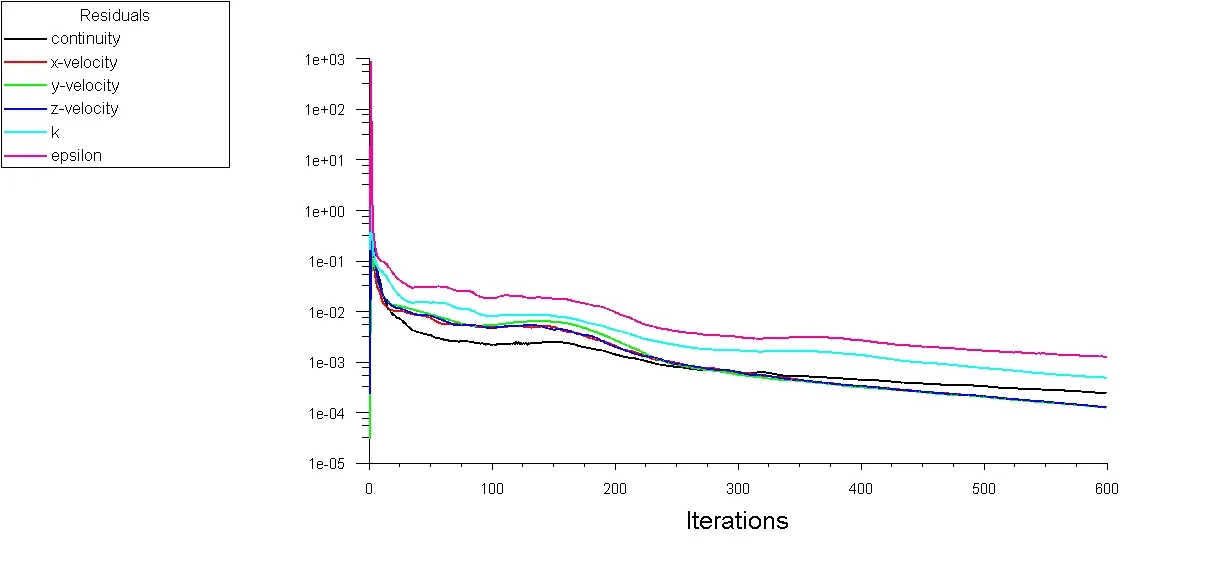
Figure 13, convergence plot for flow velocity 4m/s. Figure 14, convergence plot for flow velocity 5m/s.
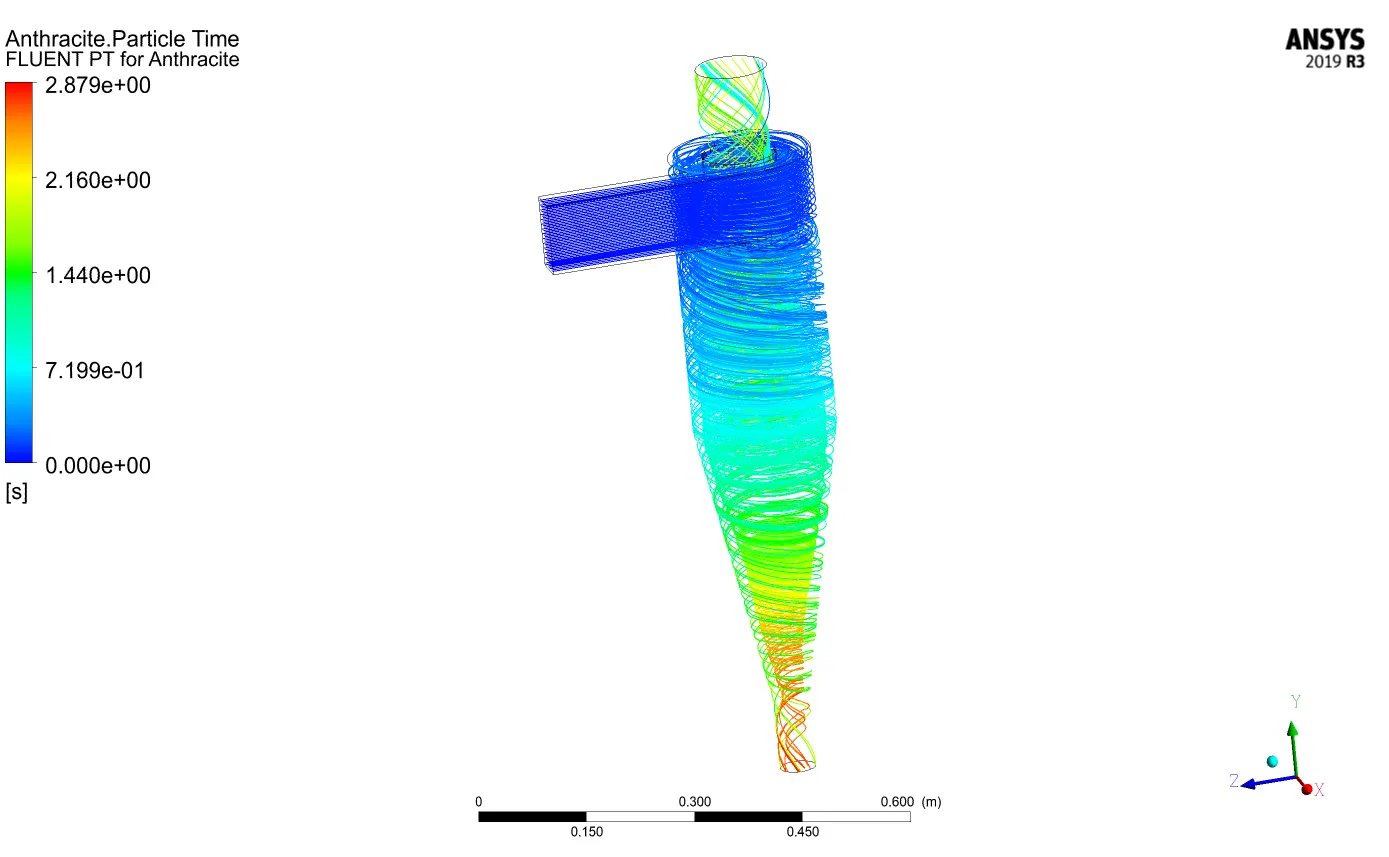
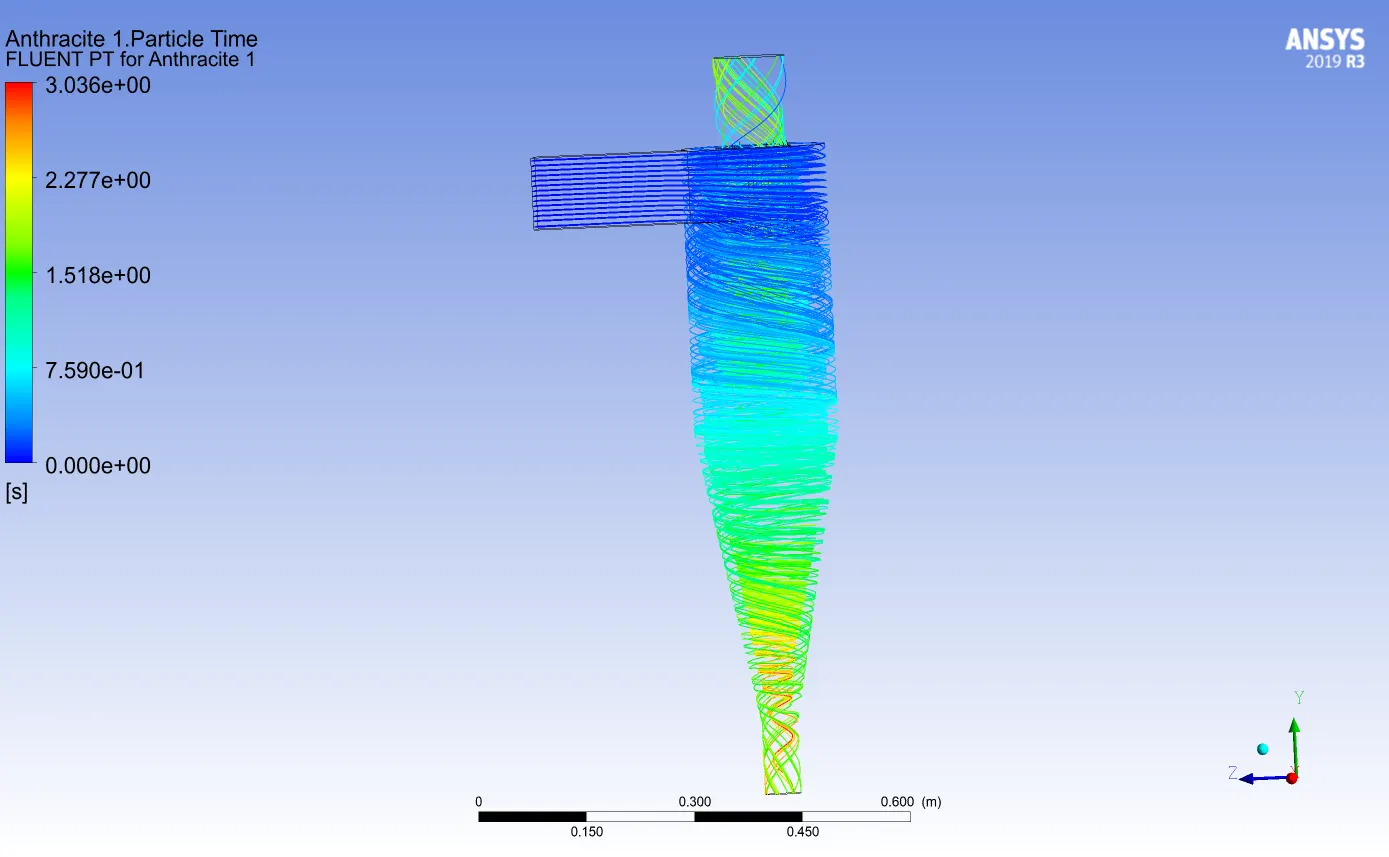
Figure 15, Particle track data for dia 1 `mu`m. Figure 16, Particle track data for dia 2 `mu`m.
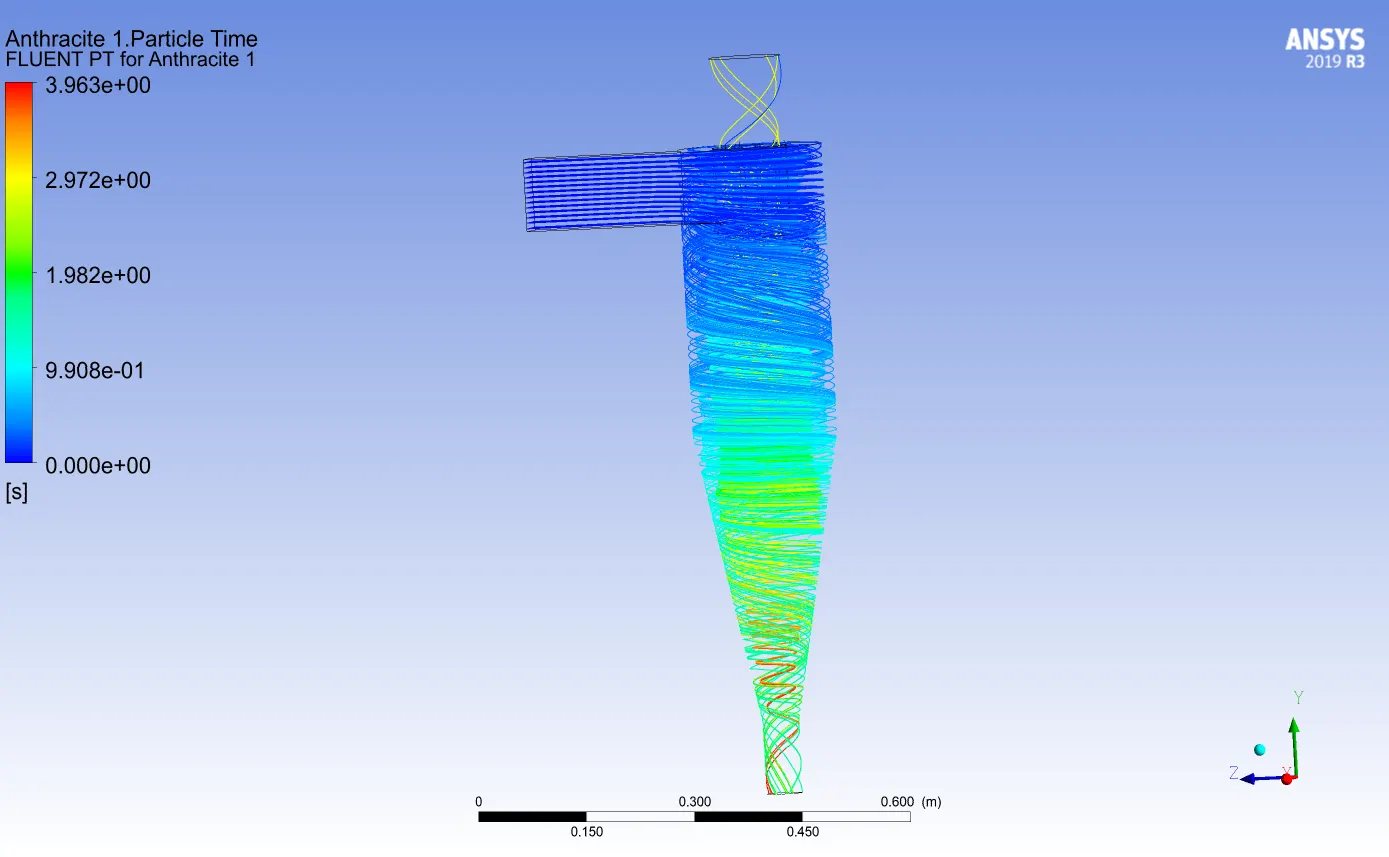
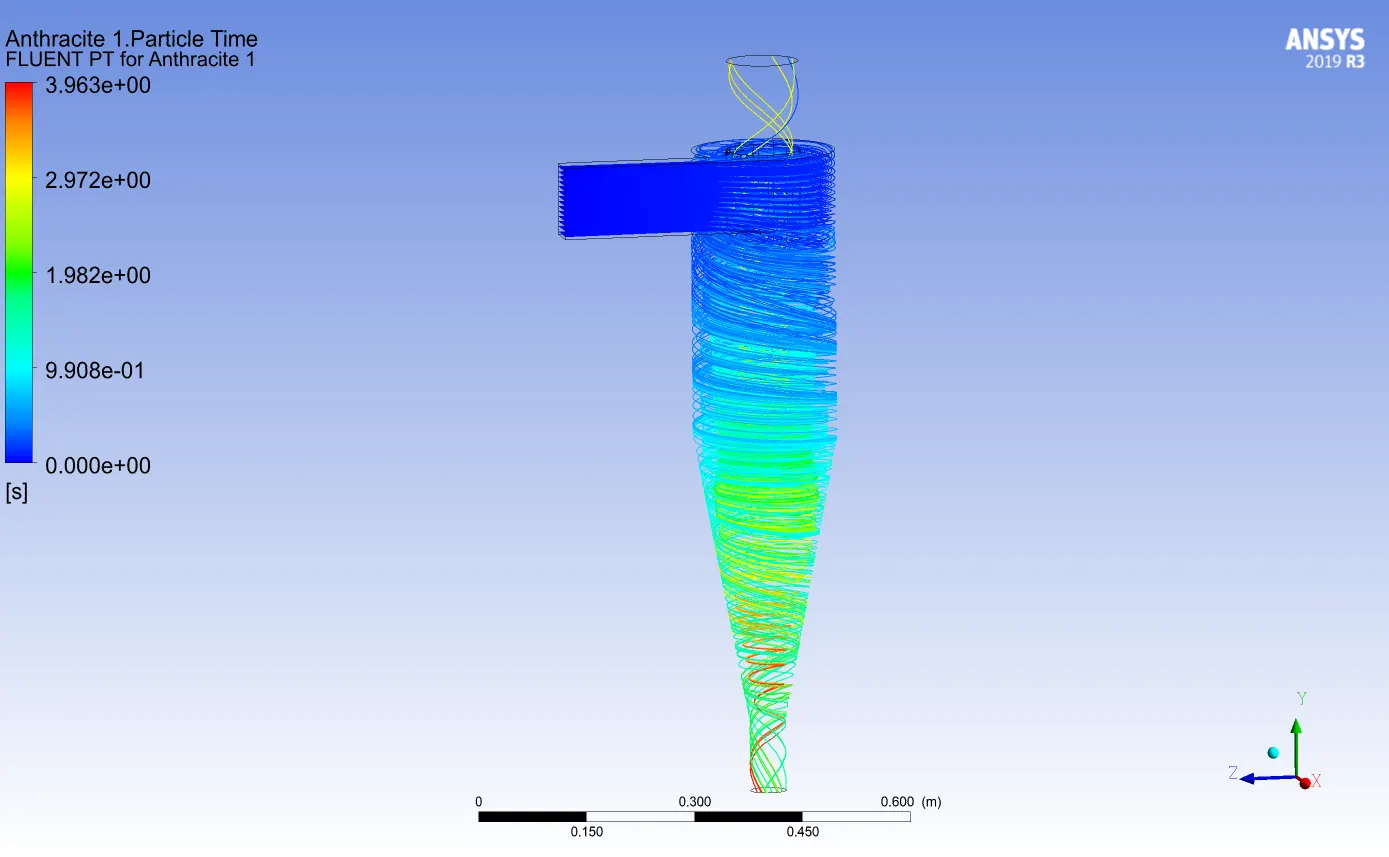
Figure 17, Particle track data for dia 3 `mu`m. Figure 18, Particle track data for dia 4 `mu`m.
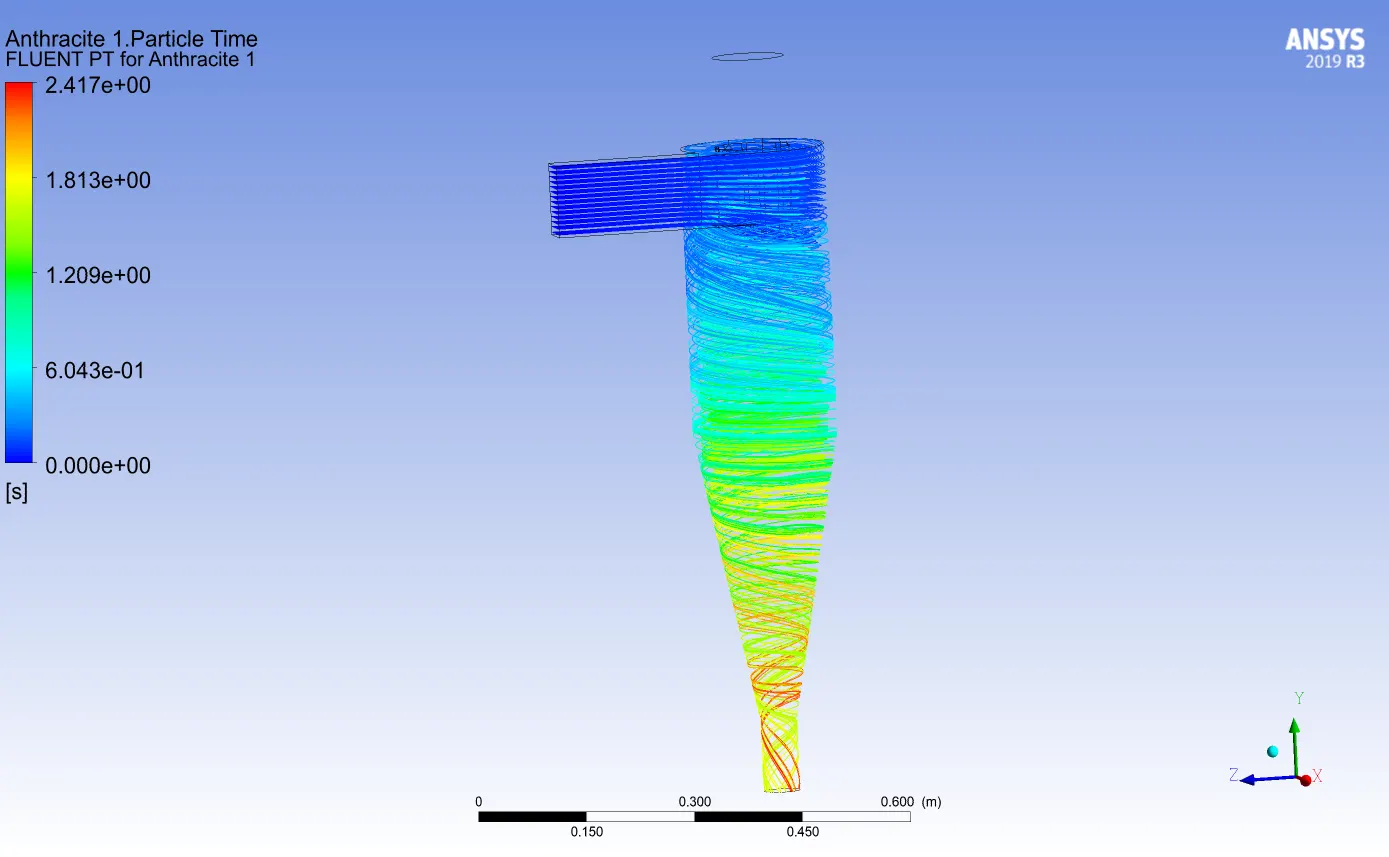
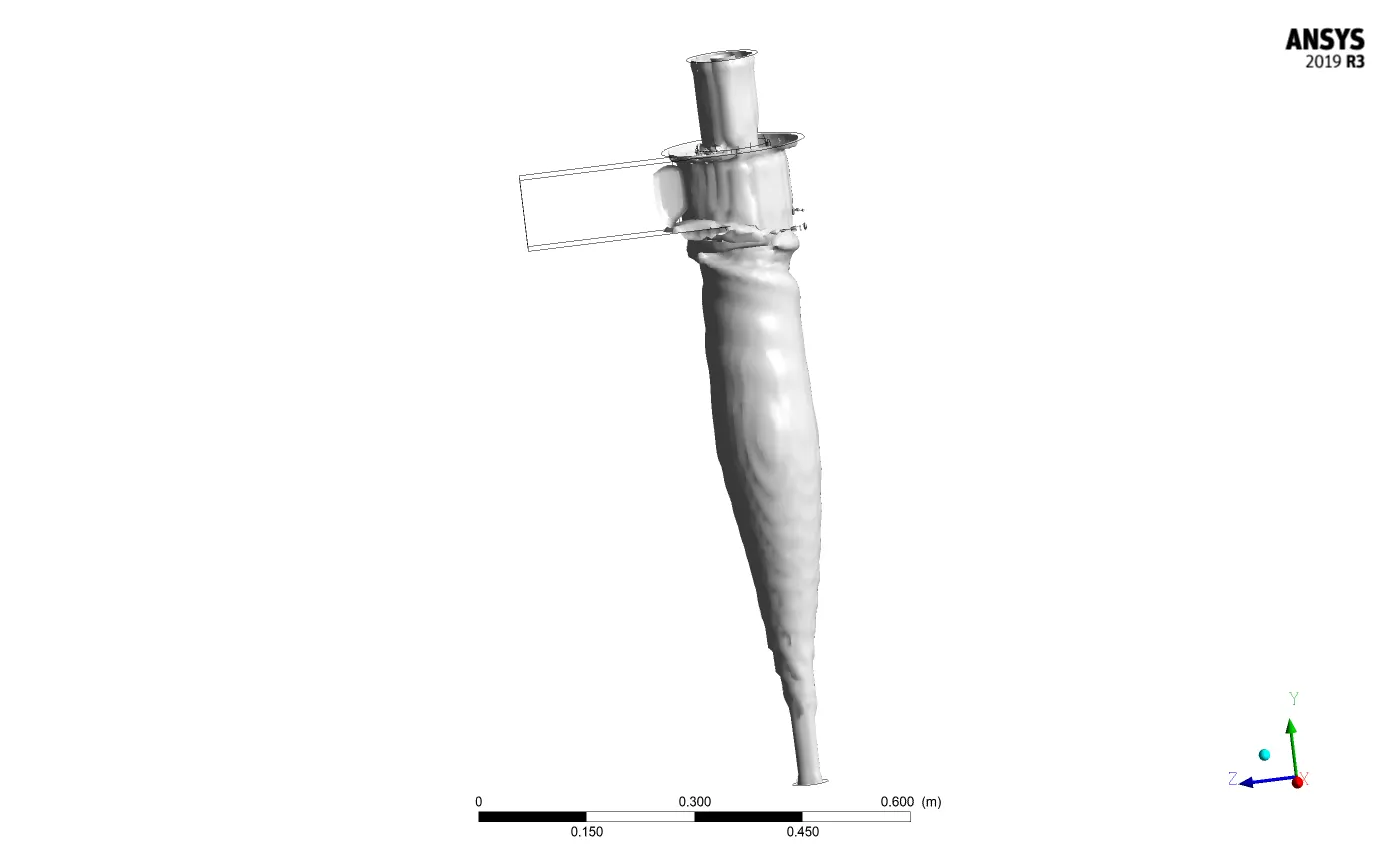
Figure 19, Particle track data for dia 5 `mu`m. Figure 20, Vortex core region for dia 1 `mu`m.
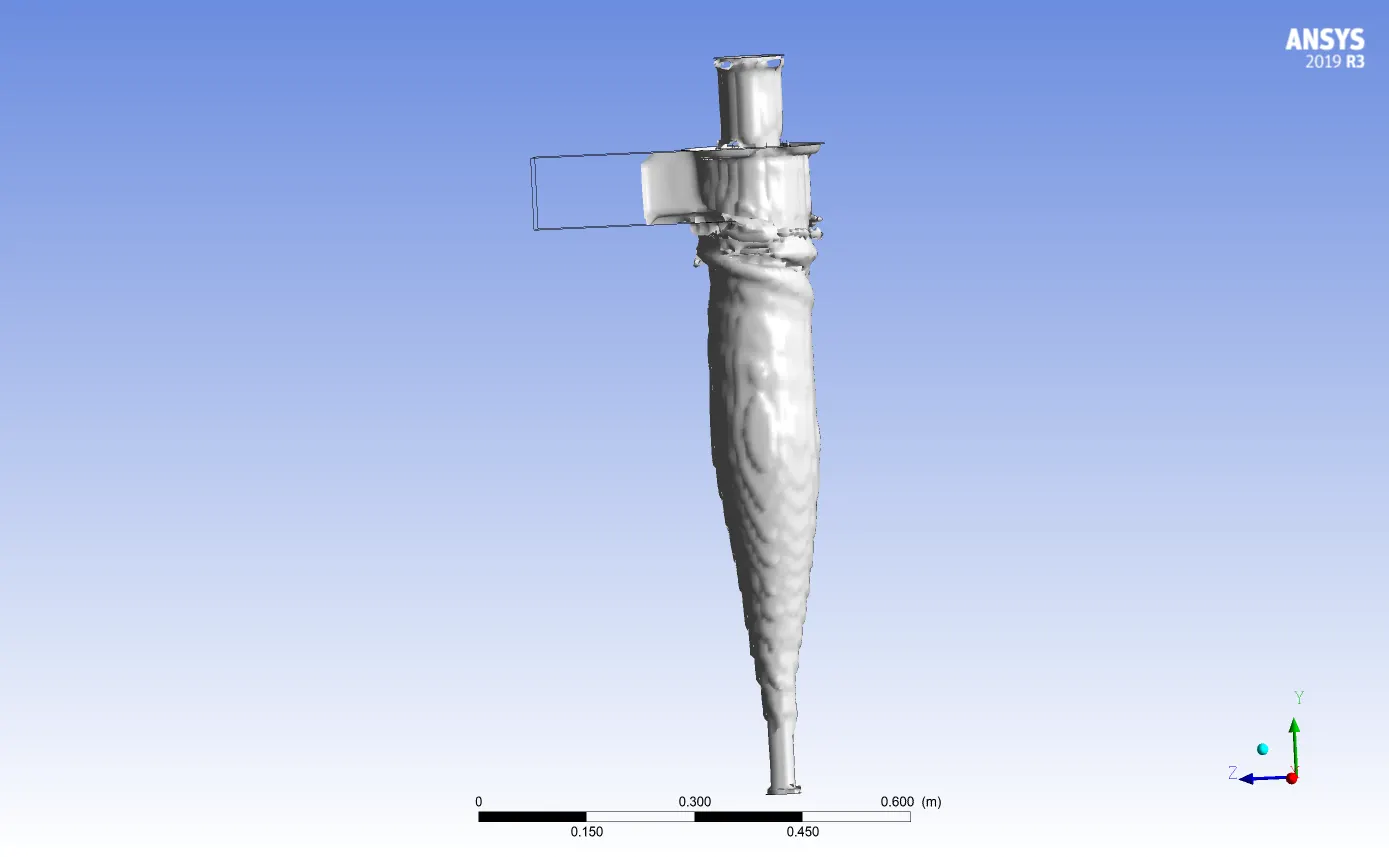
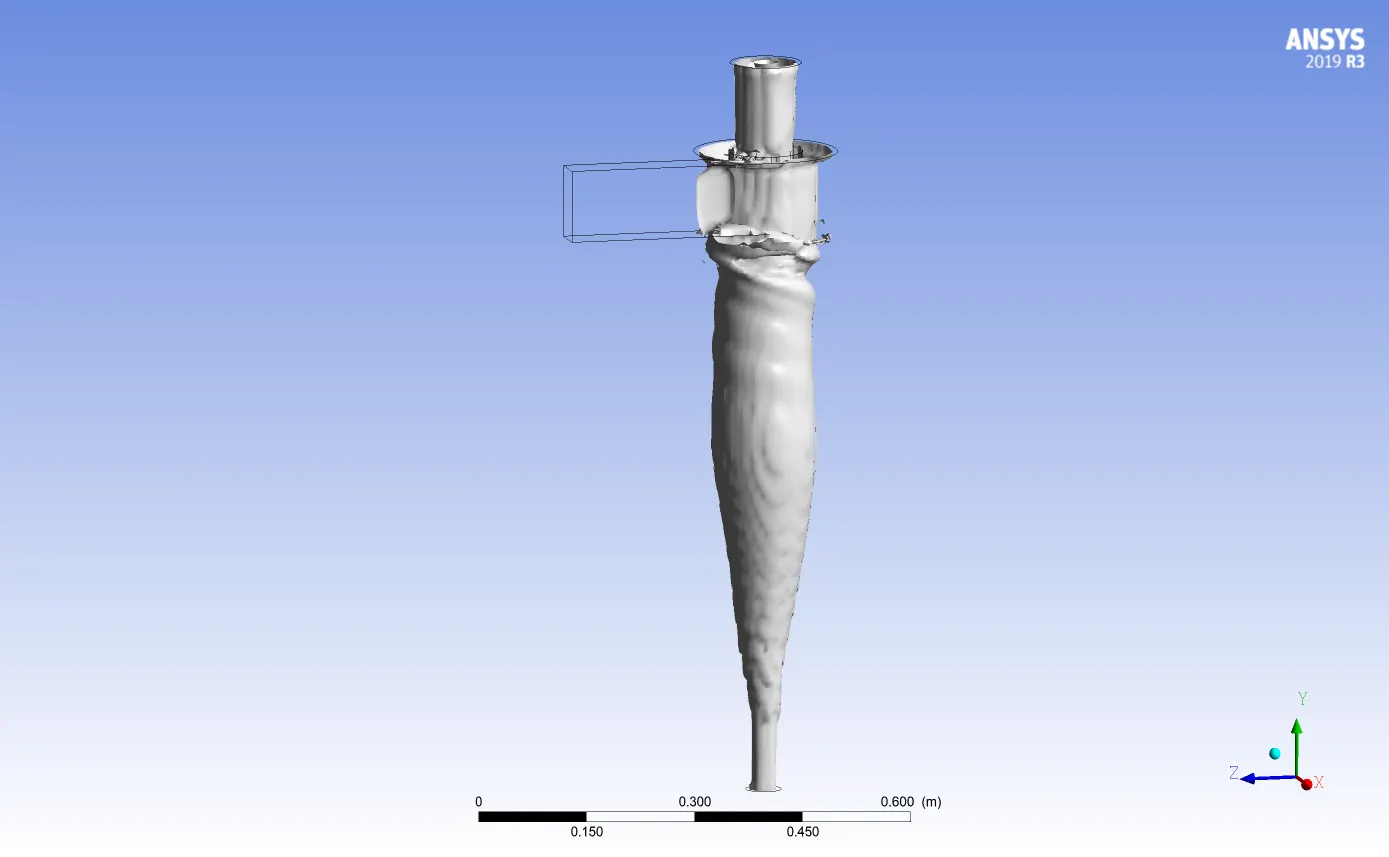
Figure 21, Vortex core region for dia 2 `mu`m. Figure 22, Vortex core region for dia 3 `mu`m.
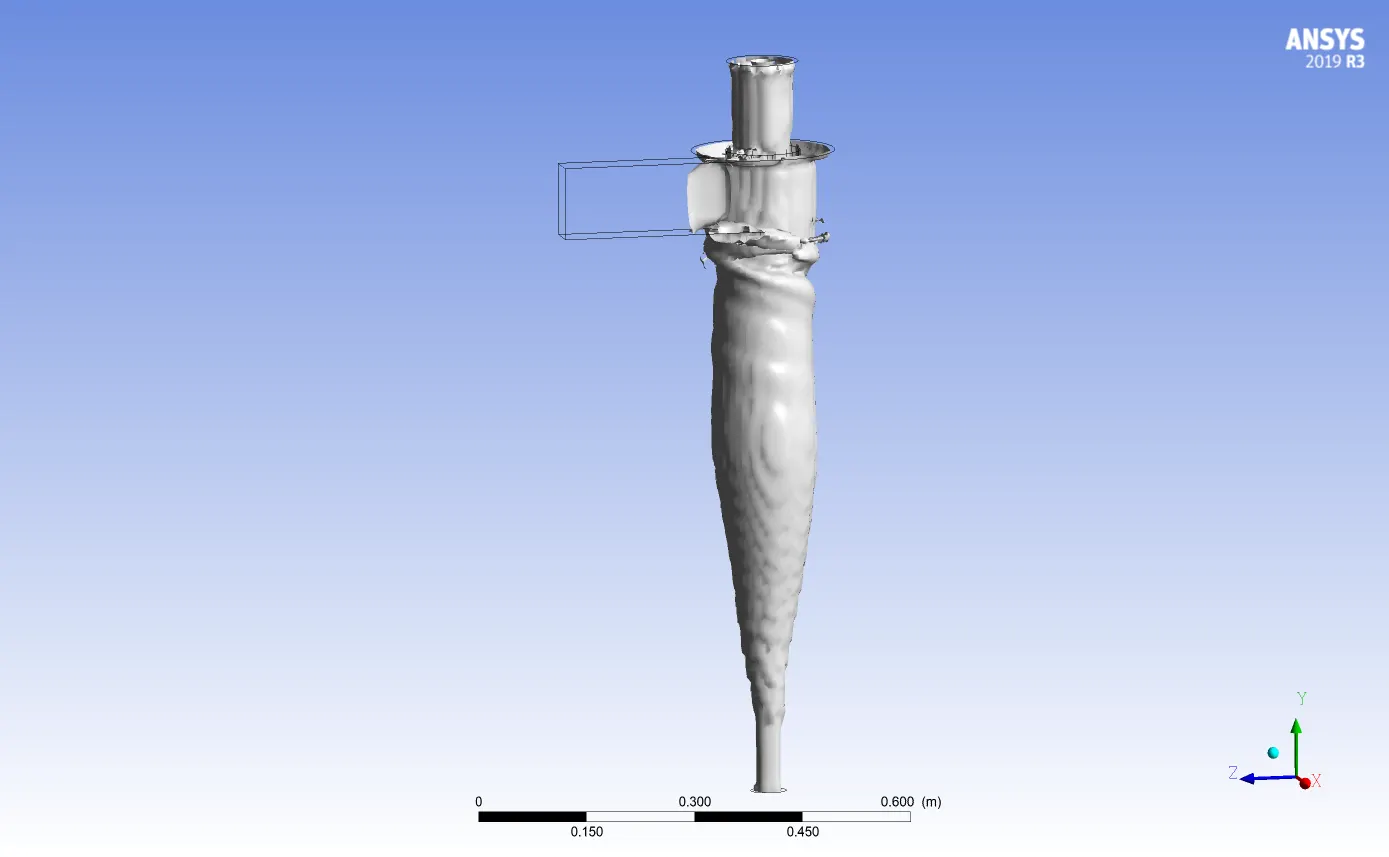
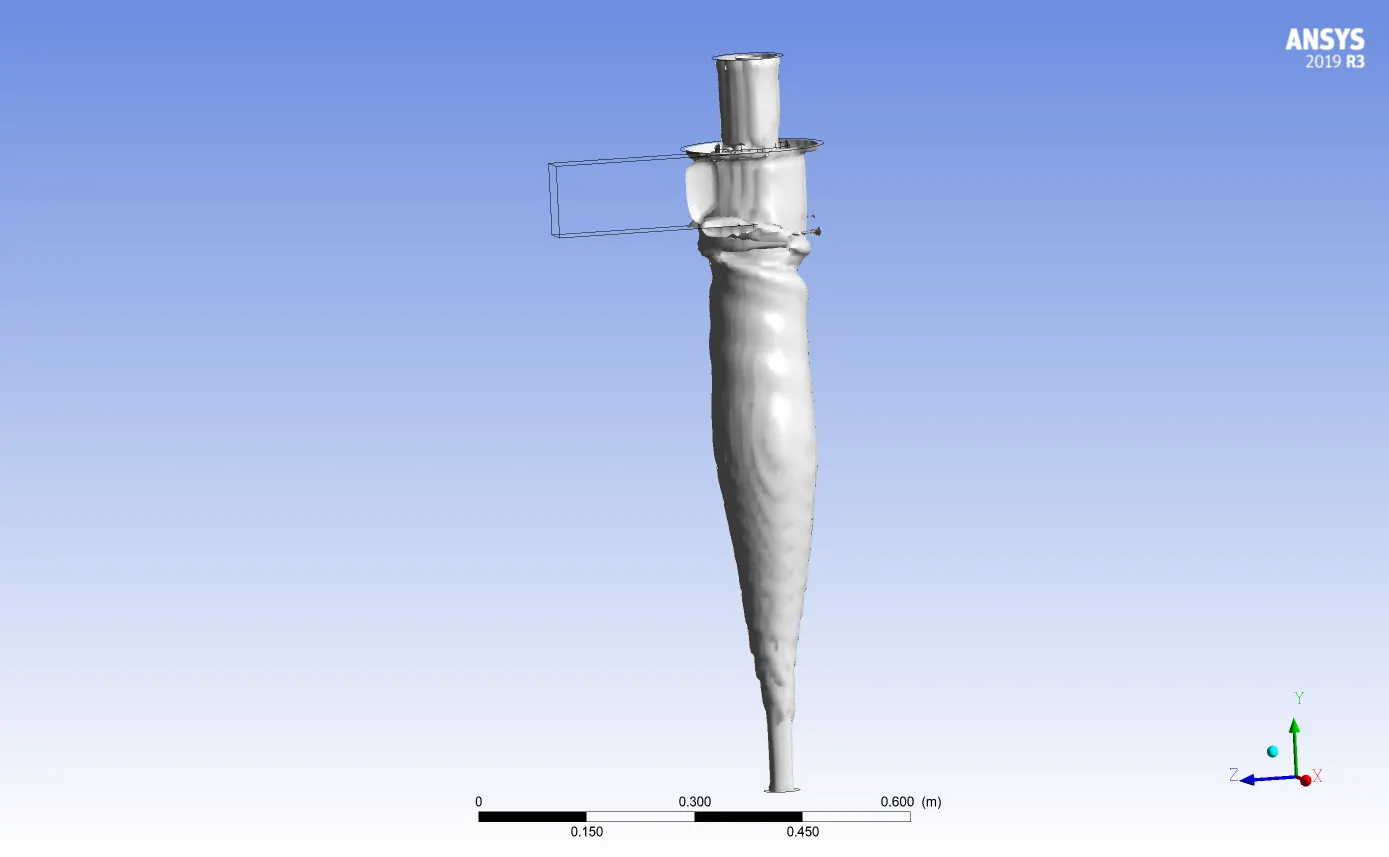
Figure 23, Vortex core region for dia 4 `mu`m. Figure 24, Vortex core region for dia 5 `mu`m.
For Case 2 we see the same result as the particle size is fixed to 5mm but flow and particle velocity from 1m/s to 5 m/s. Figure 25 to 29 shows the increasing velocity respectively. Also by computing inlet and outlet pressure we can see as that velocity increasing the pressure drop is also increasing respectively. So in our selected design parameter pressure drop is high. Lot of pressure is wasted dur to internal friction. Vortex core region is also shown from Figure 30 to 34.
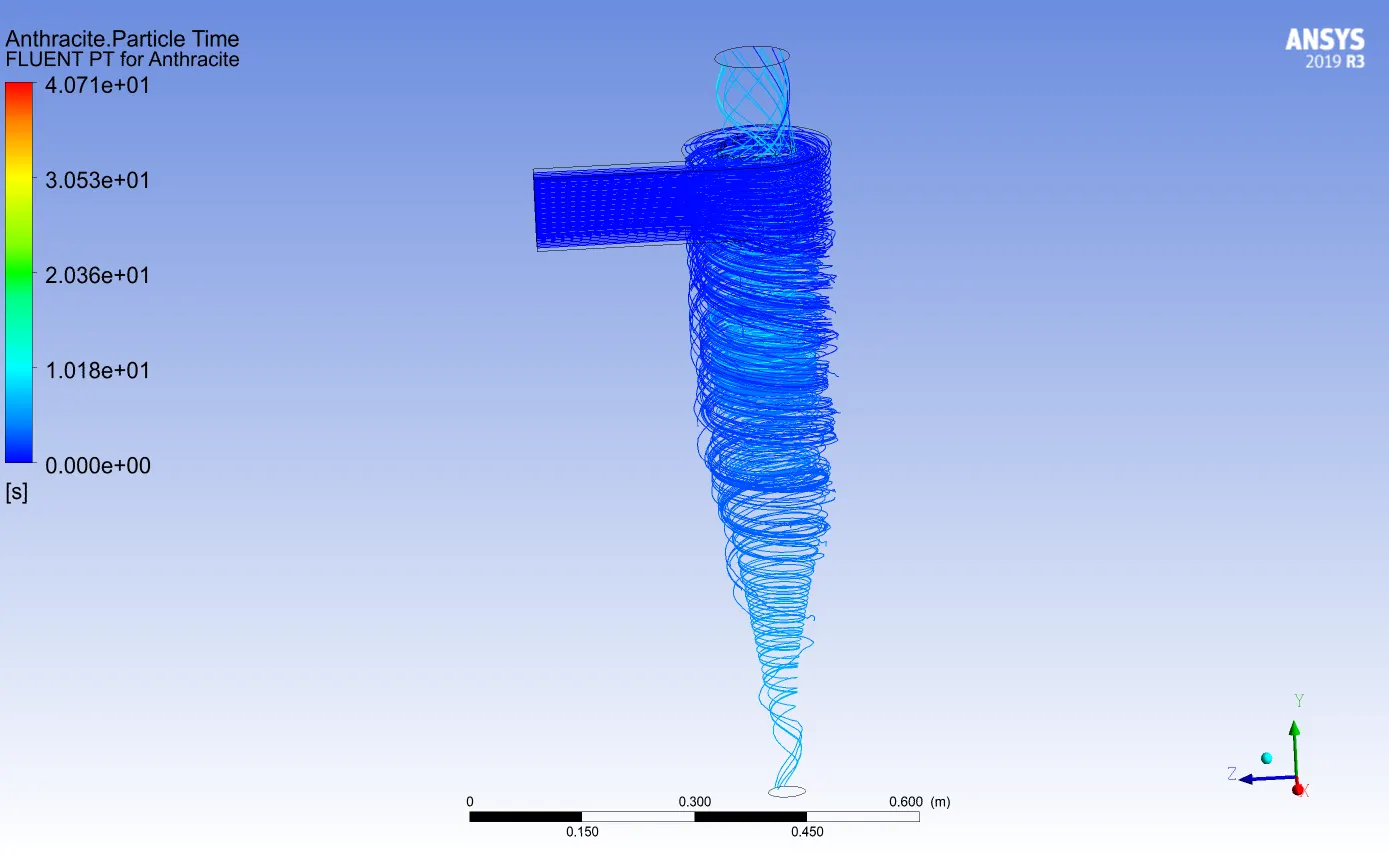
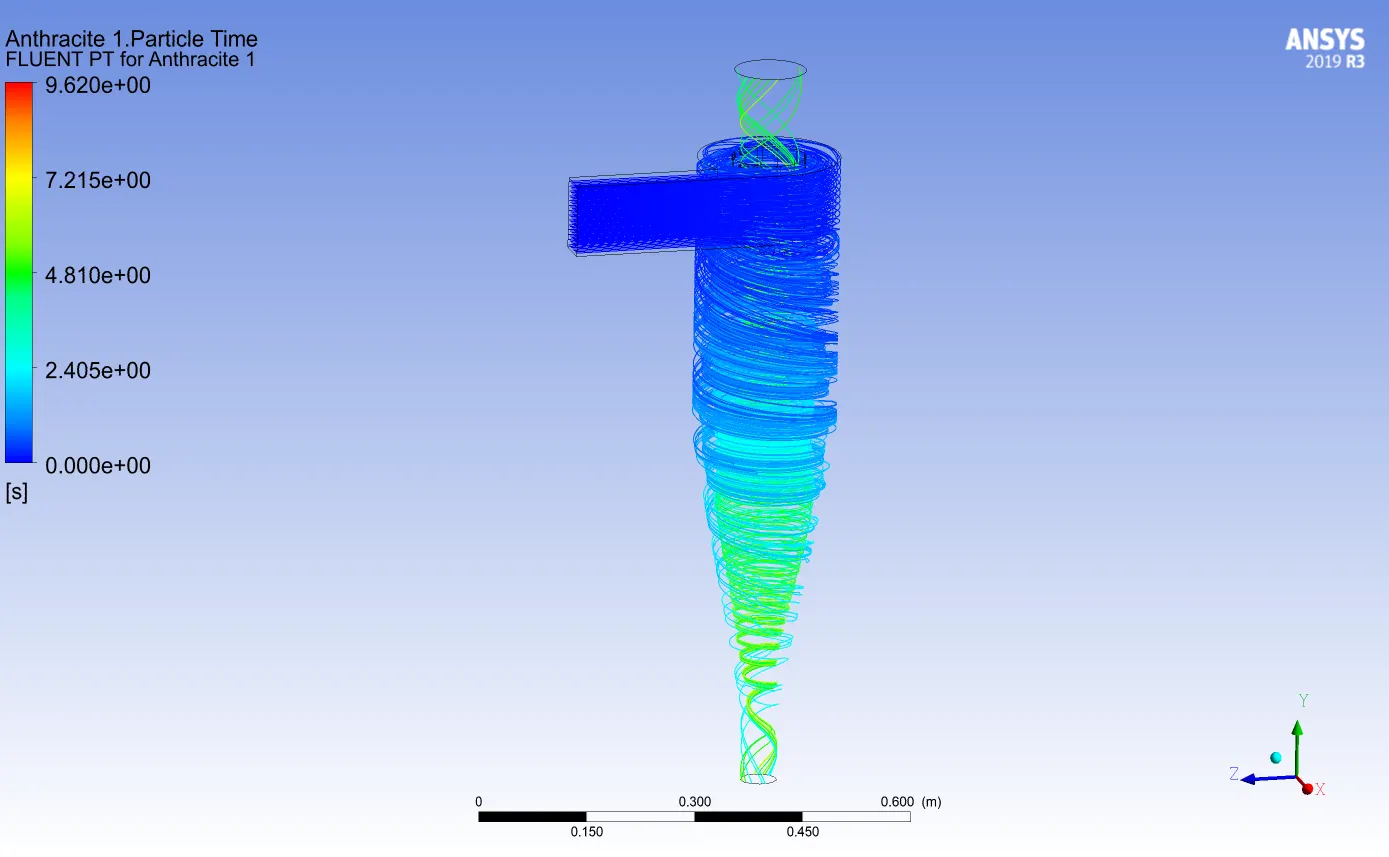
Figure 25, Particle track data for flow velocity 1m/s. Figure 26, Particle track data for flow velocity 2m/s.
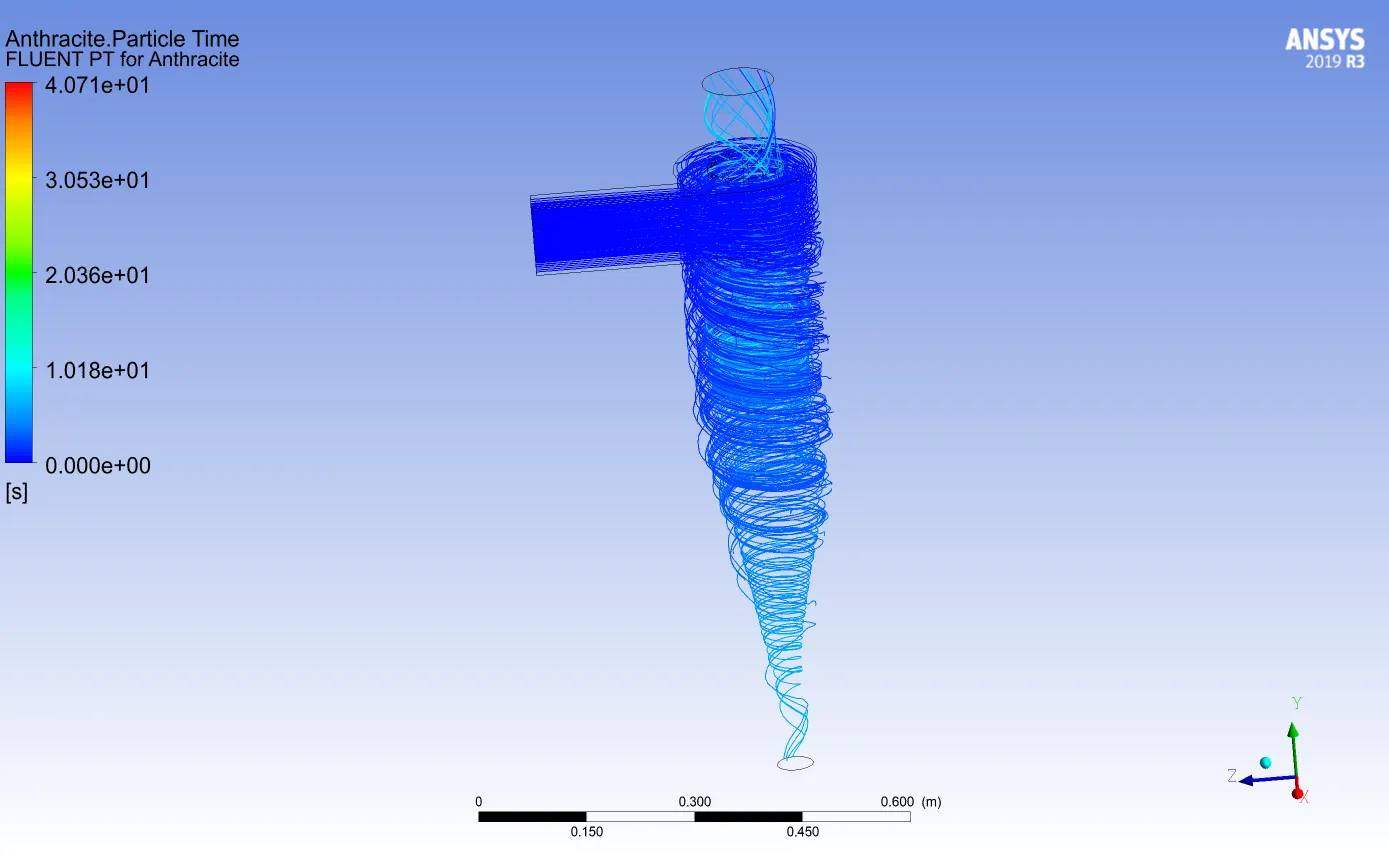
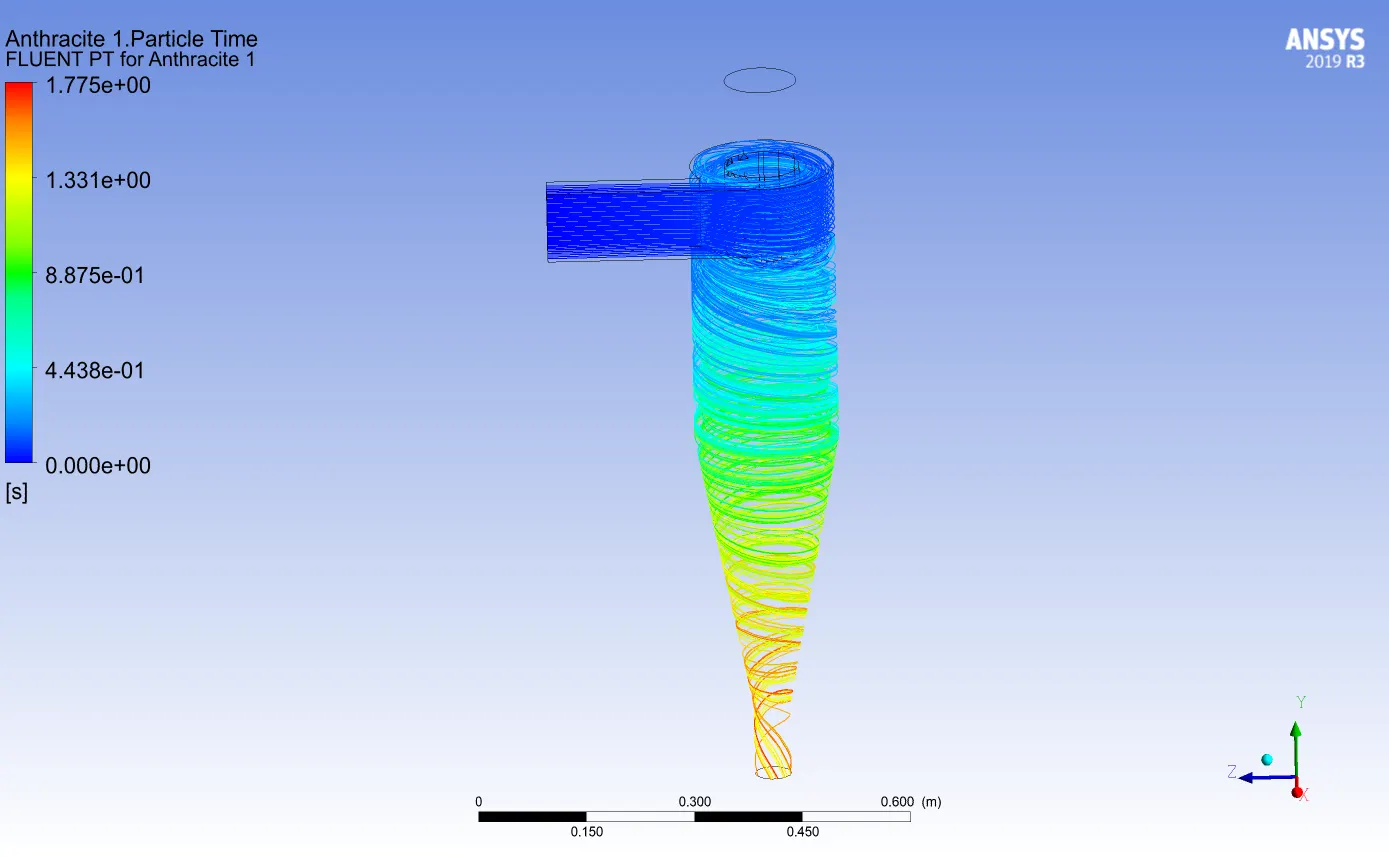
Figure 27, Particle track data for flow velocity 3m/s. Figure 28, Particle track data for flow velocity 4m/s.
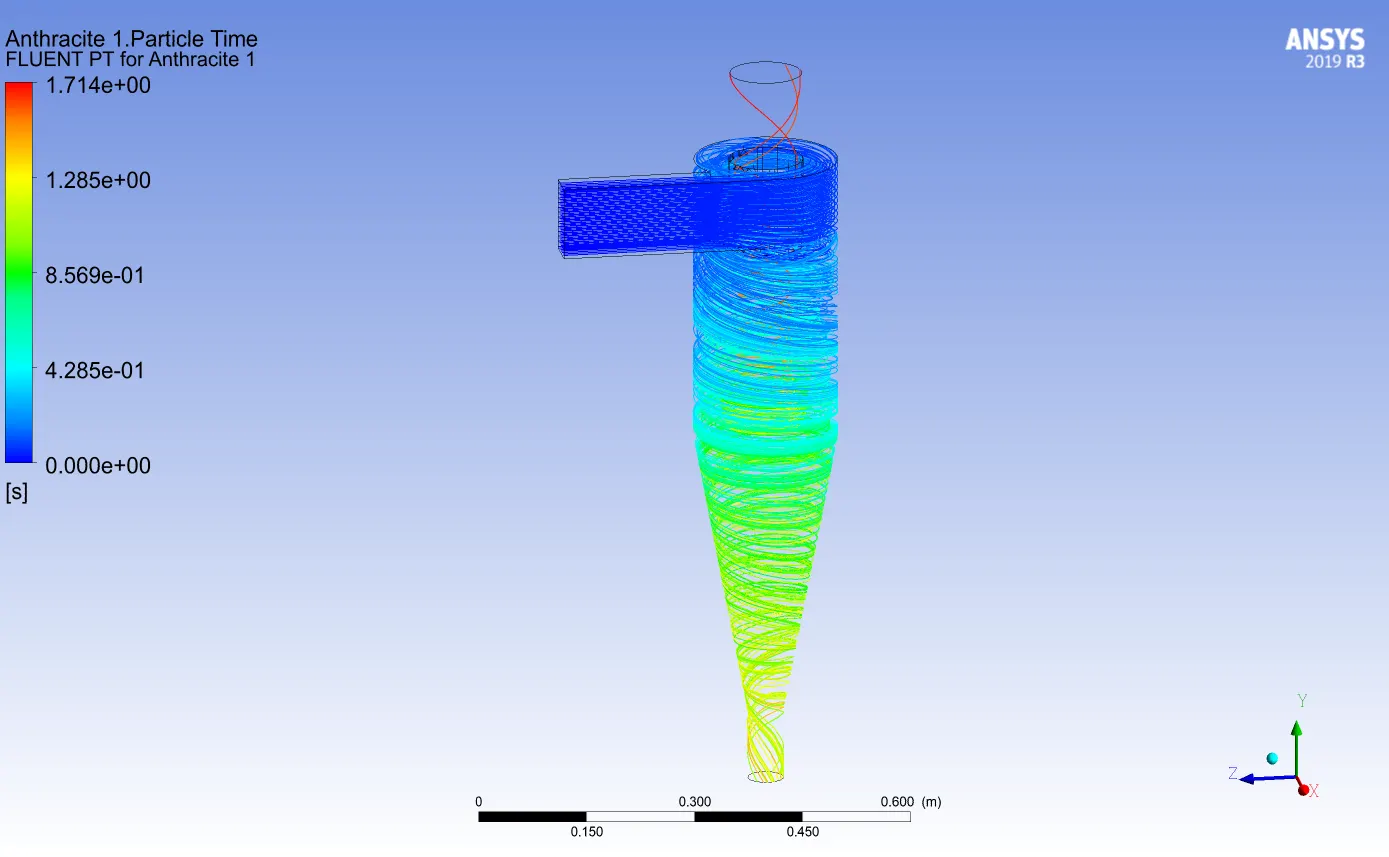
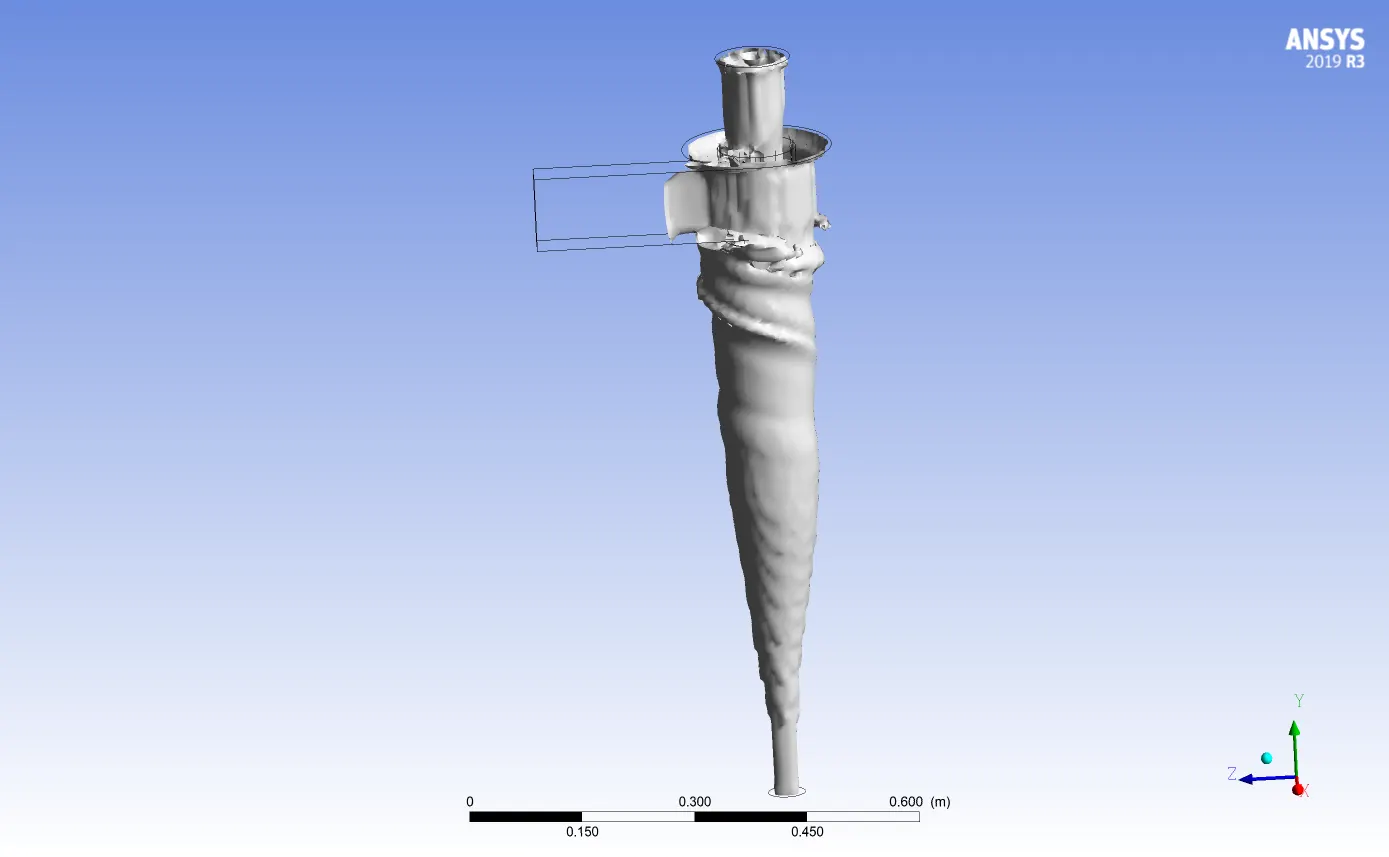
Figure 29, Particle track data for flow velocity 5m/s. Figure 30, Vortex core region for flow velocity 1m/s.
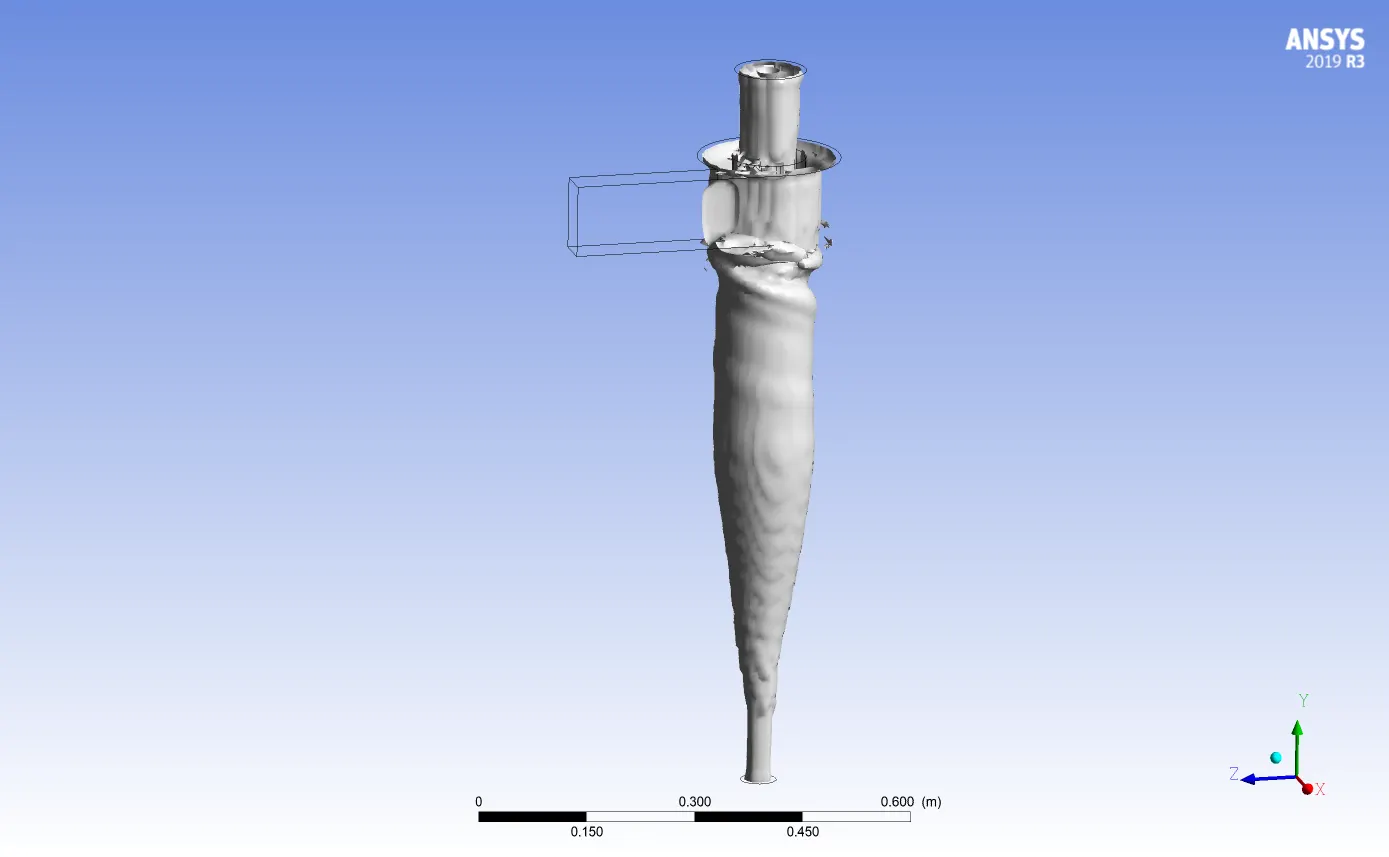
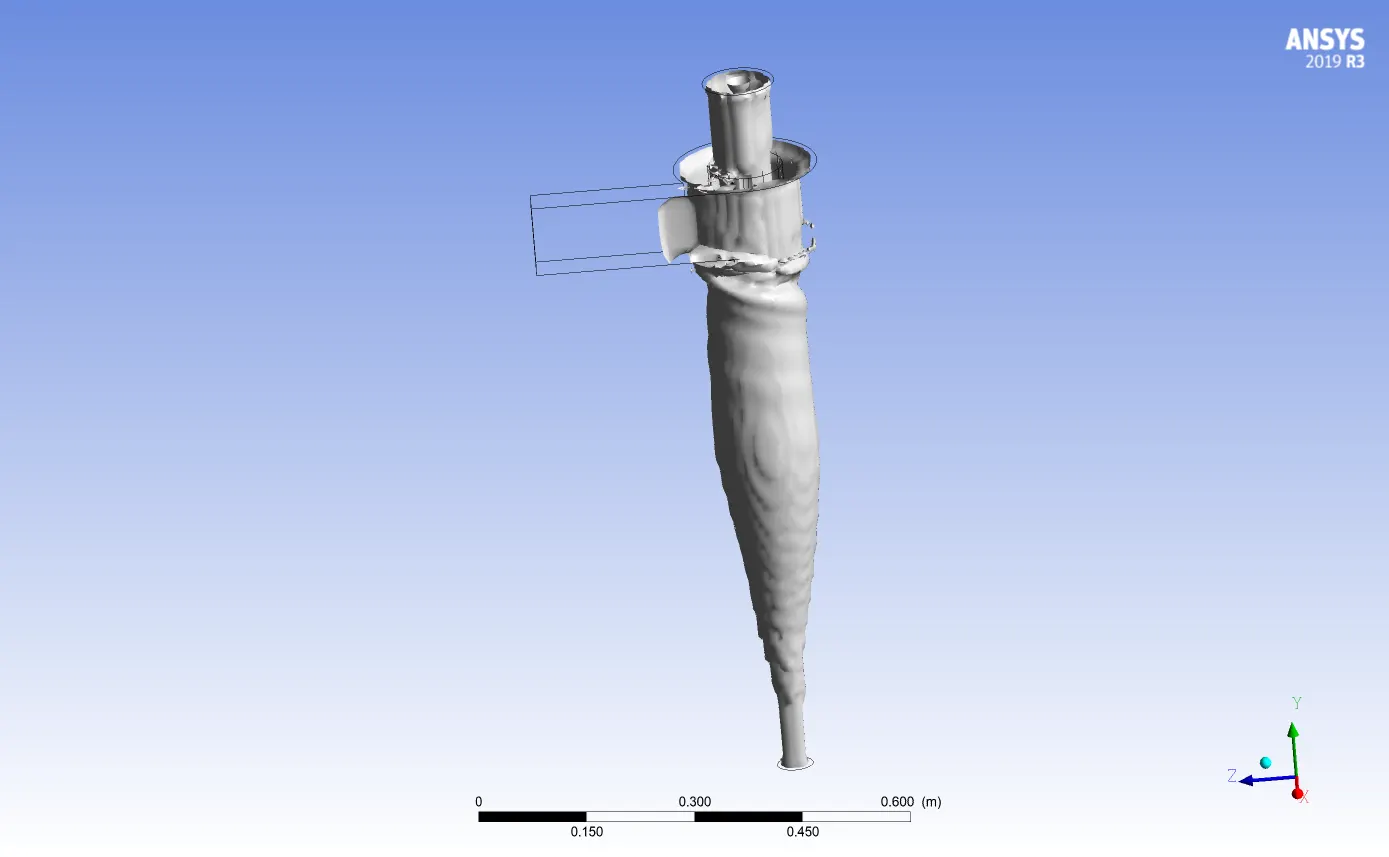
Figure 31, Vortex core region for flow velocity 2m/s. Figure 32, Vortex core region for flow velocity 3m/s.
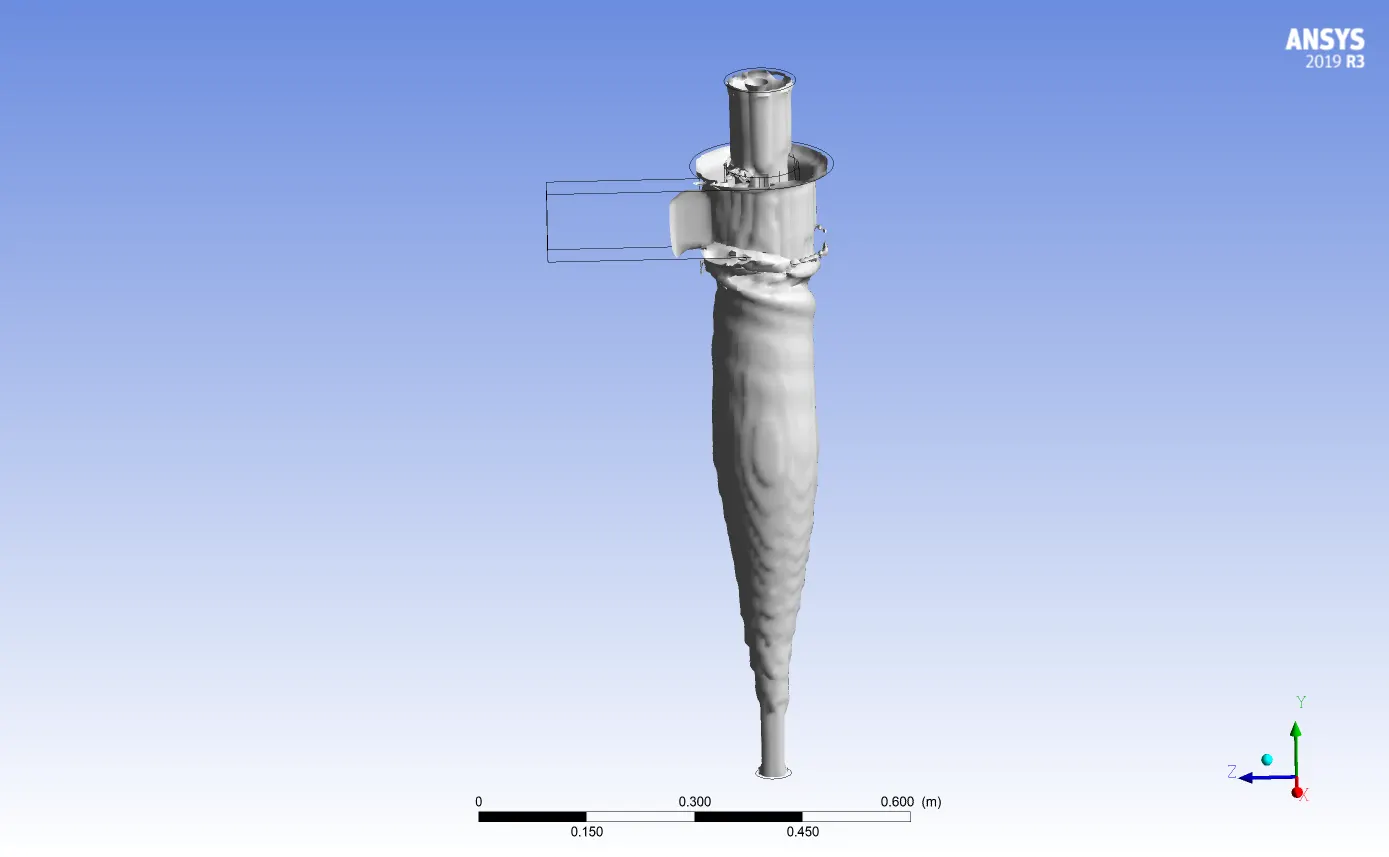
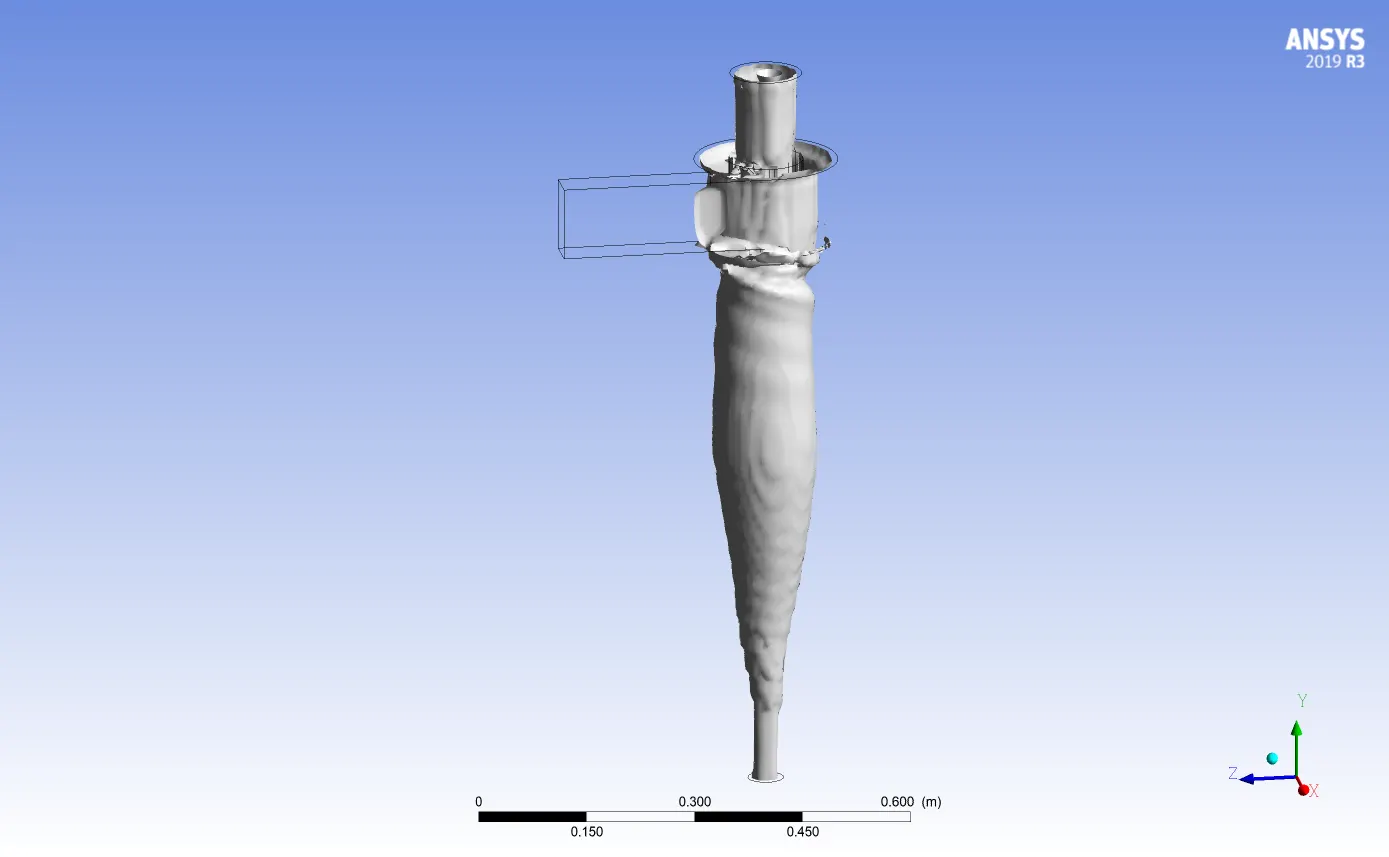
Figure 33, Vortex core region for flow velocity 4m/s. Figure 34, Vortex core region for flow velocity 5m/s.
Conclusion:-
Thus, we have concluded that cyclone separator is one of the most significant emission control devices. The fact preventing its use is the increasing pressure drop. From the literature survey, we find that pressure drop can be decreased by changing the geometrical dimensions. A desired result has been obtained according to cyclone separator efficiency and pressure drop for all above defined cases. From the above result we get maximum efficiency of 40.9% if we increase the particle diameter to 5mm with flow velocity of 3m/s. and for Case 2 we get maximum efficiency of 47.8% with flow velocity of 5 m/s and particle diameter of 5mm. the pressure drop in above case is maximum of 75.251 Pa. from the contour we can find the particle track data and vortex core region.