Cyclone Separator Challenge
JORGE LOZANO
Advanced CFD using ANSYS Fluent
Cyclone Separator Challenge
Perform an analysis on a cyclone separator and calculate the separation efficiency and pressure drop.
Objective: -
- To write a few words about any four empirical models used to calculate the cyclone separator efficiency.
- To perform an analysis on a given cyclone separator model by varying the particle diameter from 1 μm to 5 μm and calculate the separation efficiency in each case. Discuss the results. [Use both the velocity's as 3m/sec.]
- To perform an analysis on a given cyclone separator model by varying the particle velocity from 1 m/sec to 5 m/sec and calculate the separation efficiency and pressure drop in each case. Discuss the results. [Use particle diameter size as 5 μm for all cases & keep flow velocity same as particle velocity]
Boundary Conditions: -
Inlet and wall: - Reflect
Outlet (Top): - Escape
Outlet (Bottom/dustbin) - Trap
Note: Structural mesh gives the best results, so you can use cut cell meshing approach available in Ansys Meshing.
Cyclones simulation theory
Parnell model:
Cyclone separator is a method of removing particulate from an air, gas or liquid stream without the use of filters, through vortex separation. Rotational effects and gravity are used to separate mixtures of solids and fluids. The method can also be used to separate fine droplets of liquid from a gaseous stream.
Parnell (1996) addressed problems associated with the design of cyclones using the classical cyclone design (CCD) process and presented the Texas A&M cyclone design process (TCD) as an alternative. The TCD approach to design cyclones was to initially determine optimum inlet velocities (design velocities) for different cyclone designs. The design inlet velocities for 1D3D, 2D2D, and 1D2D cyclones are 16 m/s ±2 m/s (3200 ft/min ±400 ft/min), 15 m/s ±2 m/s (3000 ft/min ±400 ft/min), and 12 m/s ±2 m/s (2400 ft/min ±400 ft/min), respectively. This design process allows an engineer to design the cyclone using a cyclone inlet velocity specific to the type of cyclone desired.
IOZIA AND LEITH MODEL
An empirical model for predicting pressure drop across a cyclone, developed by Dirgo (1988), is presented. The model was developed through a statistical analysis of pressure drop data for 98 cyclone designs. The model is shown to perform better than the pressure drop models of Shepherd and Lapple (1940), Alexander (1949), First (1949), Stairmand (1949), and Barth (1956). This model is used with the efficiency model of Iozia and Leith (1990) to develop an optimization curve which predicts the minimum pressure drop and the dimension ratios of the optimized cyclone for a given aerodynamic cut diameter, rf50. The effect of variation in cyclone height, cyclone diameter, and flow on the optimization is determined. The optimization results are used to develop a design procedure for optimized cyclones.
Leith & Licht method
The method presented gives approximate results and should not be used for detail design. It is presented to illustrate the principles of designing a cyclone and for a rough estimation of the design performance. A specialized company should always be consulted for detail design prior to construction of a cyclone.
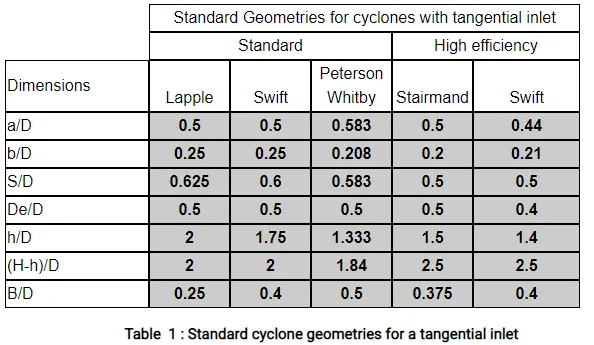
Cyclones efficiency is directly related to their geometry, which has been the object of various research. From these research papers, a set of STANDARD dimensions have been defined. Those dimensions, or rather proportions, constitute the basis of most of the design across the industry. It is recommended to keep those standard configurations, or some adaptation by reputable suppliers, and not modify it. Specific design can still be developed for specific high value applications (FCC for example) but it goes beyond the methodology presented here, requiring modulization, pilot trials...etc...
The table below is due to Koch and Licht (1977) and is summarizing the work of different authors (Lapple, Stairmand...)
Zhao Method:
The collection efficiency and flow characteristics of a gas-solid cyclone were obtained by numerical analysis. Two different approaches of modeling the solids have been studied in this work, aiming to obtain the fractional collection efficiency curve. These methods were referred to as E-E and E-En. The first consists in simulating several times a regular Eulerian-Eulerian flow with a different particle diameter each time. The second is achieved by performing one single simulation simultaneously involving multiple solid phases, with different diameters.
One disadvantage of the traditional Eulerian-Eulerian approach is that the solid phase is given an average diameter, so that any information about particle size distribution is lost. Such information is very important in cyclone analysis because it provides design engineers with more complete information on collection efficiency in the form of the fractional collection efficiency curve. This work analyzes and compares two different methods for obtaining the mentioned curve while still retaining the E-E scheme. The first method (E-E) consists on performing a fixed number of simulations, with one particulate phase per simulation, varying particle diameter. Each time, it is considered that the single particulate phase represents the entire solid load fed to the cyclone, obtaining one point in the fractional collection efficiency curve per simulation. In the second method (referred to as E-En) one single simulation considering multiple solid phases of different diameters weighted according to the particle distribution is performed, thus directly obtaining an approximation of the fractional collection efficiency curve. A comparison on the accuracy and applicability of each method is made, and the results are validated by experimental data by Zhao [3].
SIMULATION SET-UP
To perform simulations using Ansys/Fluent it’s desirable to have knowledge in the type of fluid model to adjust the condition of velocity inlet and the particles size, mesh characteristics, and the data postprocessing. For this case several simulations will be performed variating in the mesh, and initial conditions, duplicating several simulations and modifying the unique variables, as in F.2.
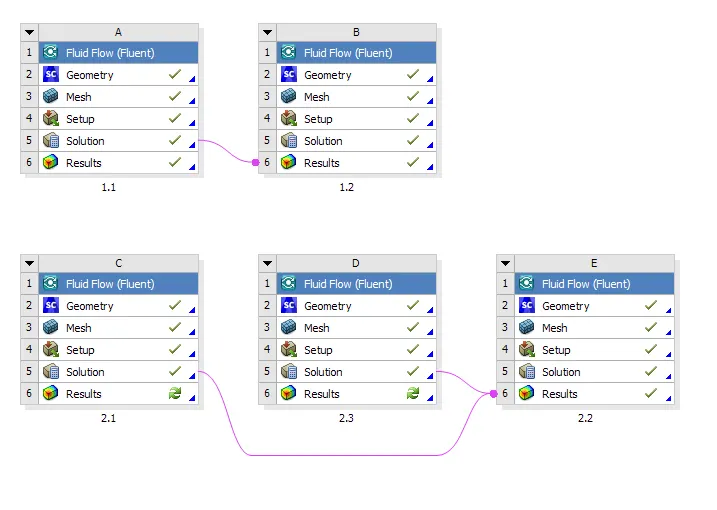
F.2 Simulation Set up
Mesh
For these simulations two meshes will be performed one performed with fine tetrahedral elements as in F.3, and the other one with a cut cell method as in F.4, which will be used to obtain the data from the other three cases. Considering a 512k element limit due to the educational software, the elements in both are 459310 elements for the tetrahedral mesh and 8337 for the cut cell mesh. Obtaining the quality with the skewness and orthogonality criteria, as both fair mesh obtained.
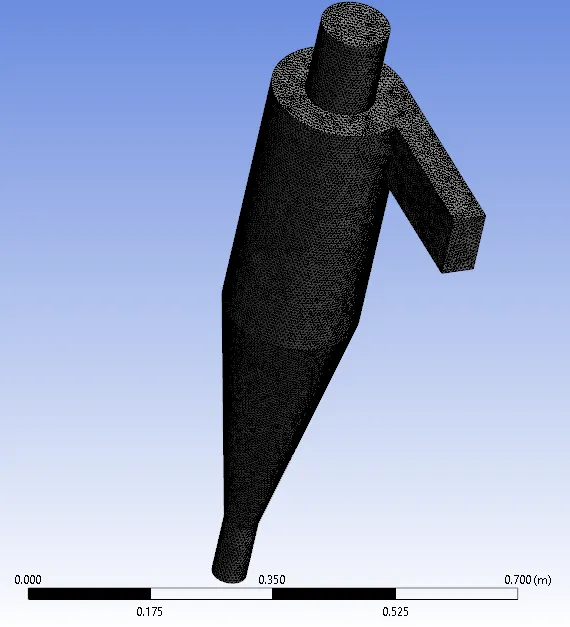
F.3 Tetrahedral mesh.
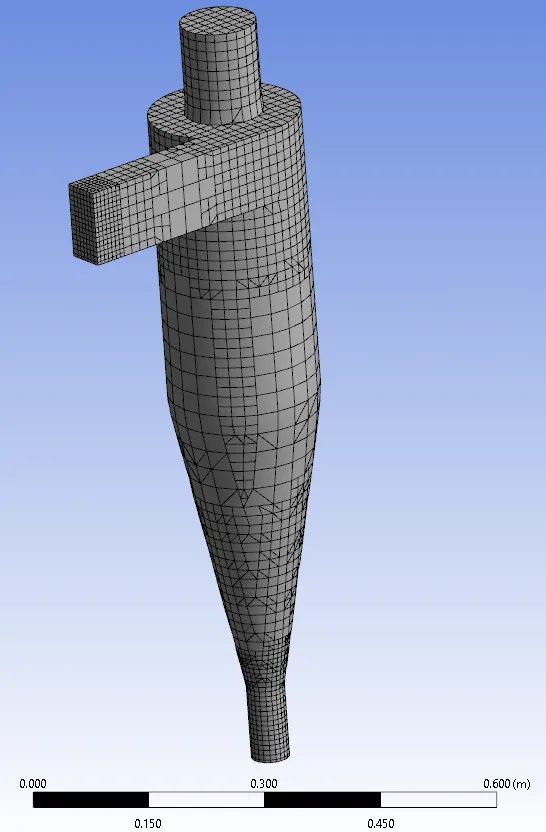
F.4 Cut cell mesh
The turbulence model selected is the K-epsilon method, although due to the vortices that will be created and the swirls, the model selected will be an RNG K-epsilon model, with a near wall treatment as a standard wall function applying a swirl dominated flow. As F.5 having the constant and options selected.
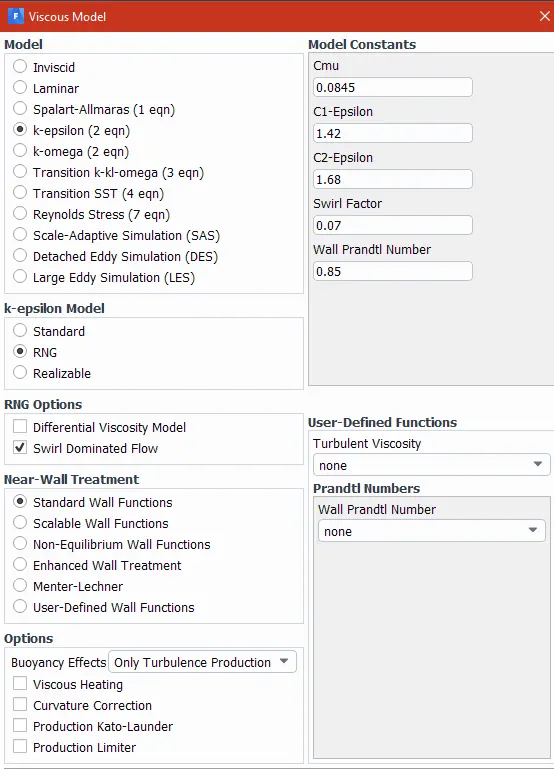
F.5 Turbulence model
Due to the properties and excepted results from these cases, a discrete phase model is selected, as an interaction with a continuous phase, calculating a DPM source every flow iteration, creating an injection in the inlet surface injection, with a anthracite material (standard material), having for the first case particles from 1e-6 m up to 5e-6 m as in F.6, with an inlet velocity of 3 m/s, having 10 interval diameters, and a mean diameter particle of 3e-6 m. For the following cases they’ll have a constant diameter of 5e-6 m and a variable constant velocity of 1, 3 and 5 m/s respectively as in F.7.
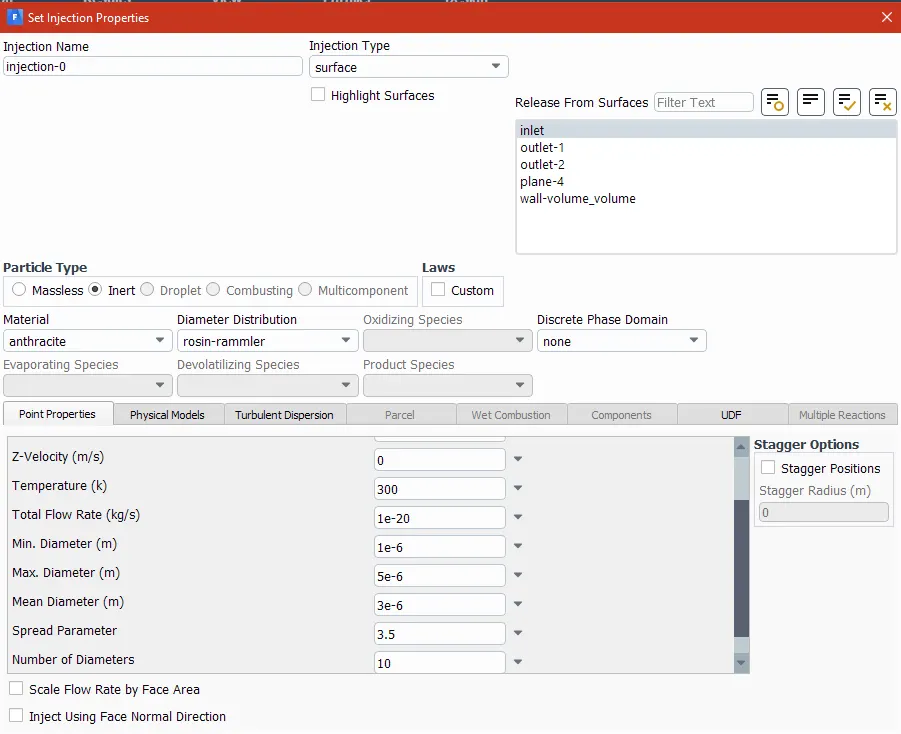
F.6 Injection properties case 1
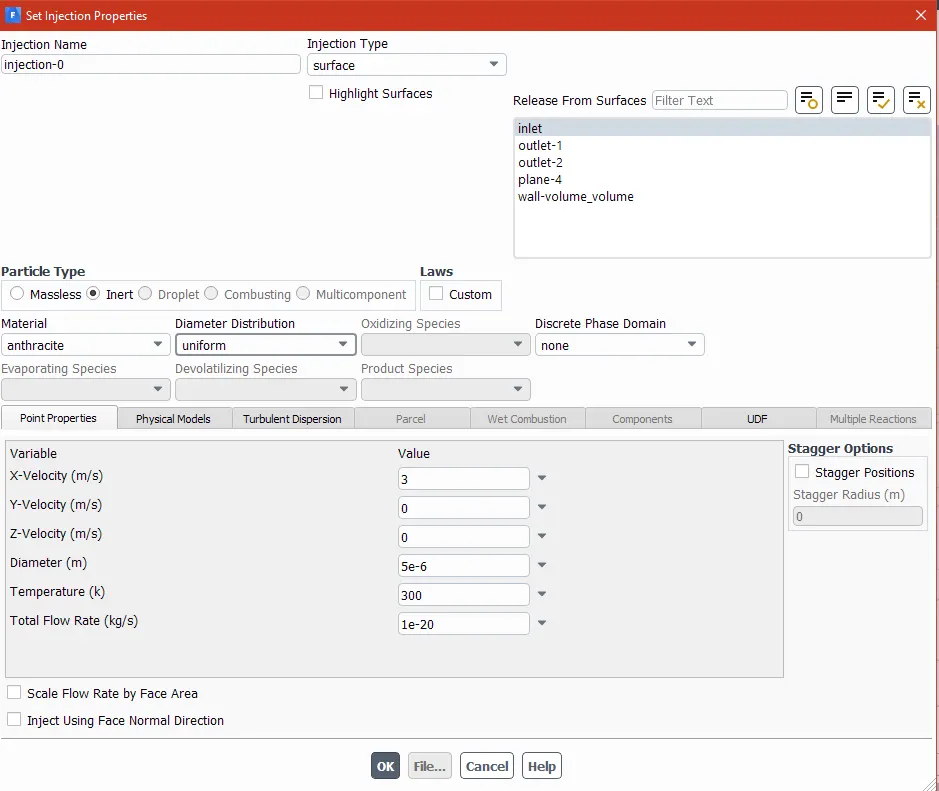
F.7 Injection properties case 2-5
The simulation will consider the requested boundary conditions, and will be initialized every time from the inlet, performing the simulation for 1000 iterations to obtain a convergence of desired results.
Results
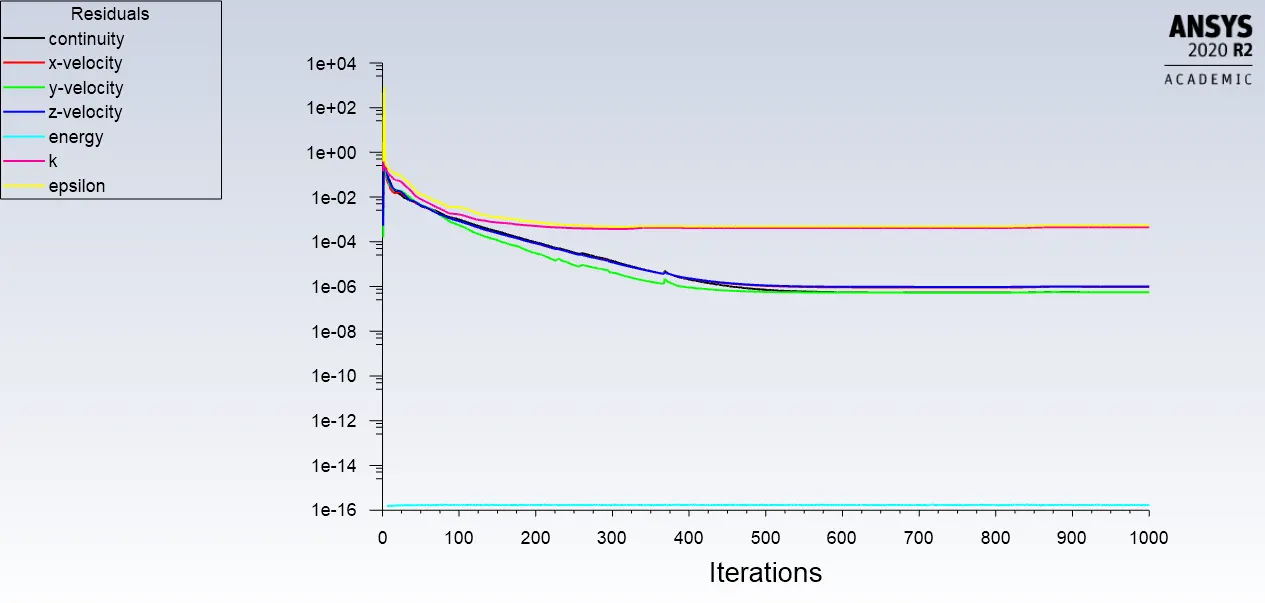
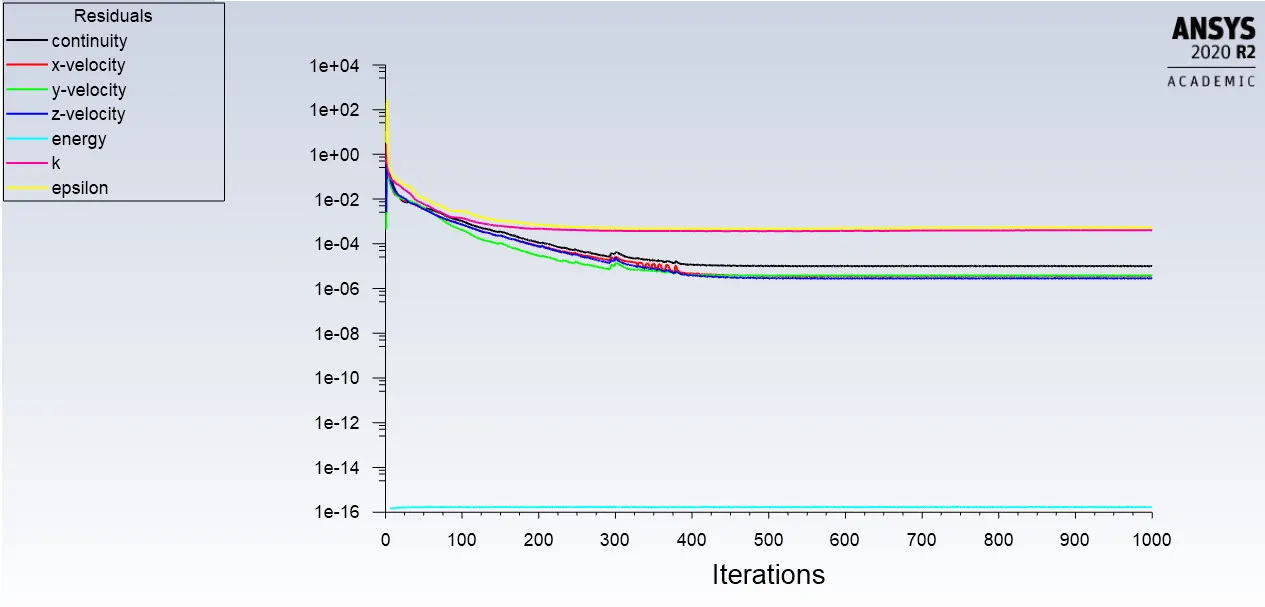
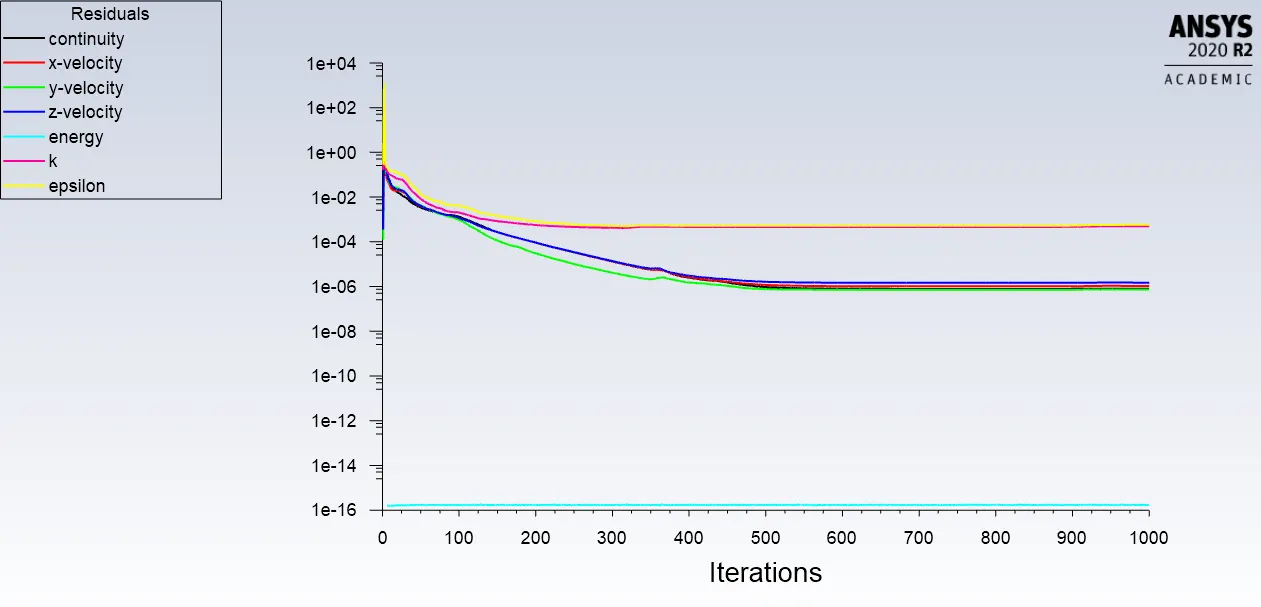
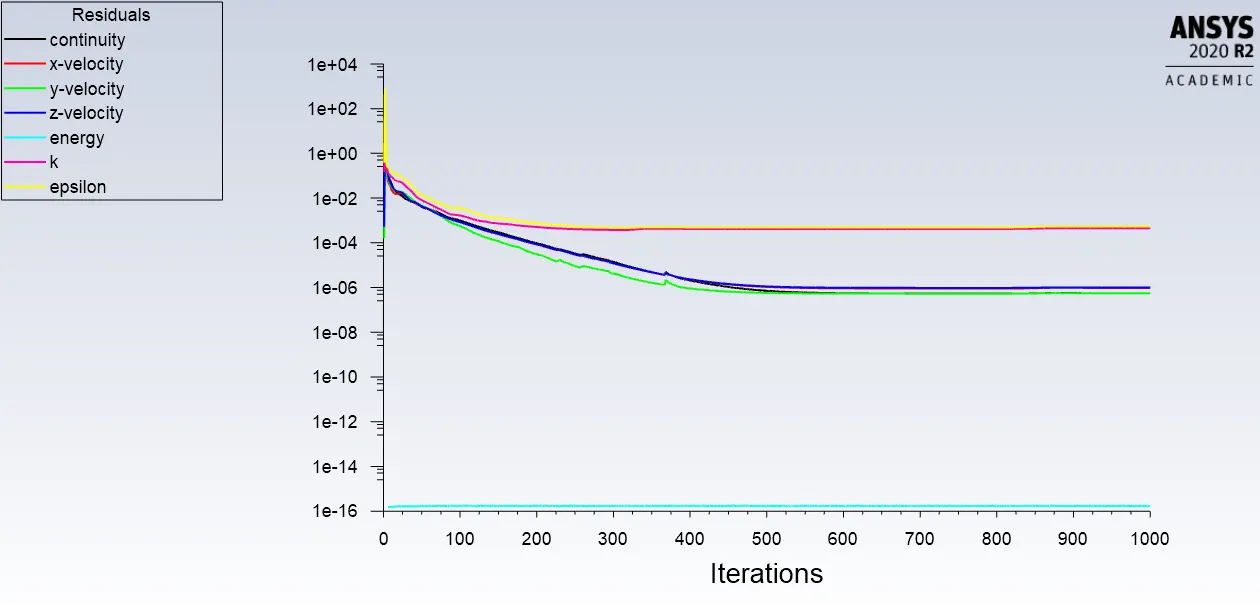
The following F.8 to F.12 will show the convergence of the results according to the residuals for the continuity, momentum, and energy equations in the k-epsilon turbulence model.
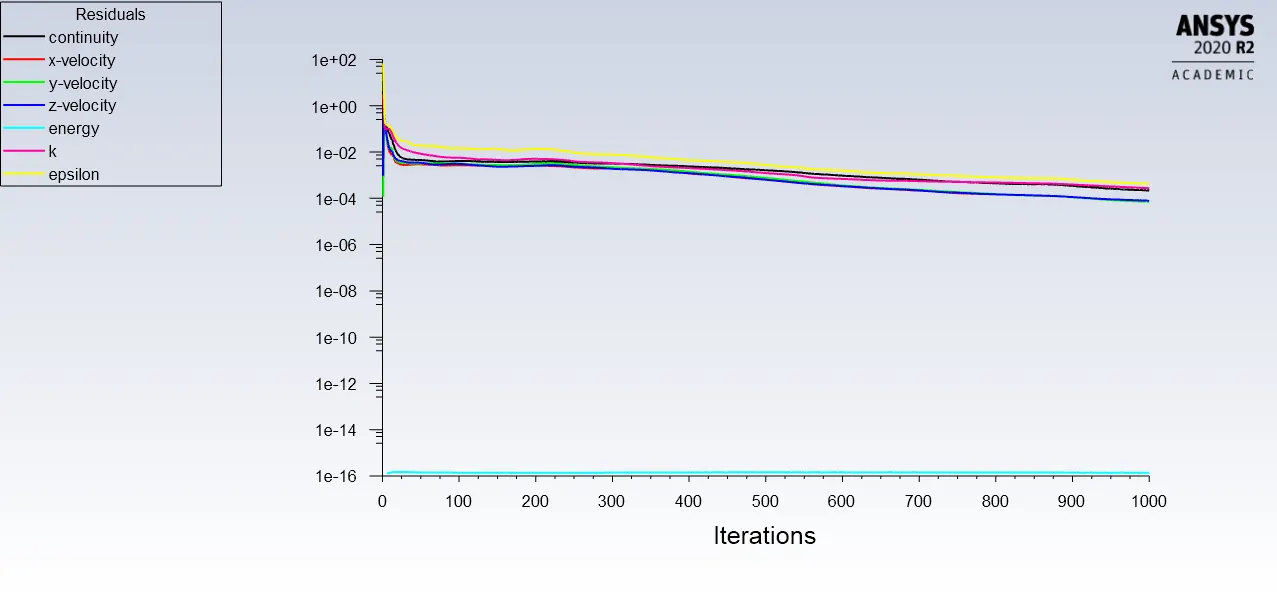
F.8 Residuals case 1
F.9 Residuals case 2
F.10 Residuals case 3
F.11 Residuals case 4
F.12 Residuals case 5
For the first and second case a comparison will be made, considering that the variation is only in the mesh, having the same setup.
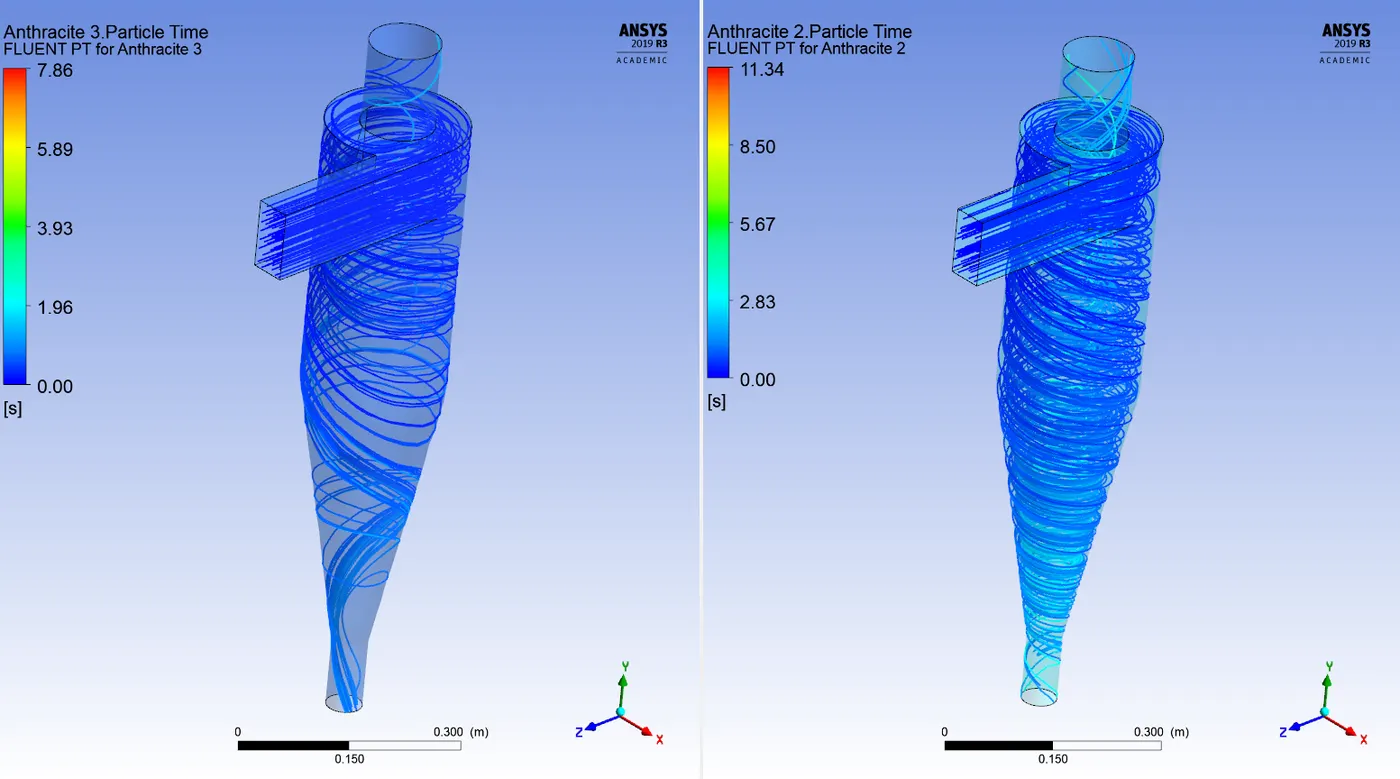
F.13 Particle Time track
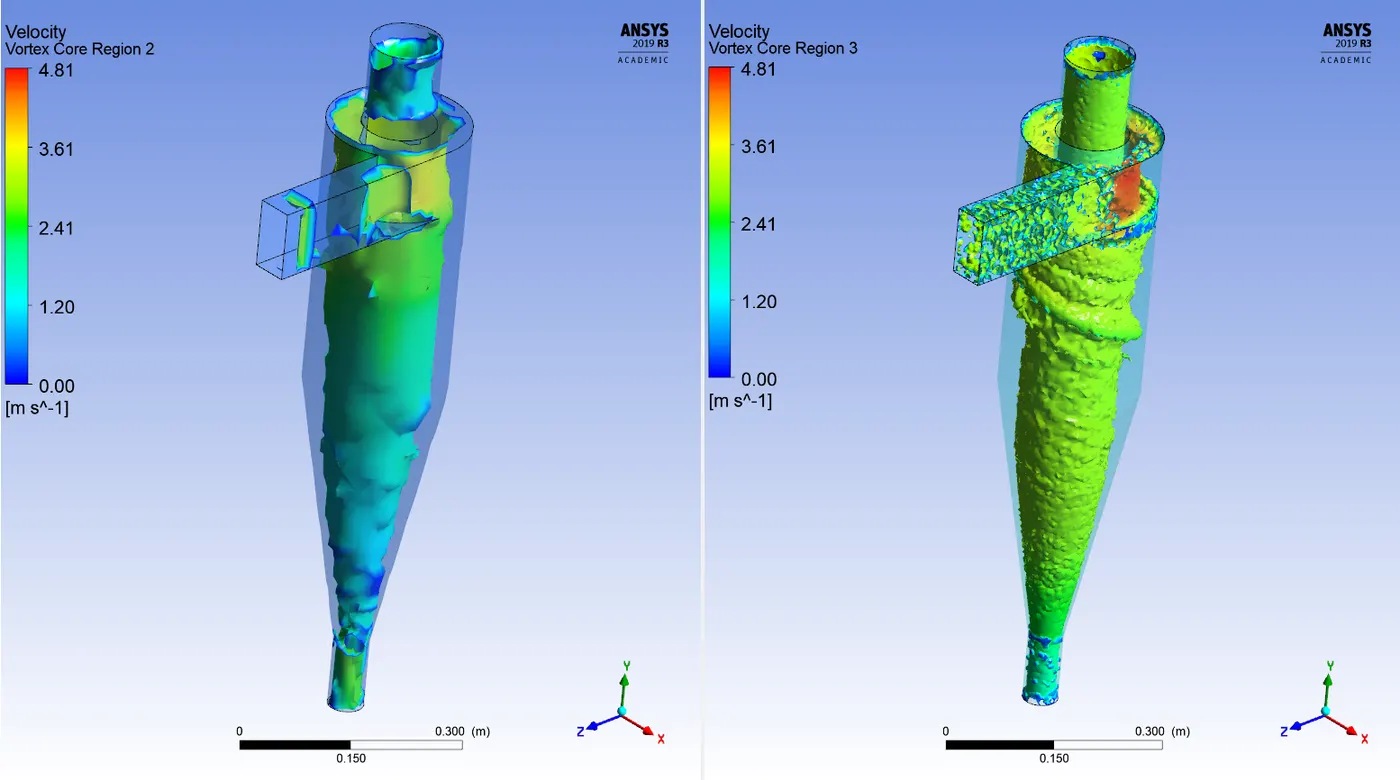
F.14 Velocity – Vortex core region: swirl strength
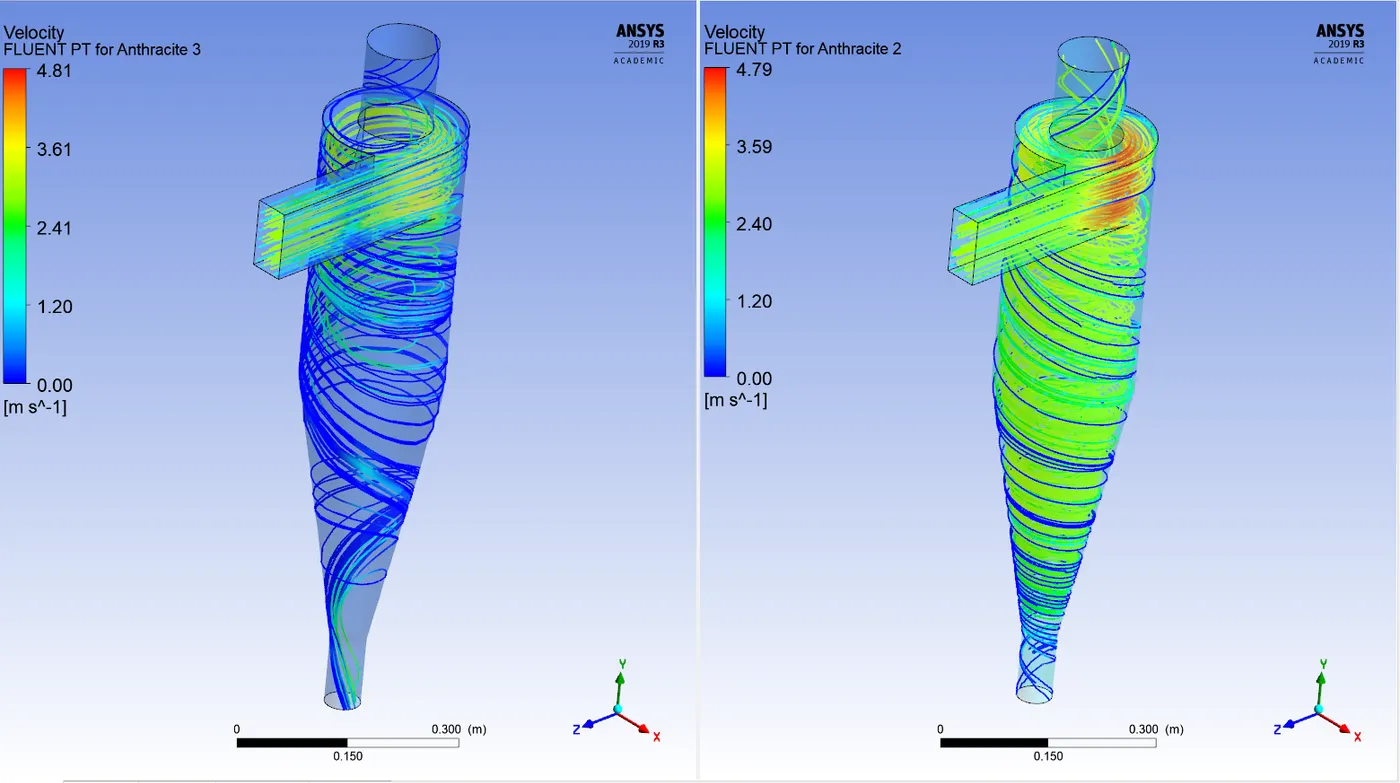
F.15 Velocity particle track
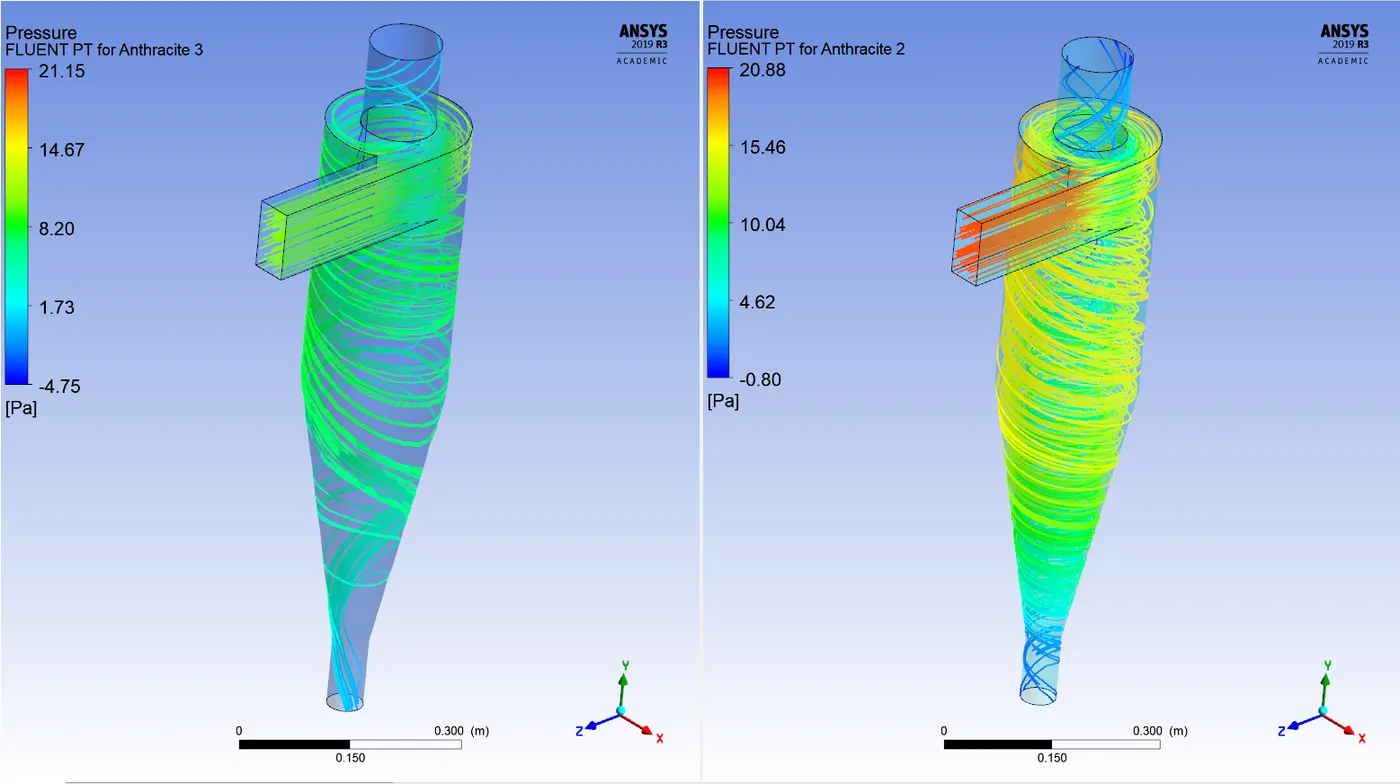
F.16 Pressure particle track
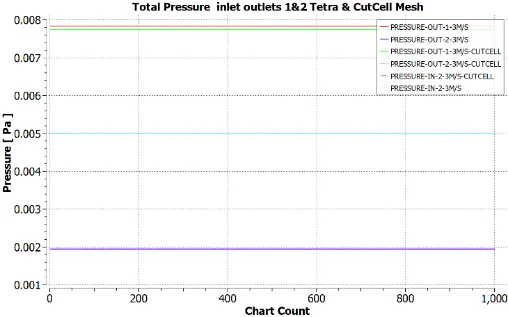
F.17 Pressure comparison inlet & outlets
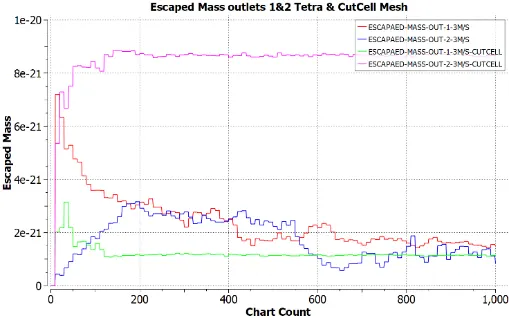
F.18 Escaped Mass comparison outlets
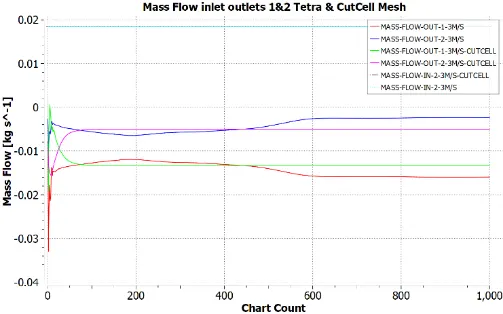
F.19 Mass flow comparison inlet & outlets
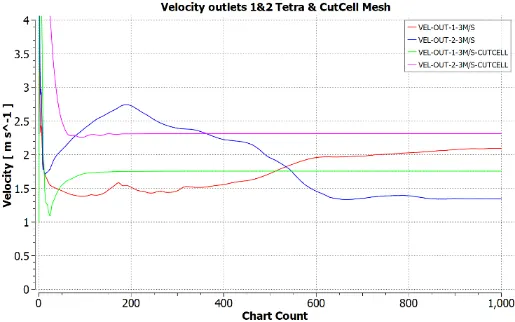
F.20 Velocity comparison outlets
For the third, fourth and fifth case a comparison will be made, considering that the variation is only in velocity inlet: 1, 3 and 5m/s, having the same cut cell mesh.
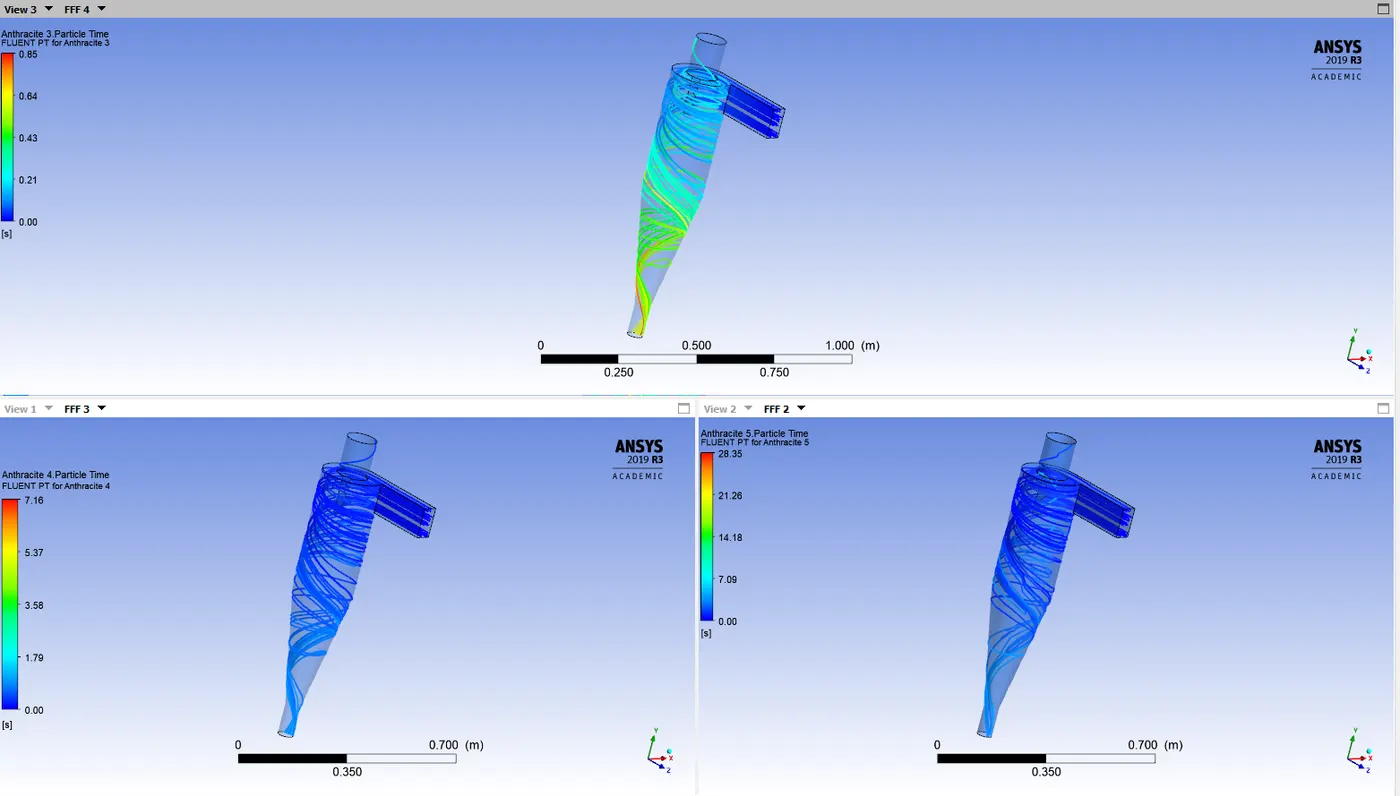
F.21 Particle Time track
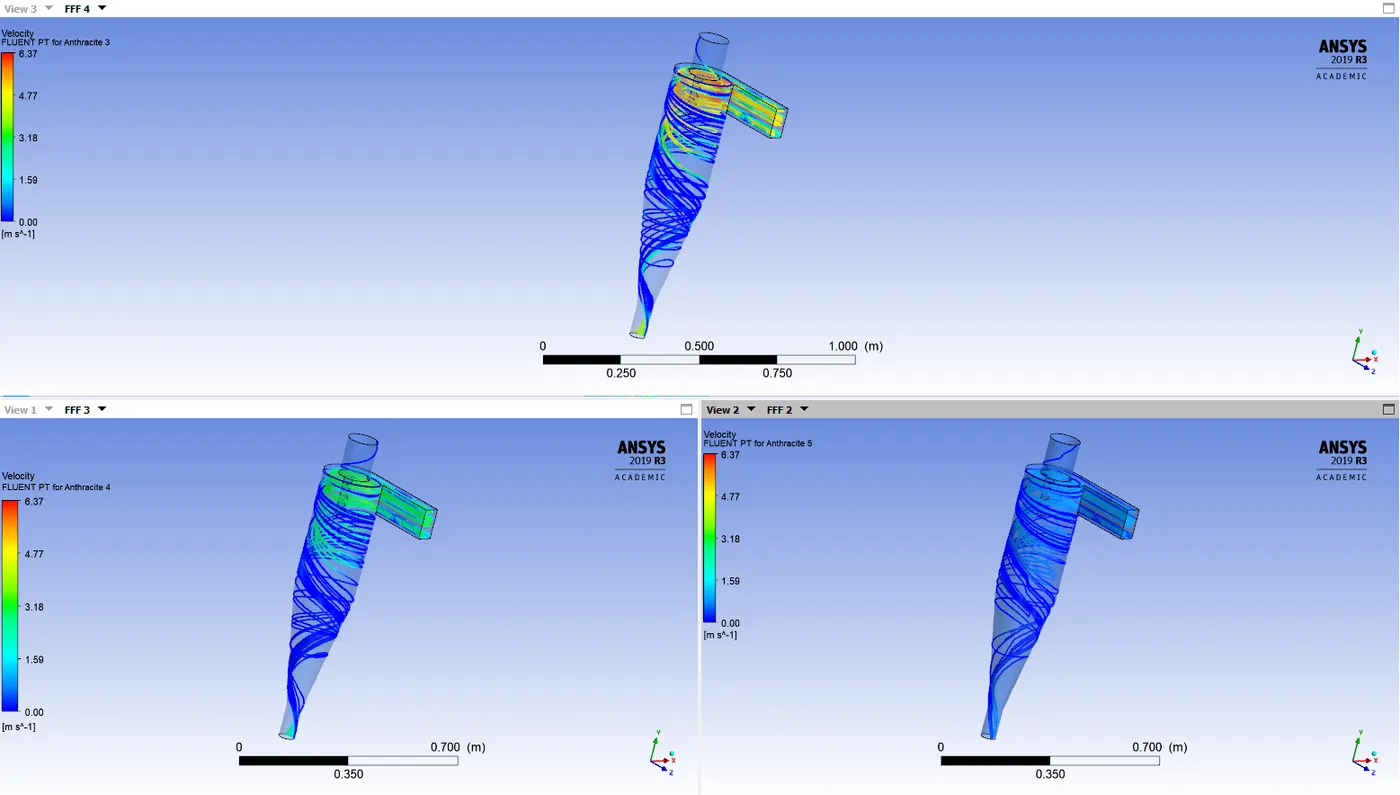
F.22 Velocity particle track
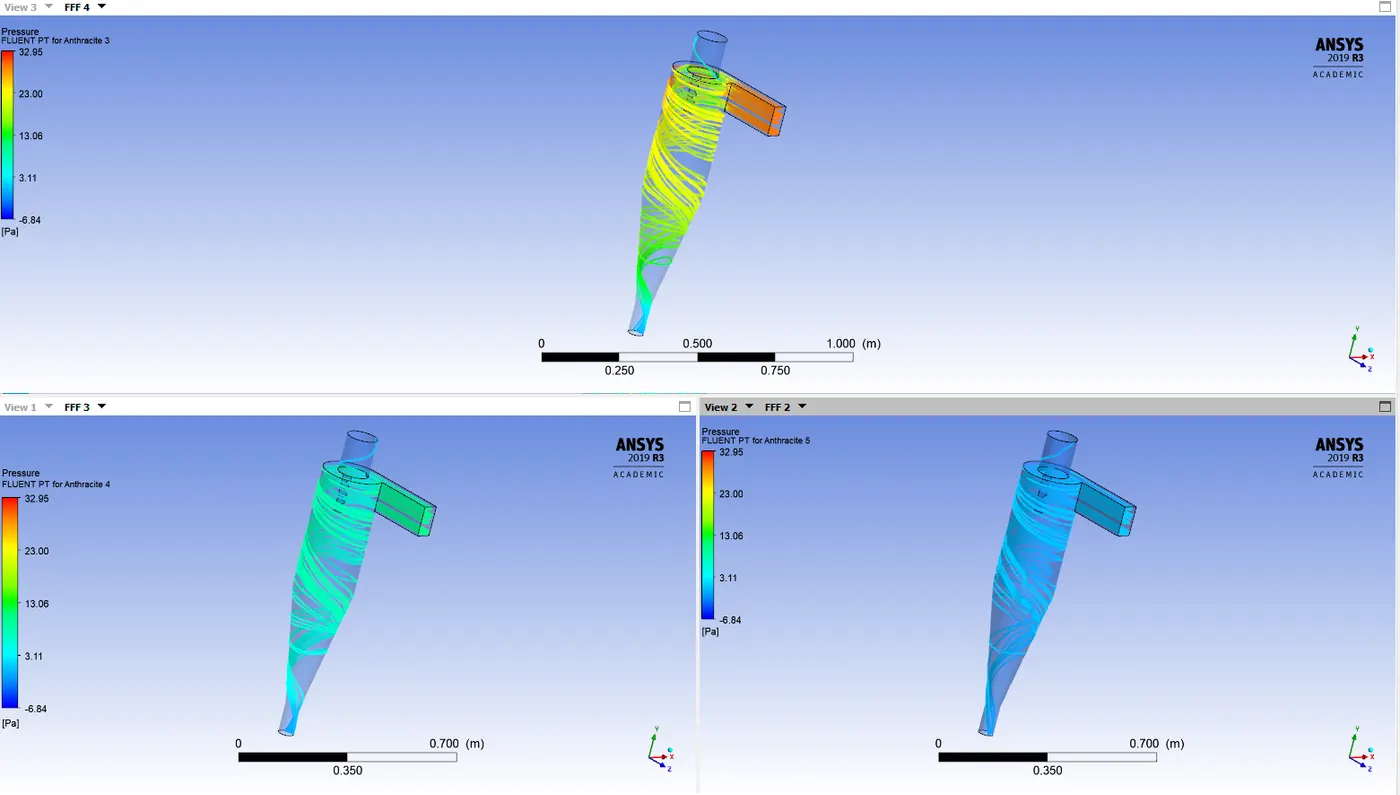
F.23 Pressure particle track
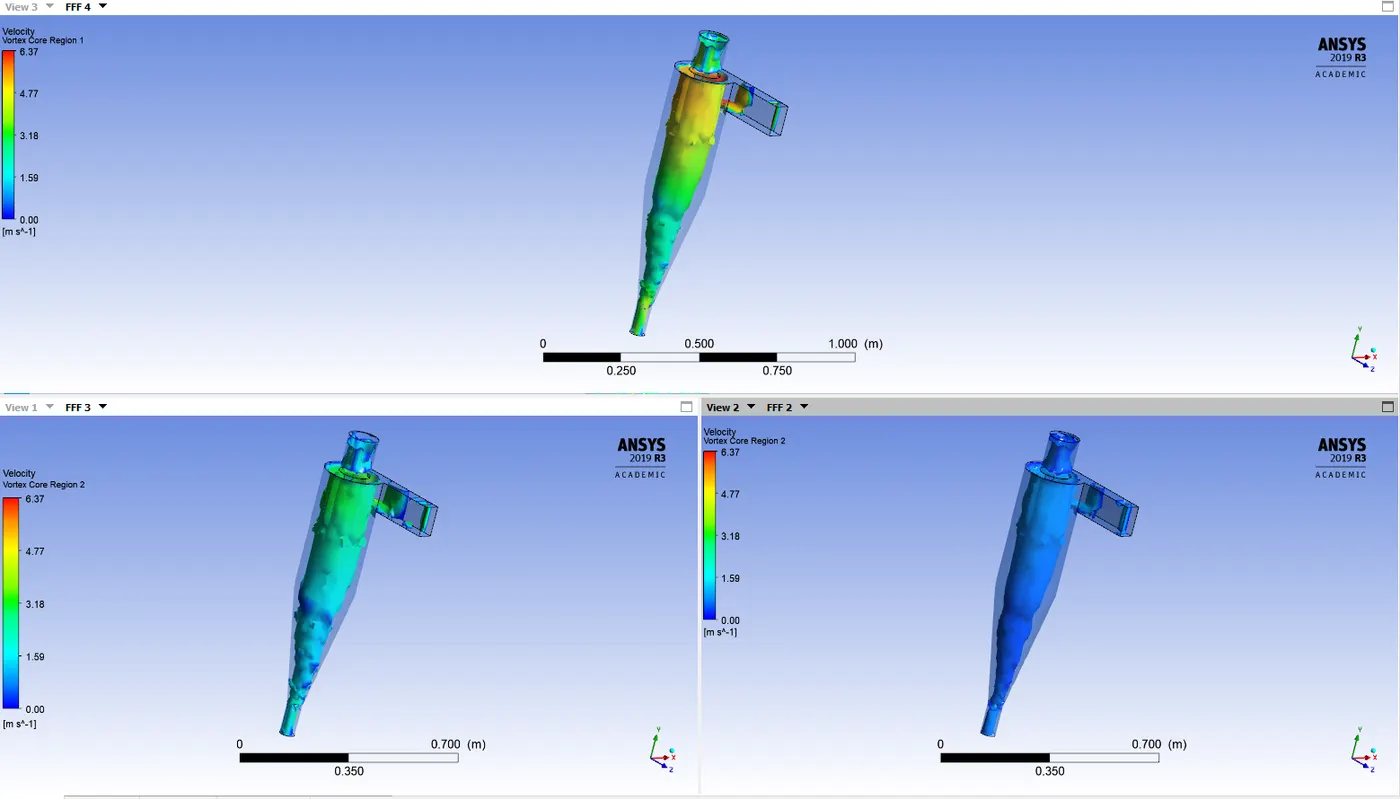
F.24 Velocity – Vortex core region: swirl strength
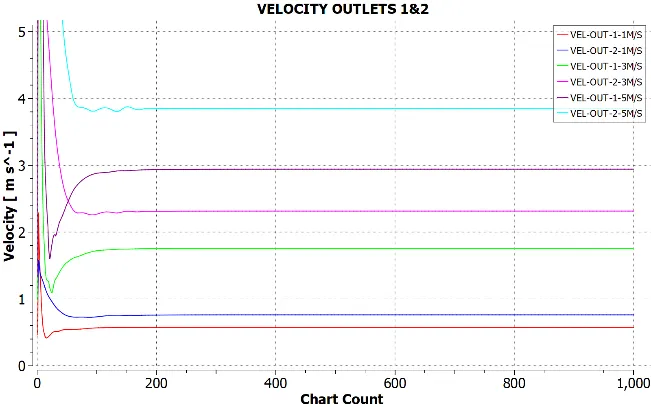
F.25 Velocity comparison outlets
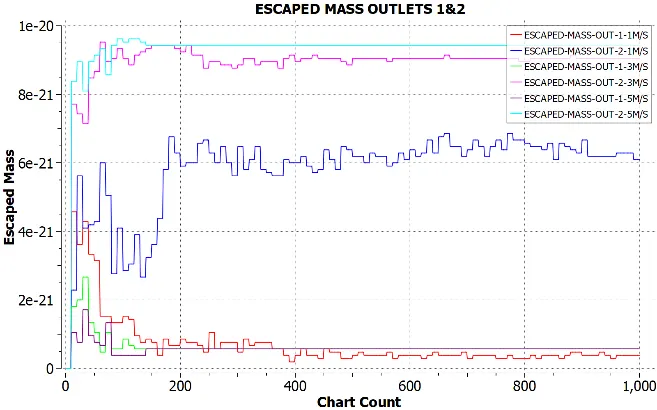
F.26 Escaped Mass comparison outlets
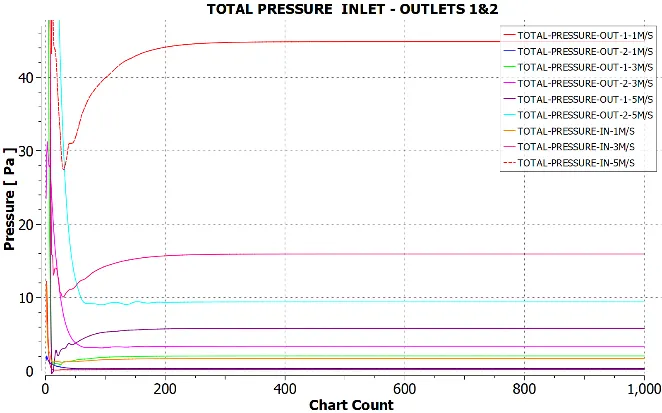
F.27 Pressure comparison inlet & outlets
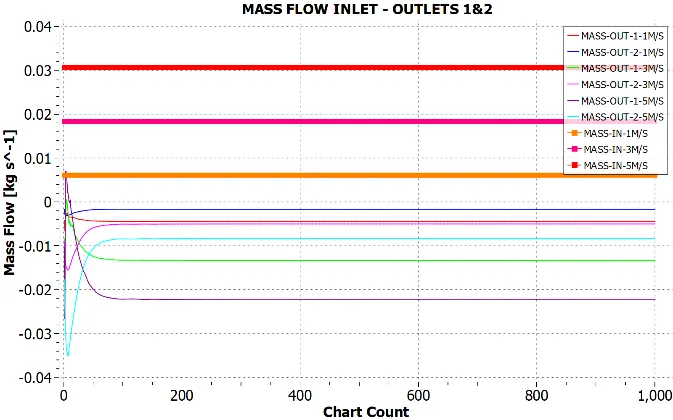
F.28 Mass flow comparison inlet & outlets
Conclusion
Analyzing the results from the contours, graphs and particle tracking, F.29 obtains the general data in order to determine the efficiency in mass flow and particle quantity trapped and escaped, which the mass flow for cases 2-5 is maintained with a certain error percentage (low), meaning a good convergence but different from the case 1 suggesting the future simulations to perform with the same conditions (case 2-5) and mesh (case 1). According to the particle trapped efficiency (cyclone efficiency), the results suggests that the higher the flow velocity the higher the efficiency will get, as well as the pressure drop.

F.29 Efficiency results.
Video of simulation case 1:
Link: https://youtu.be/BnvbAXnSS_w
References
- Cyclone Optimization Based on a New Empirical Model for Pressure Drop, Ramachandran, G., Leith, David, Dirgo, John, Feldman, Henry, Aerosol Science and Technology, 1991/01/01.
- Wang, L., M. D. Buser, C. B. Parnell and B. W. Shaw, 2003. Effect of air density on cyclone performance and system design. Transactions of the ASAE 46 (4): 1193-1201
- Zhao, B.; Shen, H.; Kang, Y. (2004), “Development of a Symmetrical Spiral Inlet to Improve Cyclone Separator Performance”, Powder Technology, 145, pp. 47-50.