Curve fitting using MATLAB
AIM: To perform a curve fitting for the given dataset and to find the best fit and perfect fit for that particular dataset using MATLAB.
OBJECTIVE: 1.Write code to fit a linear and cubic polynomial for the cp data.
2.Plot the linear and cubic fit curves along with the raw data points. Tiltle and axes labels are a must with legends.
3.Expain the parameters used to measure the fitness characteristics for both the curves.
NOTE: The curve fitting toolbox inMATLAB is used to validate the fitness characteristics.
THEORY:
CURVE FITTING- (.)Curve fitting is the process of constructing a curve or mathematical function,that has the best fit to a series of points ,possibly subject to constraint.
(.)Curve fitting can involve either interpolation, where an exact fit to the data is required ,or smoothing, in which a 'smooth' function is constructed that approximately fits the data.
(.)Fitted curves can be used as an aid for data visualisation,to infer values of a function where no data are available, and to summarise the relationships among two or more variables.
FITTING A CURVE: 1) The first degree polynomial equation-
y = ax +b
is aline with slope.A line will connect any two points, so a first degree polynomila equation is an exact fit through any points with distinct x coordinates.
(.)If the order of the polynomial is increased to second degree polynomila ,the following is obtained-
2)The second degree polynomial
y = ax^2+bx+c
This wil exactly fit a curve to three points.
(.)If the order of the equation is increased to a third degree polynomial , the following is obtained-
3)The three degree polynomial
y = ax^3+bx^2+cx+d.
This will exactly fit four points.
PARAMETERS USED TO MEASURE THE FITNESS OF THE CURVE:
1)The sum of squares due to erros(SSE)
2)R-square
3)Adjusted R-square
4)Root mean squared error(RMSE)
CODE:
clear all
close all
clc
%preparing the data
cp_data = load('cp_data');      %To load the data file that consists of values of cp and temperature
temperature = cp_data(:,1);  %To extract temperature values from data
cp = cp_data(:,2);           %To extract cp values from data

%curve fit for 1 degree polynomial
%cp = a*t + b
co_effs1 = polyfit(temperature,cp,1);
predicted_cp1 = polyval(co_effs1, temperature);


%curve fit for 3 degree polynomial
%cp = a*t^3 + b*t^2 + c*t +d
co_effs3 = polyfit(temperature,cp,3);
predicted_cp3 = polyval(co_effs3, temperature);

%compare my curve fit for degree 1 polynomial with the orignal data.
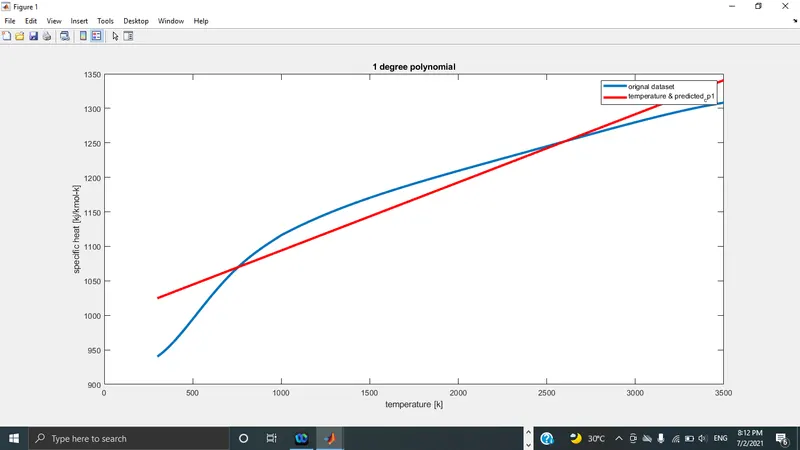
figure(1)
plot(temperature,cp,'linewidth',3)
hold on
plot(temperature , predicted_cp1,'linewidth',3,'color','r')
xlabel('temperature [k]')
ylabel('specific heat [kj/kmol-k]')
legend('orignal dataset','temperature & predicted_cp1')
title('1 degree polynomial');


%compare my curve fit for degree 3 polynomial with the orignal data.
figure(2)
plot(temperature,cp,'linewidth',3)
hold on
plot(temperature , predicted_cp3,'linewidth',3,'color','g')
xlabel('temperature [k]')
ylabel('specific heat [kj/kmol-k]')
legend('orignal dataset','temperature & predicted_cp3')
title('3 degree polynomial');
CODE EXPLANATION: Step1-clear all,close all,clc commands are used to clear all previous files and previous content in the workspace.
Step2- Loading the data file in MATLAB , in the first column is temperature and 2nd column is specific heat.
Step3-We have the equation for linear or 1 degree polynomilal (at+b)
POLYFIT- This command is used to return the co-efficients of the polynomial for a degree n.
POLYVAL- This command evaluates the polynomial p at eachh point in x.
RESULT:
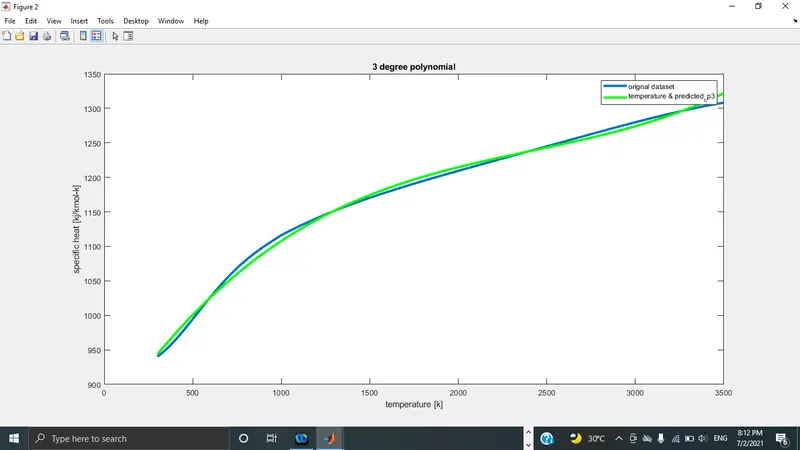
From this program we get TWO GRAPH PLOTS- these are:
1)Specific heat vs temperature [For linear curve fitting]
2)Specific heat vs temperature[For cubic curve fitting]
A) How to make a curve fit perfectly?
In perfect fit,without showing the centering error and scaling error ,the curve fit should fit the orignal curve inthat particular order of a polynomial. Aperfect fit can always be the best fit but the best fit can not be a perfect fit. We can improve perfect fit by minimising error and making it to the best fit.
B) How to get the best fit?
first of all ,the best fit and the perfect fit are two completely different phenomena.To get the best fit ,we can check the paramenters for the characteristic curve fitting.We can increase the order of polynomial to get the best fit.In some cases,we can use the split-wise method to get the best fit.
C) What could be done to improve the cubic fit?
By using the split wise method,we can improve a curve fit for that particular order of polynomial.We must split the orignal data into some small ranges,such that we should compute different co-efficient for the curve fit functions for the small ranges.At last by combining these values we can plot over the entire the entire data set.
CONCLUSION: 1) For a good fit ,higher degree of polynomial is to be selected.
2) There are several ways in which we can do curve fitting in MATLAB.