Conjugate Heat Transfer Analysis on a graphics card.
OBJECTIVE
Aim of the simulation is to perform a steady state conjugate heat transfer on the cad model of graphics card. We have to vary the velocity from 1m/s to 5m/s & compare the final temperature of the GRAPHICS CARD. We have to plot & compare the different countours of temperature & wall heat transfer coefficient.
INTRODUCTION
Today, there is a huge demand of electronics equipment which are smaller, lighter and faster. These requirement of any product can make it more compactible ^& is accepted by the user. Specially these things are true for electronic product like laptops & mobile. A user always demands that the performence of his product must be fast beacuse of the time constraints given by the customer. Specially if we talk about engineers, they really require high speed computers which should have very high computational power. These computers are refer as super computer. There are analysis software like ansys which require very high computational power computers which can save our computational time & can give very accurate result. These all requirement are fullfiled but at the cost of heat genration. It is a big issue which can effect the performance of computers drastically. Every matterial has some bearing stress capicity & if stress increases that limit then the matterial performance can degrade. We must ensure the design of matterial in such a way that it can bear the genrated heat.
In order to fullfill these demands, we must ensure proper cooling arrangment which will result in heat loss from the matterial. It will help in keeping the upper limit of temperature below the thrushold value which can ensure proper functioning of matterial. There are many ways to ensure proper installing of cooling system for increased performance of matterial. GPU is the component where maximum heat is genrated & gets distributed in all parts of computer.
GEOMETRY & MESHING
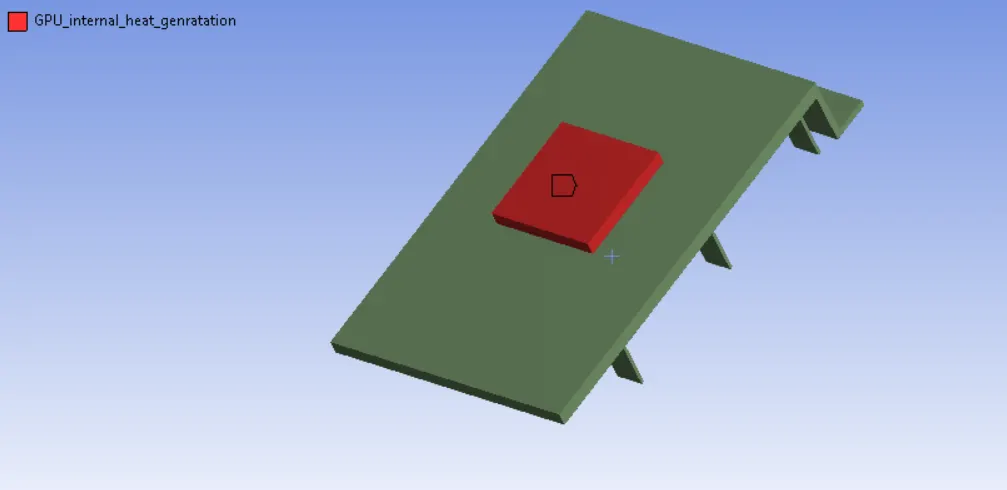
Below is the geometry of graphics card. It has been surrounded by a enclousre which provides a porous medium for fluid elemet to flow. The upper most part is fins which dissipiates most part of the heat. It is installed just above processor where most of the heat gets genrated. There are total of 15 extended surface. The concept of fins is to increase the total surface area which is in contact with air (cooling fluid). ore number of extended surface will result in more number of fins. These all setup are installed on base platform to support the GPU & fins.
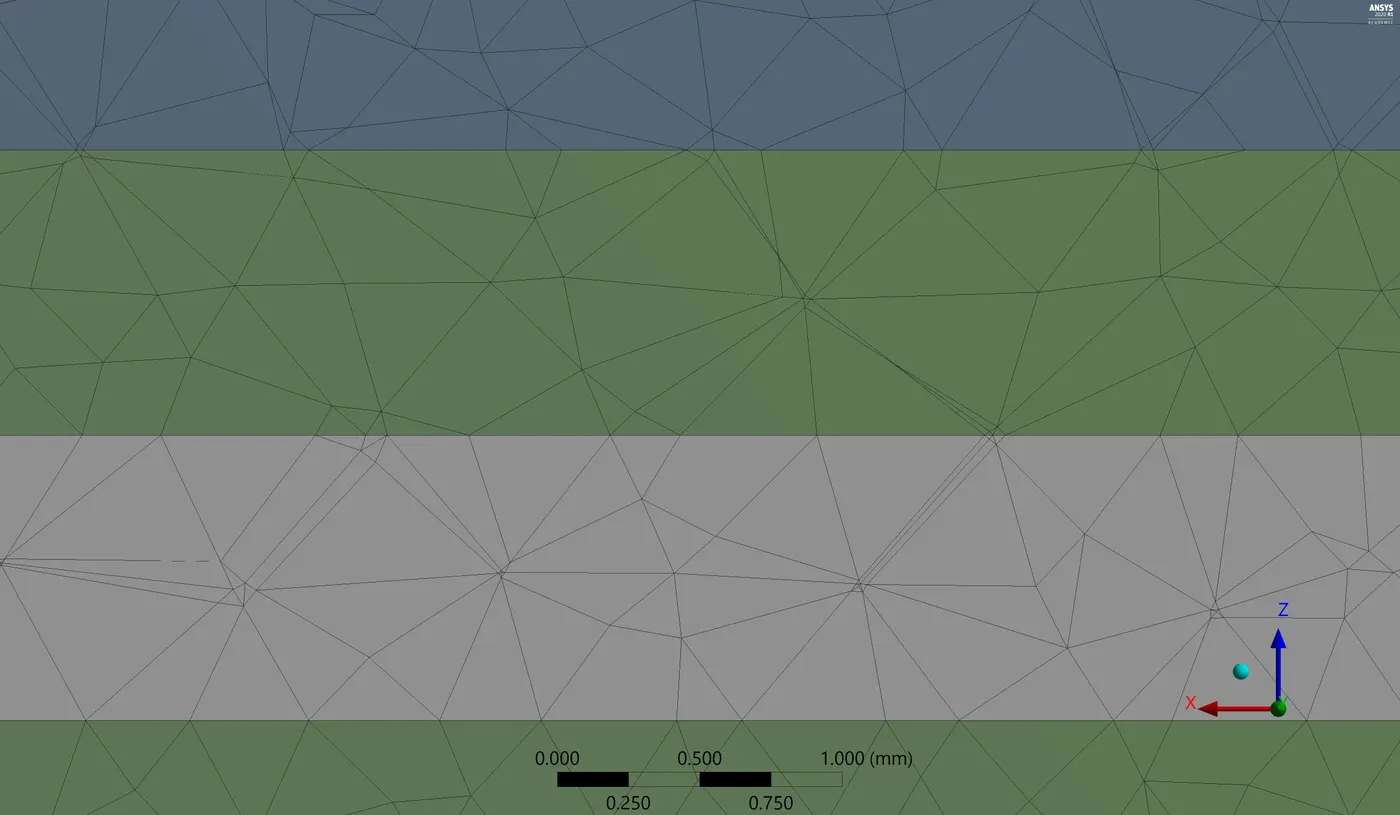
NOTE : WE HAVE TO SHARE TOPOLOGY FOR PERFORMING PROPER MESHING TO CONNECT CONFORMAL & NON CONFORMAL MESH.
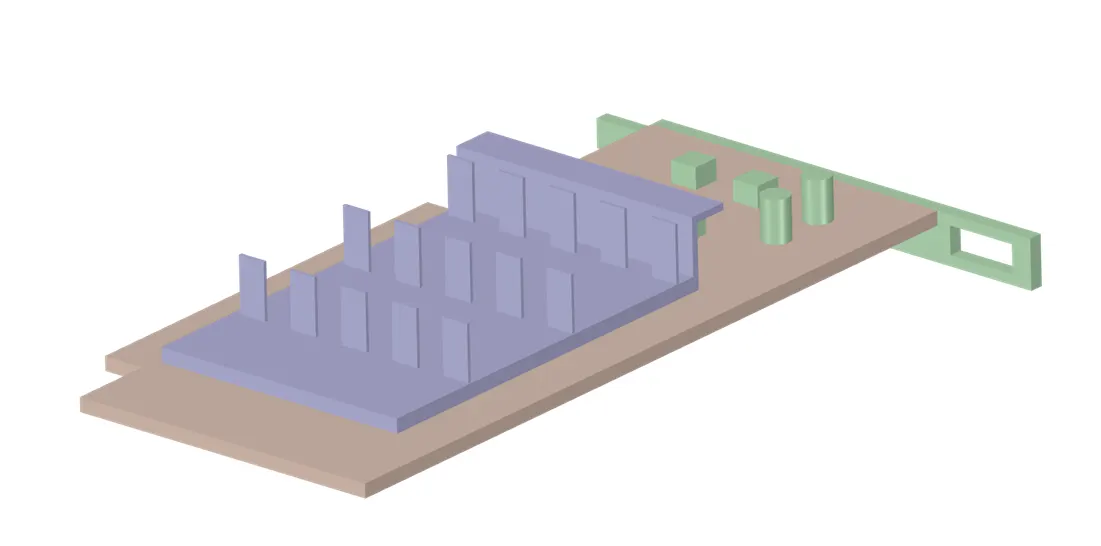
Table below shows the choosen matterial for the different component. These element are choosen for research purpose & has given excellent performance when it comes to cooling effect.
| COMPONENT | MATTERIAL |
| BASE PLATFORM | NIKEL |
| GPU | GOLD |
| FINS | TITANIUM |
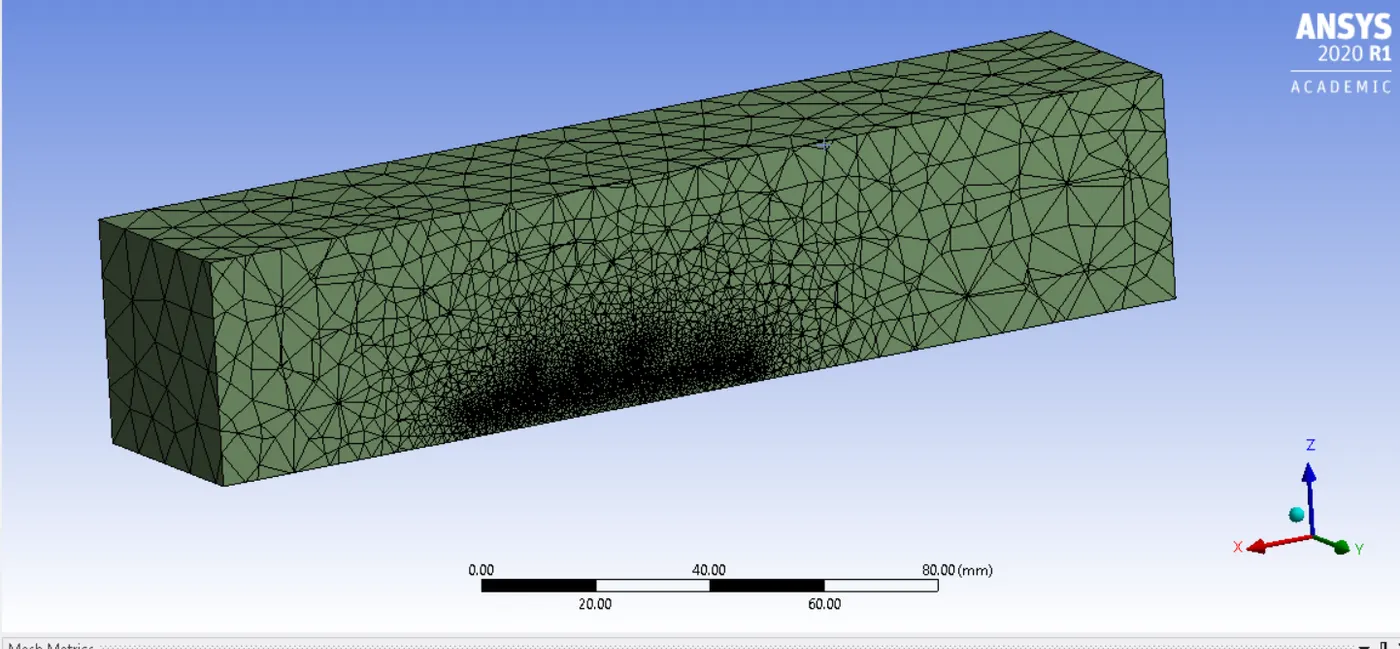
Computational meshing is the next step involved in the simulation. A good quality of mesh can only ensure good result. There are mainly two type of zones involved in calculation one is solid zone & other is fluid zone which provides media for cooling fluid to flow. We are not intrested in calculating result in fluid flow domain. We have genrated proper tetrahedral meshing around fluid zone & body sizing for the entire solid zone(graphics card setup).
Below table contains the meshing details.
| PARAMETERS | VALUE | MESH TYPE |
| ELEMENT SIZE_FLUID | 10 mm | TETRAHEDRAL |
| ELEMENT SIZE_SOLID | 0.5 mm | BODY SIZING |
| NODES | 59639 | |
| ELEMENTS | 345686 |
Below figure shows the cut section of the entire setup. We can clearly see the dense zone near card & coarse mesh in fluid domain.
We can see proper conformal mesh due to enabeling share topology.
Below is a clear picture of graphics card . We have to calculate temperature over entire setup.
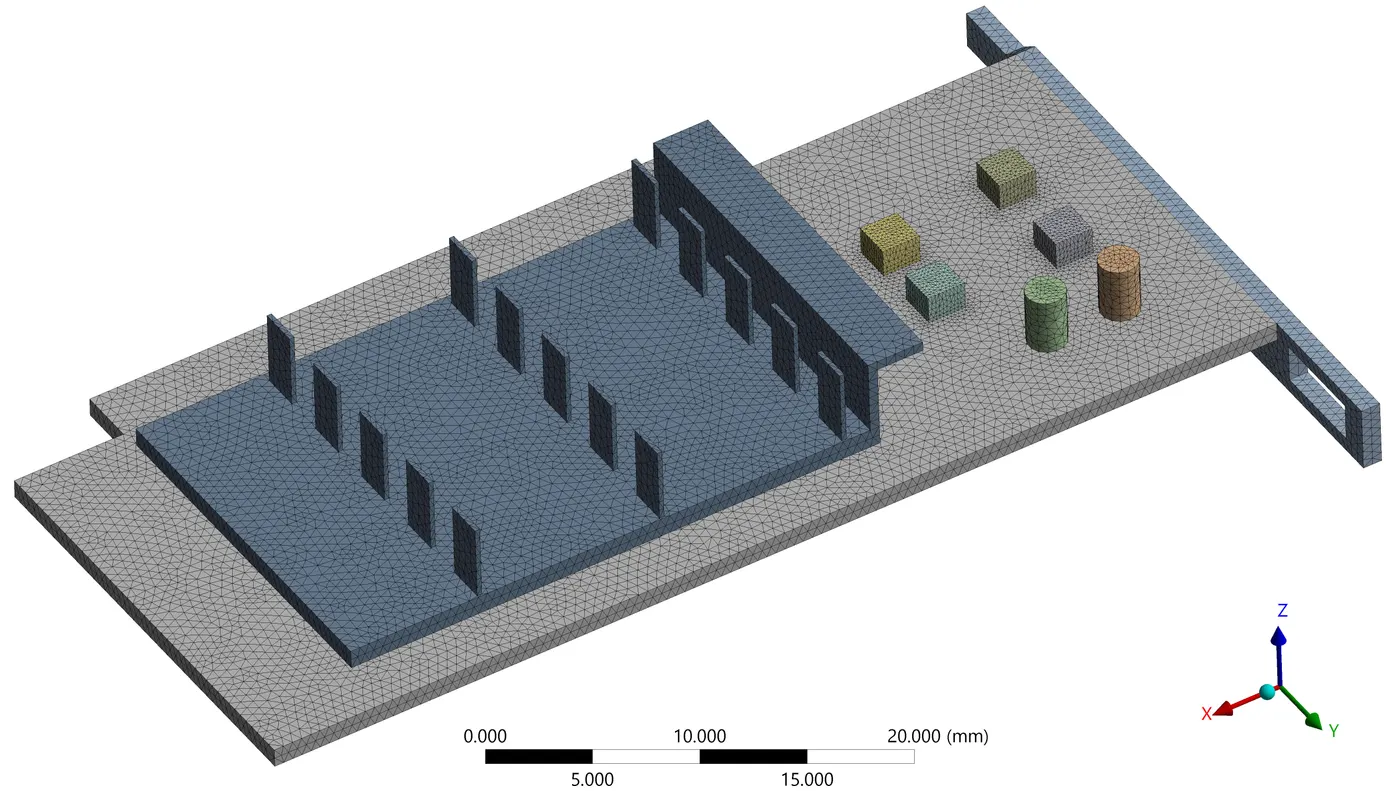
Well combination of course & fine mesh has been created for performing the simulation. Mesh was kept constant for all type of different simulation.
PHYSICS & SETUP
K epsilon methoed has been choosen to perform this simulation. This turbulance model with enabled wall function has ability to capture thermal gradient (with enabled wall function). For pressure velocity coupling, coupled methoed has been choosen. This helps in converging the solution as fast as possible beacuse it adopts a methoed which can solve multiple equation simultaneously. It results into faster convergence. Enclousure has been assinged as fluid zone where as remaining all other component has been assinged as solid components.
Processor has been assinged as heat source in cell zone boundary condition. It has been idenfied as a source of internal heat genratation. Volume of processor is 64mm^3. The value of heat genratation was assinged as 350000 w/m^3. These values were constant while performing all simulation. The inlet air velocity was the only parameter which was varied from 1m/s to 5m/s to see cooling effects.
RESULT & DISSCUSSION
CASE 1 : INLET VELOCITY OF COOLING FLUID = 1m/s
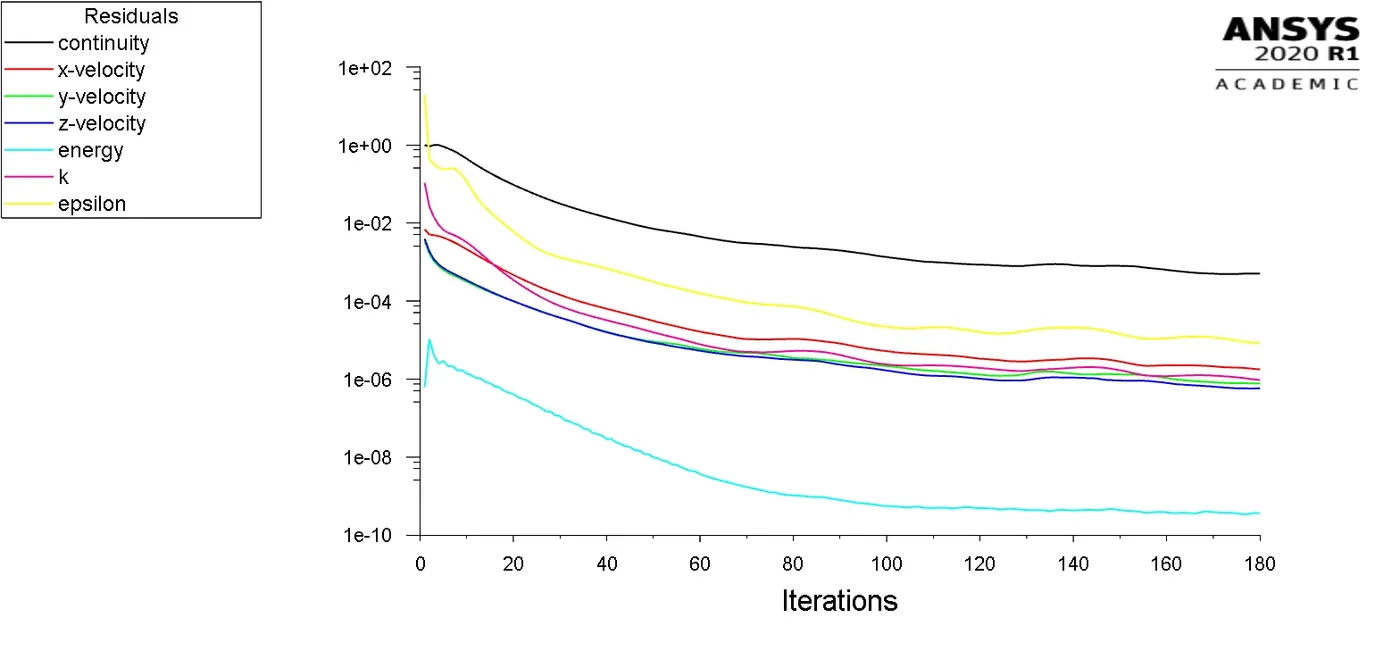
Following plot shows the residue for the simulation at 1m/s Simulation was run for180 iteration to ensure convergence.
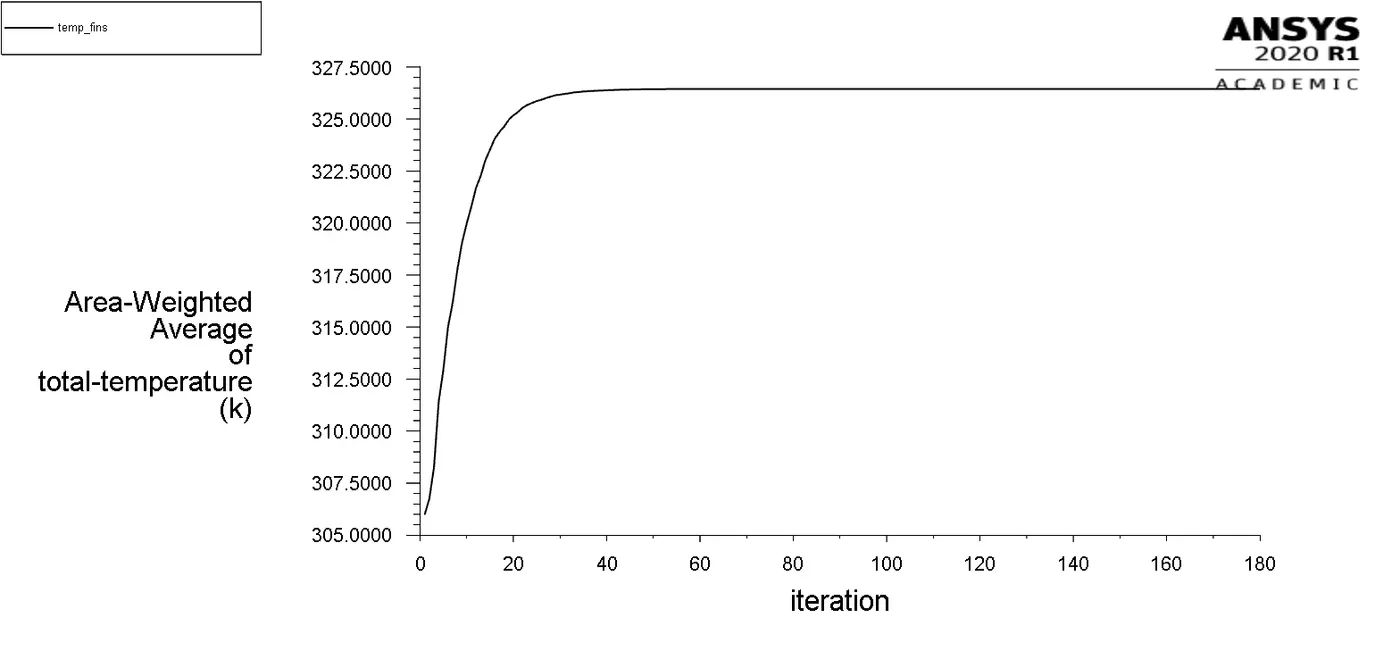
Following plot shows temperature of fins as simulation procced in forward direction. We can see that fin matterial has achived steady state temperature & the value is 326.442 kelvin at the end of 180 iteration.
1meterper second
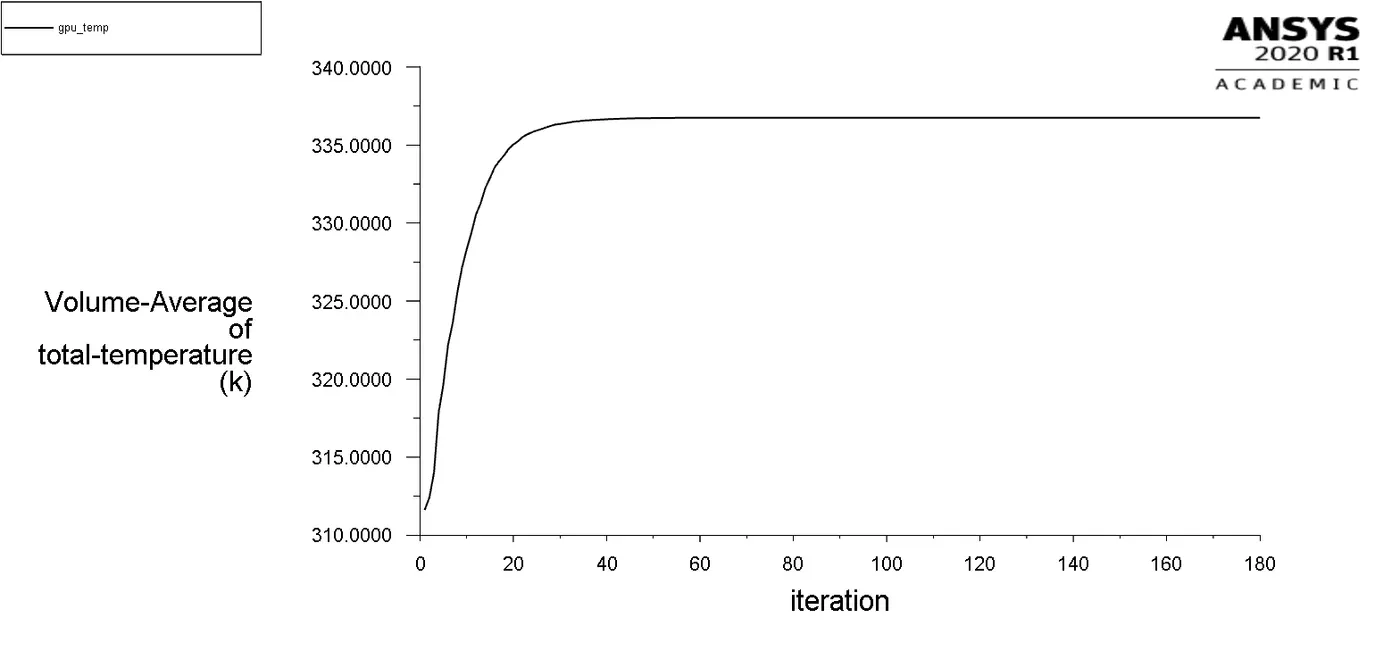
Following plot shows temperature of GPU as simulation proceed forward. We can see that fin matterial has achived steady state temperature & the value is 336.74 kelvin at the end of 180 iteration.
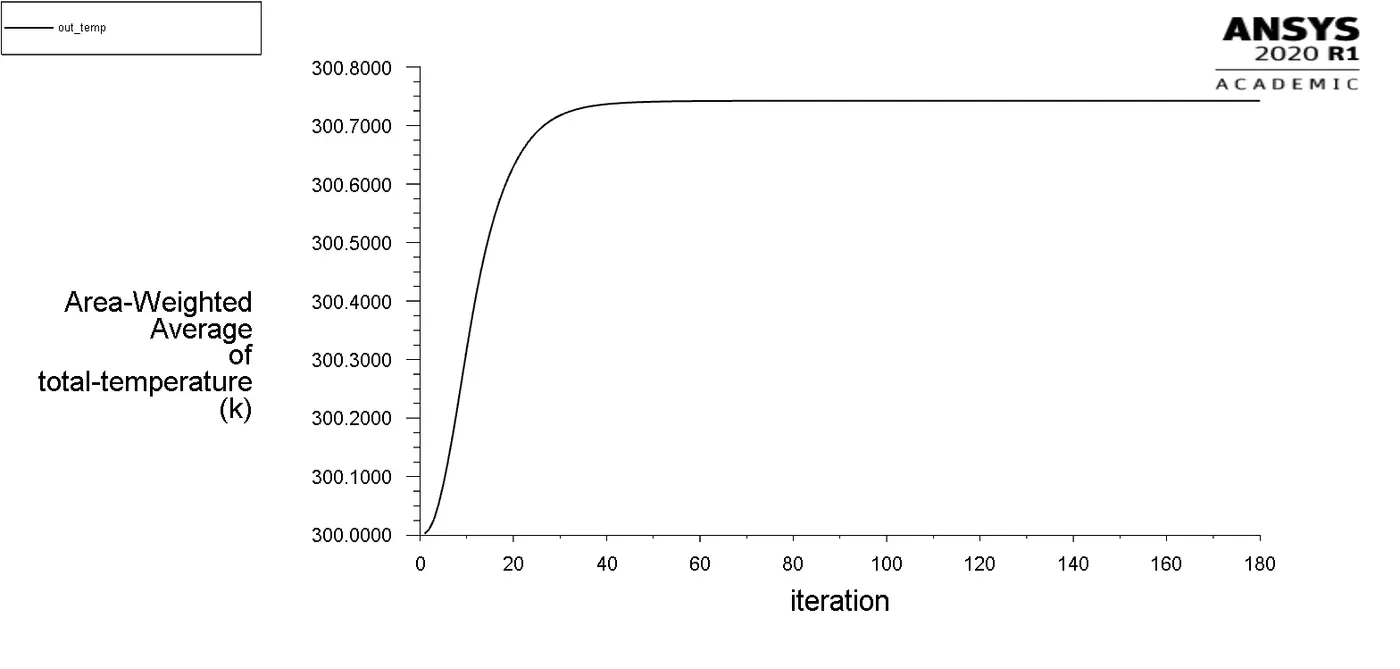
Following plot shows temperature of outlet air. We can see that fin matterial has achived steady state temperature & the value is 300.742 kelvin at the end of 180 iteration.
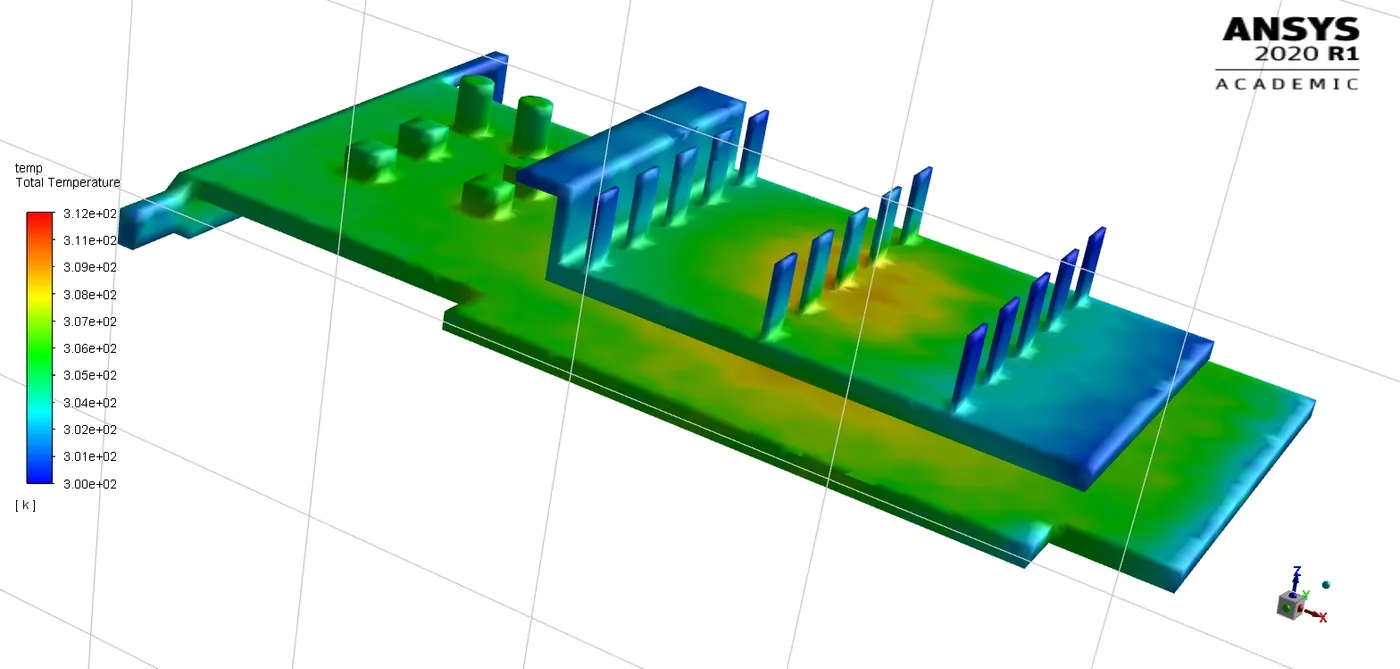
Below is the temperature distribution at the starting of simulation. We can see that all the near by zone havehigh temperature & away zone shown in blue color has minimumm temperature.
This temperature distribution is at end of 180 simulation. We can see the heat is getting dissipiated from GPU via fins. YELLOW/RED zones shows maximumm temperature whereas green color shows moderate temperature & the blue color shows the least temperature. Value of maximum temperature is inside GPU & is equal to approximately 337 kelvin where as the minimum temperature is of cooling air & equal to 300.7kelvin.
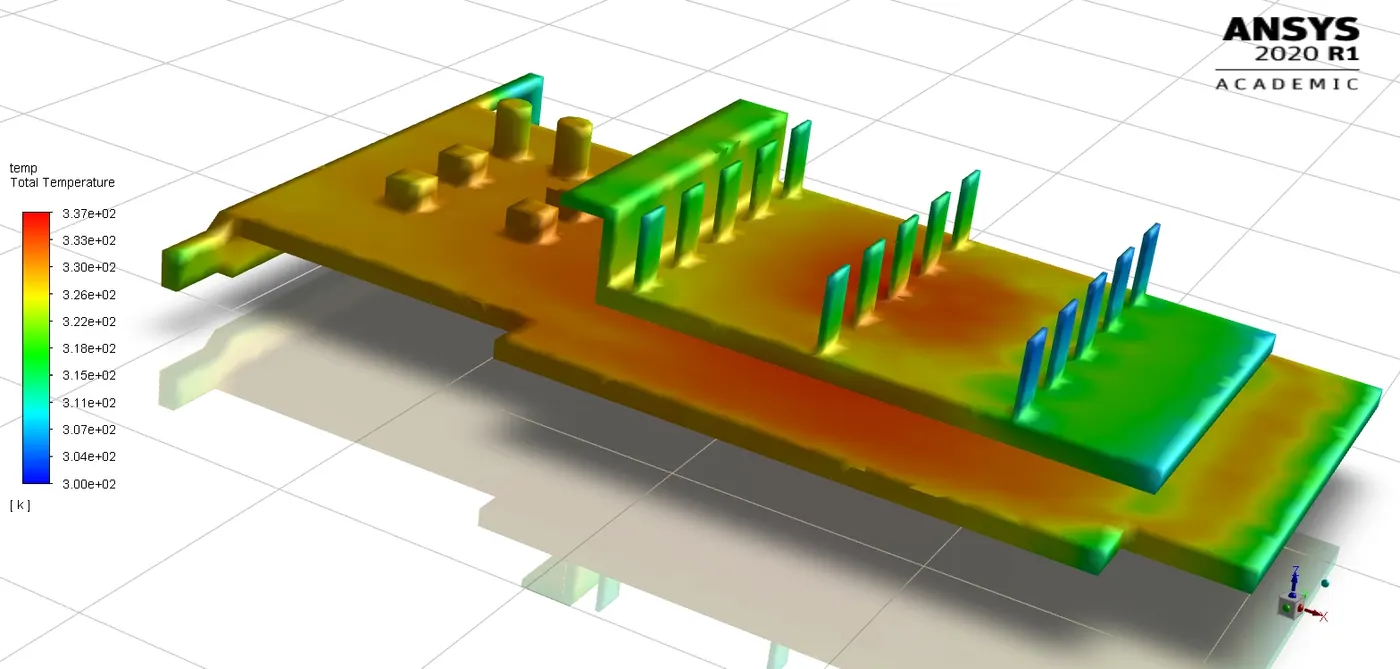
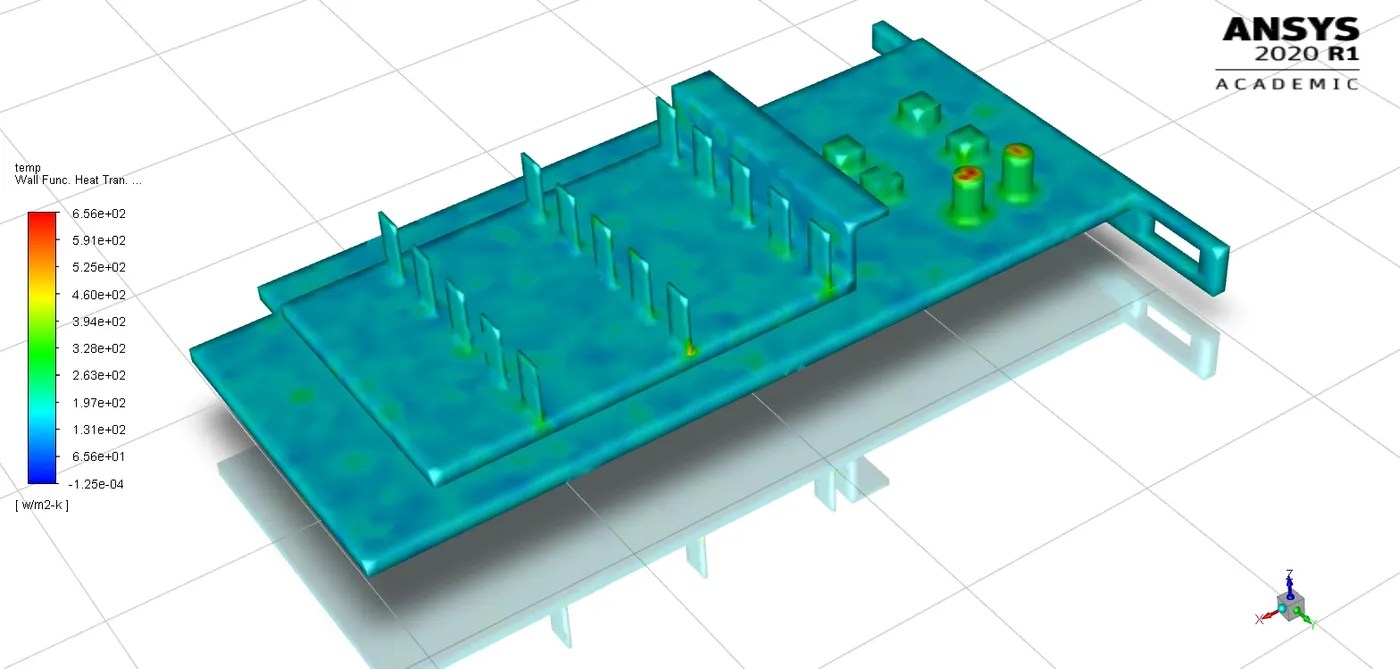
Figure below shows the countour of wall adjecent heat transfer coefficient which has attained a value of 43038.481w/m^2-k.
Below is the output from consol at 1m/s of cooling air velocity.
CASE 2 : INLET VELOCITY OF AIR IS 2M/SECOND
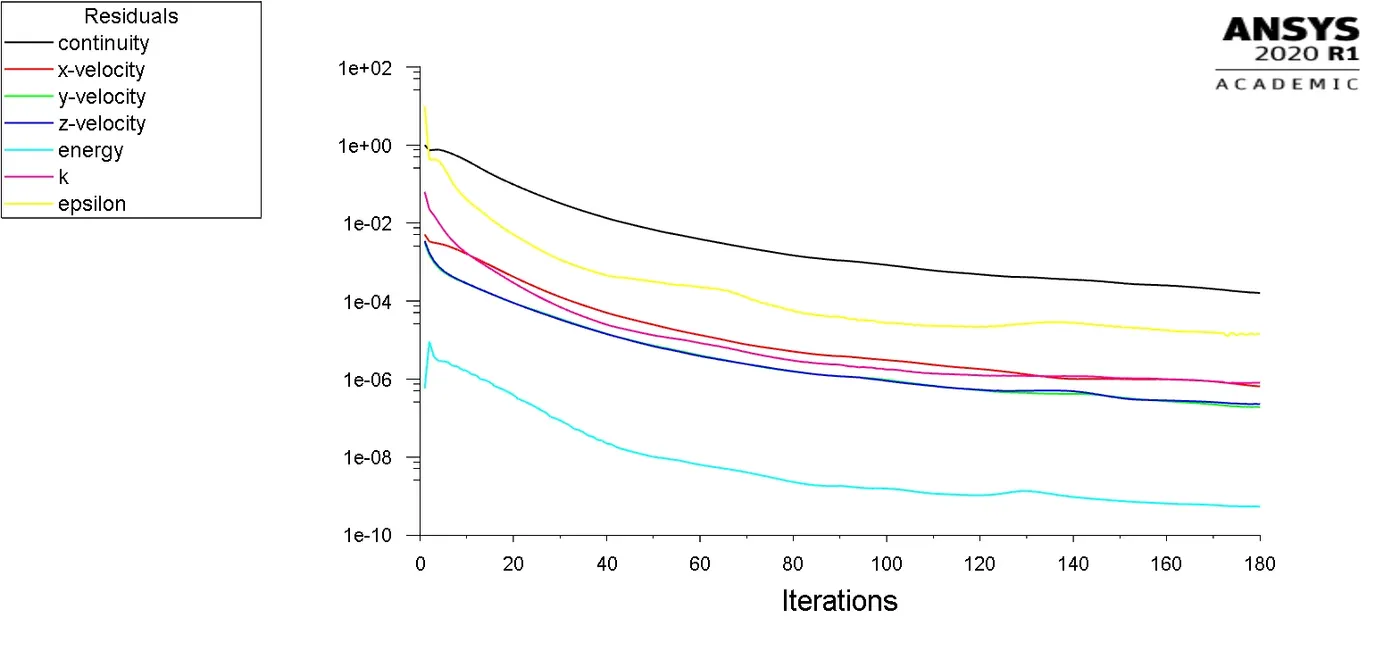
Following plot shows the residue for the simulation at 3m/s simulationas run for180 iteration to ensure convergence.
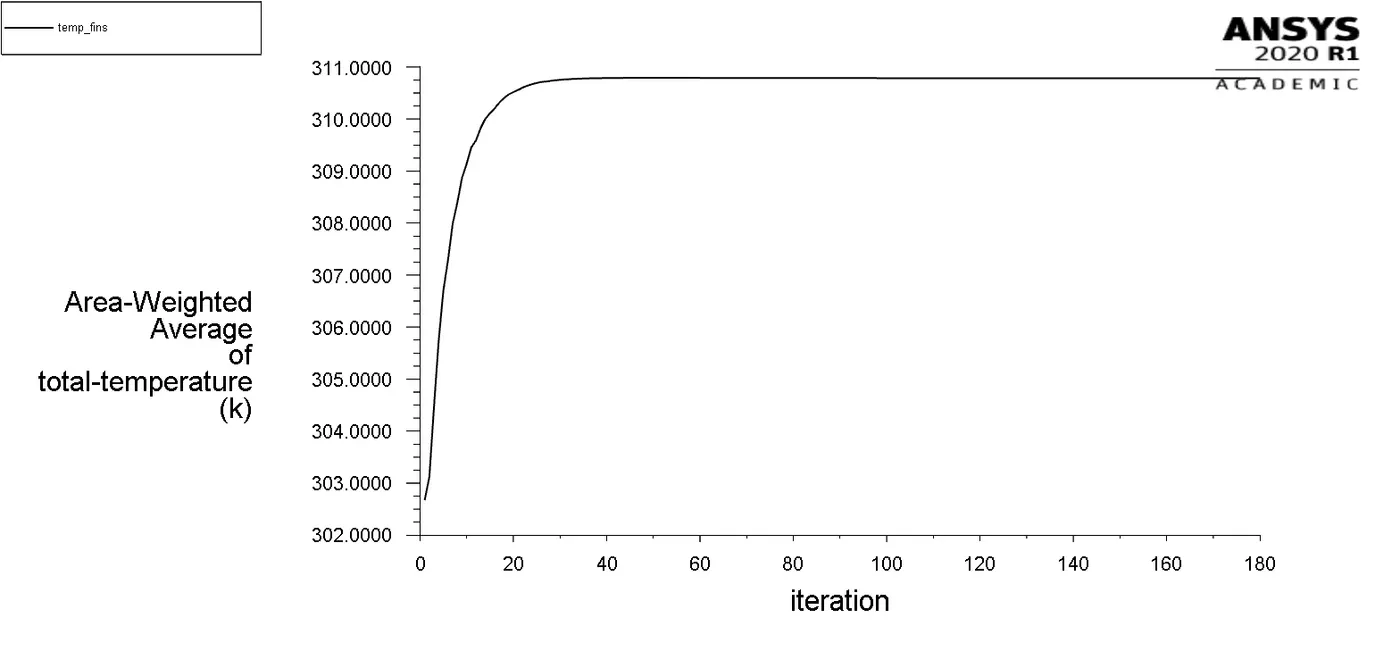
Following plot shows temperature of fins as simulation procced in forward direction. We can see that fin matterial has achived steady state temperature & the value is 310K at the end of 180 iteration.
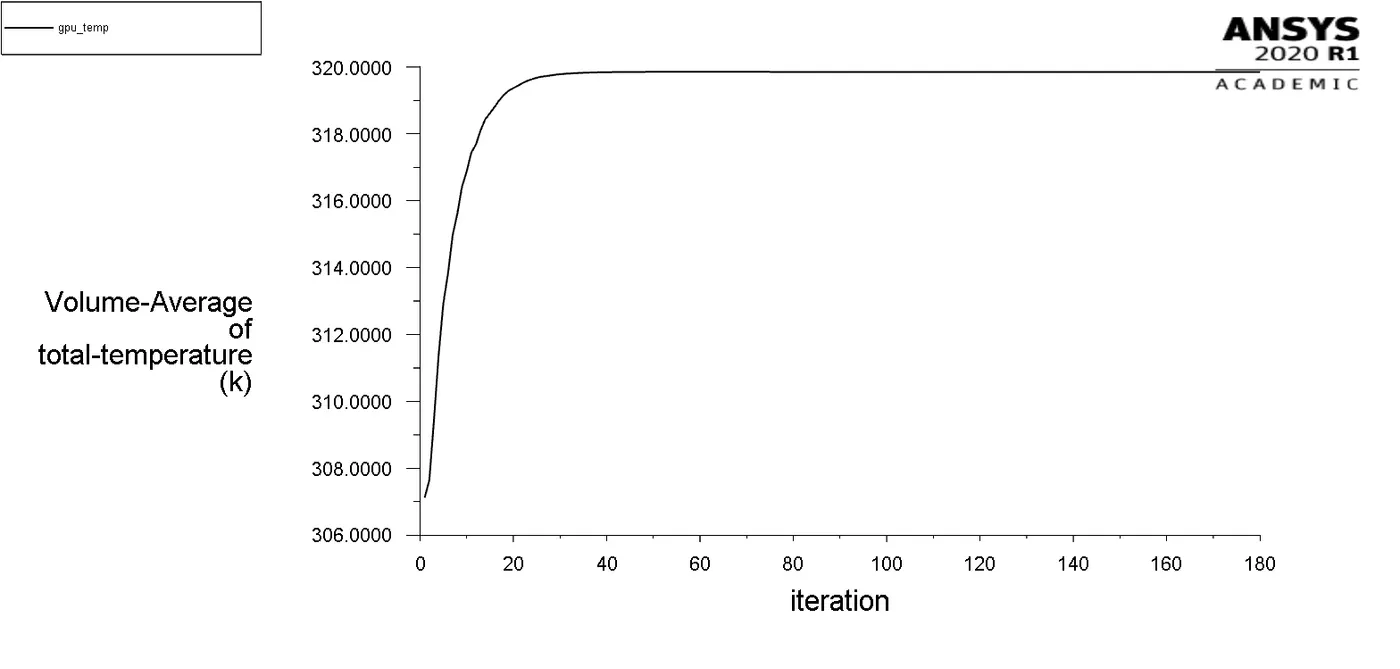
Following plot shows temperature of GPU as simulation proceed forward. We can see that fin matterial has achived steady state temperature & the value is 319.84K AT theend of 180 iteration.
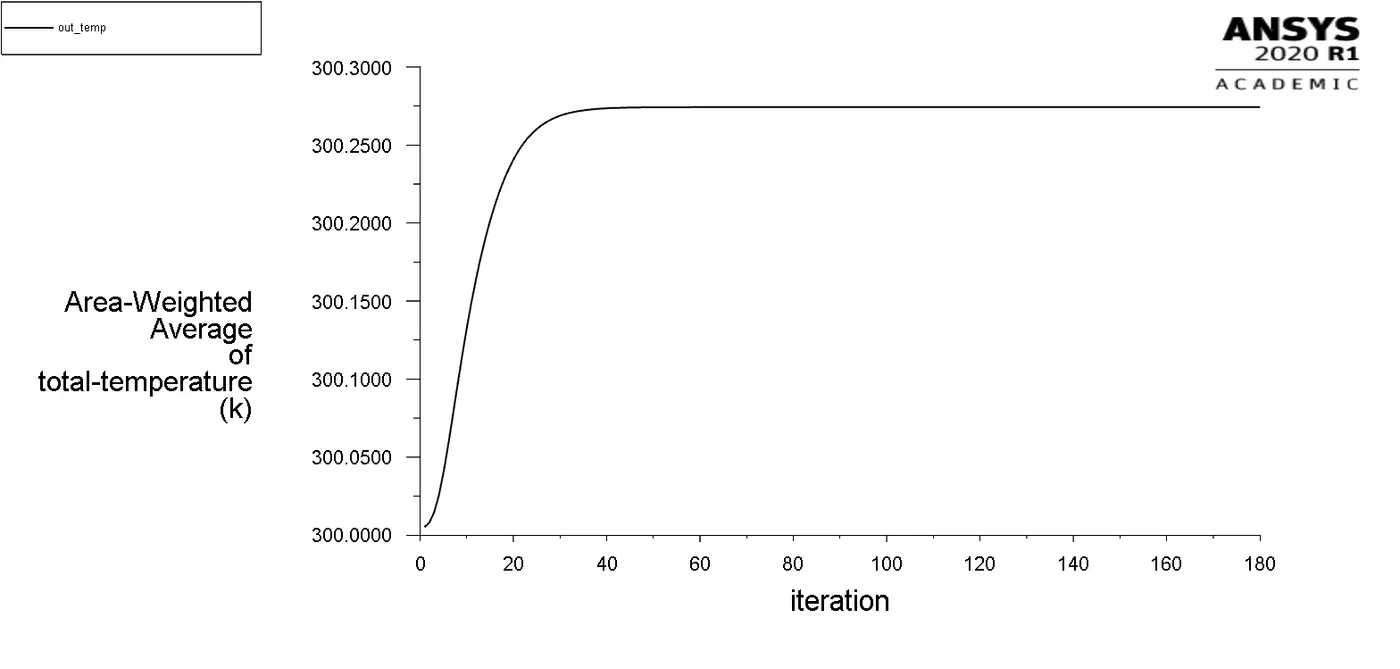
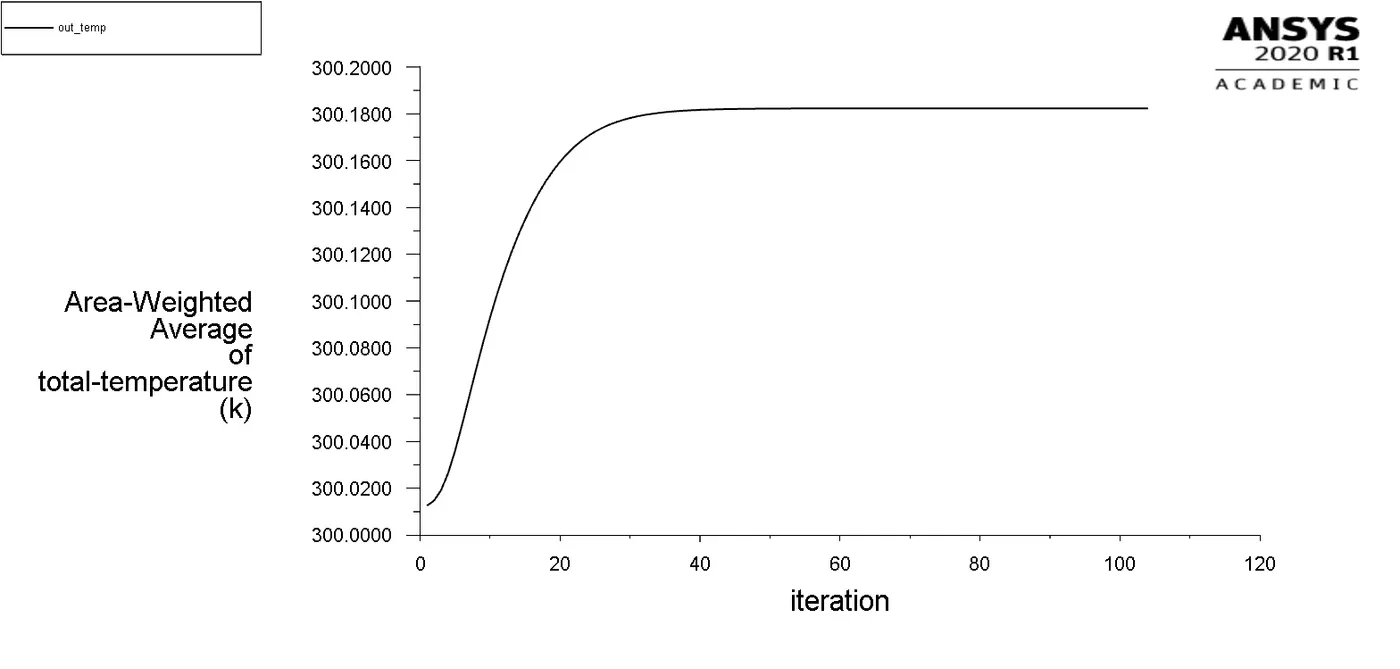
Following plot shows temperature of outlet air. We can see that fin matterial has achived steady state temperature & the value is 300.27K at the end of 180 iteration.
This temperature distribution is at end of 180 simulation. We can see the heat is getting dissipiated from GPU via fins. YELLOW/RED zones shows maximumm temperature whereas green color shows moderate temperature & the blue color shows the least temperature. Value of maximum temperature is inside GPU & is equal to approximately 319K where as the minimum temperature is of cooling air & equal to 300.27K.
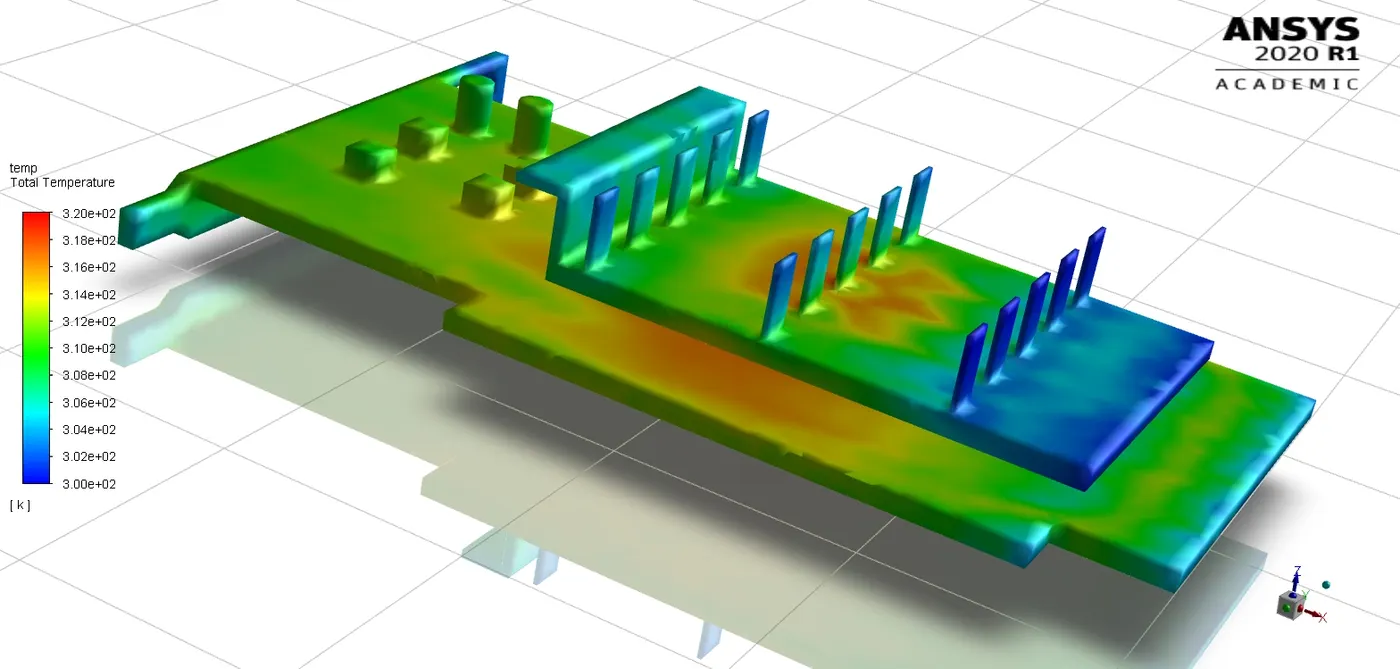
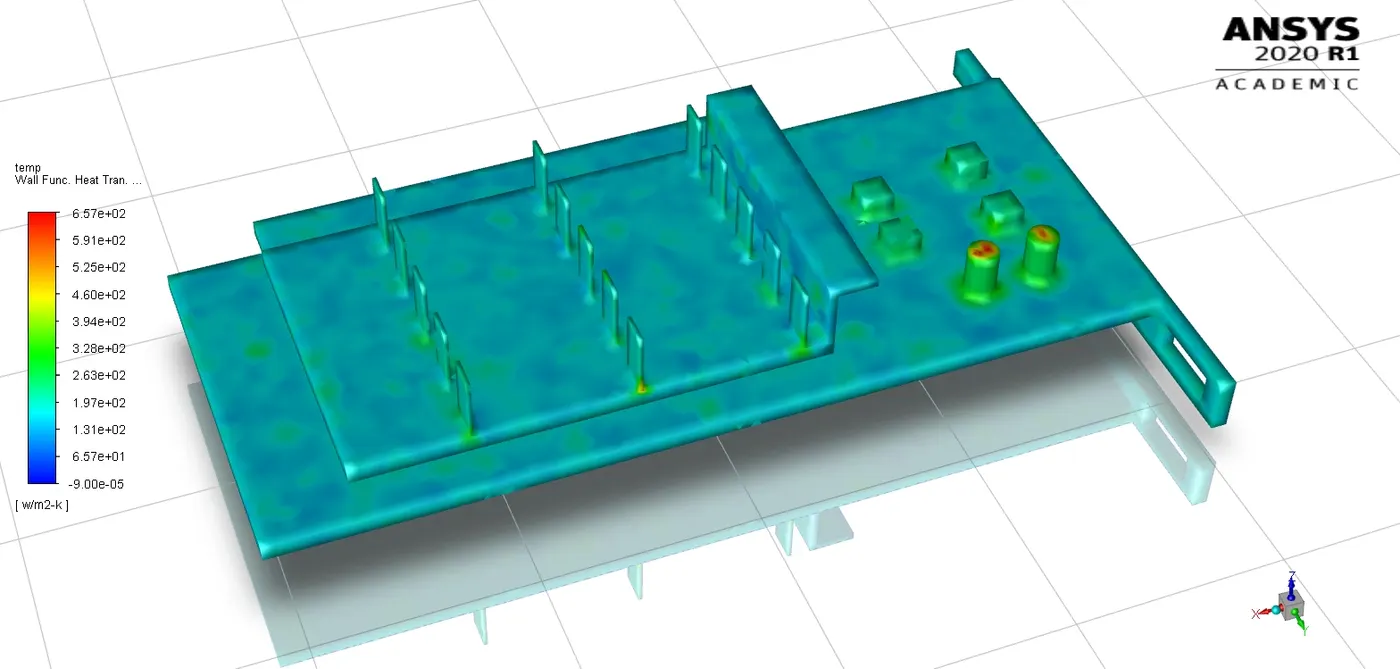
Figure below shows the countour of wall adjecent heat transfer coefficient which has attained a value of 57361.278 W/m^2 K
FOLLOWING SHOWS THE CONSOL OUTLUT
CASE 3 : VELOCITY OF INLET COOLING AIR
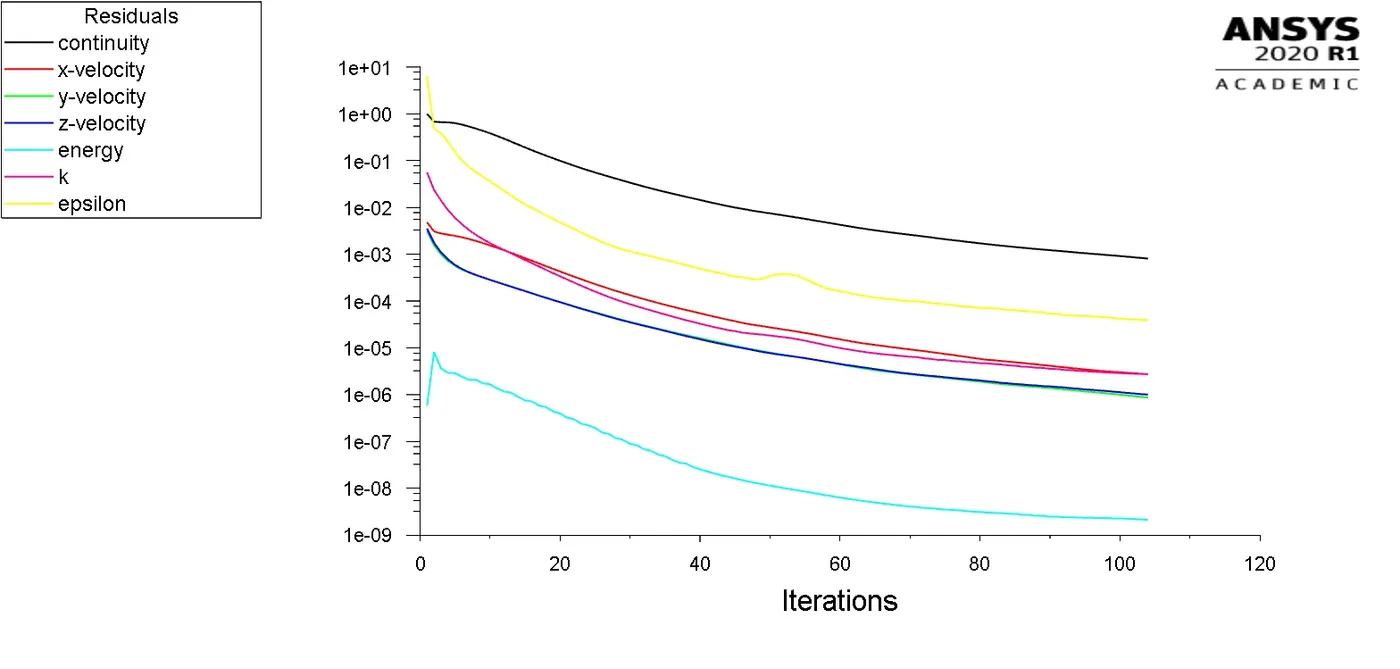
Following plot shows the residue for the simulation at5m/s simulationas run for100 ITERATION ensure convergence.
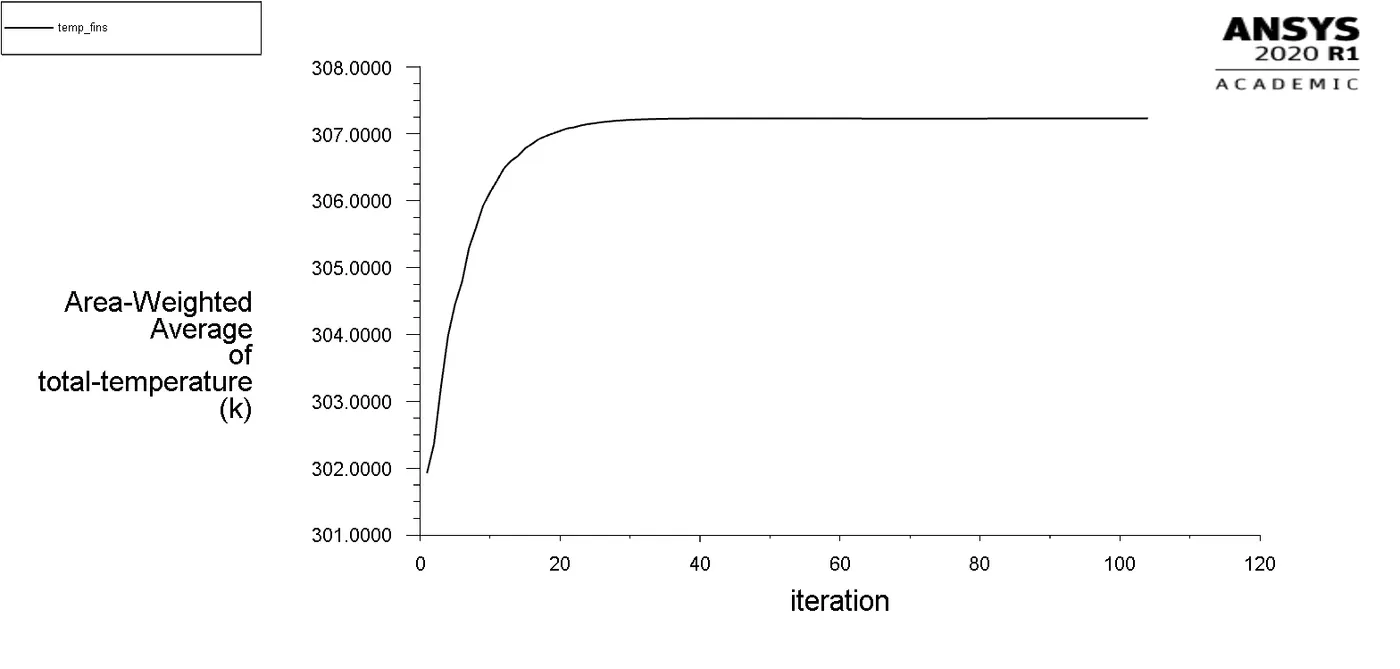
Following plot shows temperature of fins as simulation procced in forward direction. We can see that fin matterial has achived steady state temperature & the value is 307.23K ( 110iteration.)
Following plot shows temperature of GPU as simulation proceed forward. We can see that fin matterial has achived steady state temperature & the value is 315.5K AT theend of 100iteration.
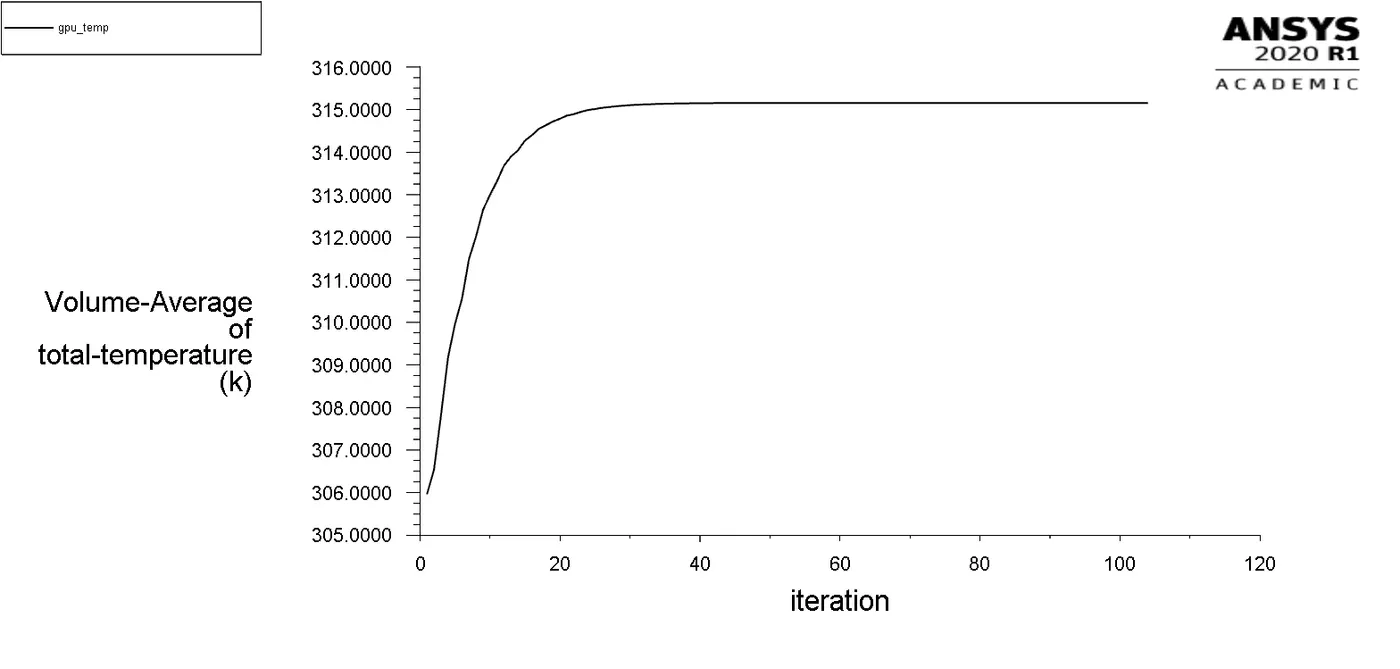
Following plot shows temperature of outlet air. We can see that fin matterial has achived steady state temperature & the value is 300.17Kat the end of 100iteration.
This temperature distribution is at end of 180 simulation. We can see the heat is getting dissipiated from GPU via fins. YELLOW/RED zones shows maximumm temperature whereas green color shows moderate temperature & the blue color shows the least temperature. Value of maximum temperature is inside GPU & is equal to approximately 315K where as the minimum temperature is of cooling air & equal to 300.18K
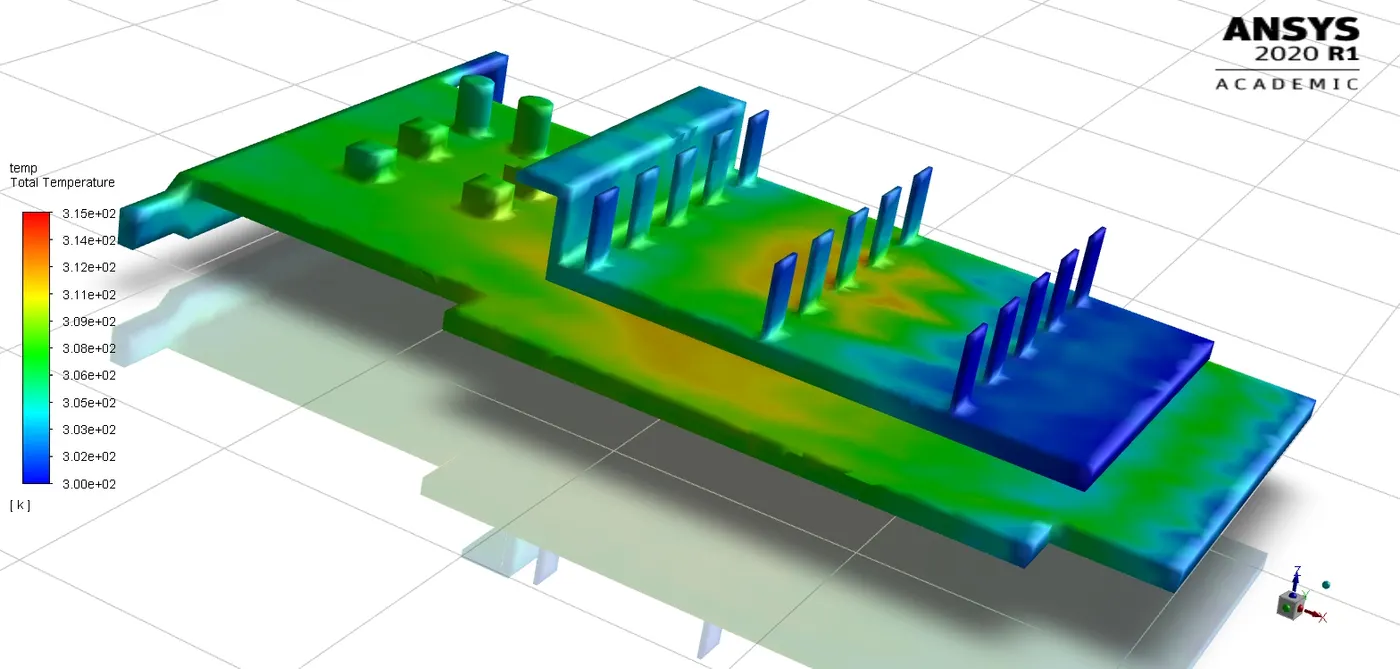
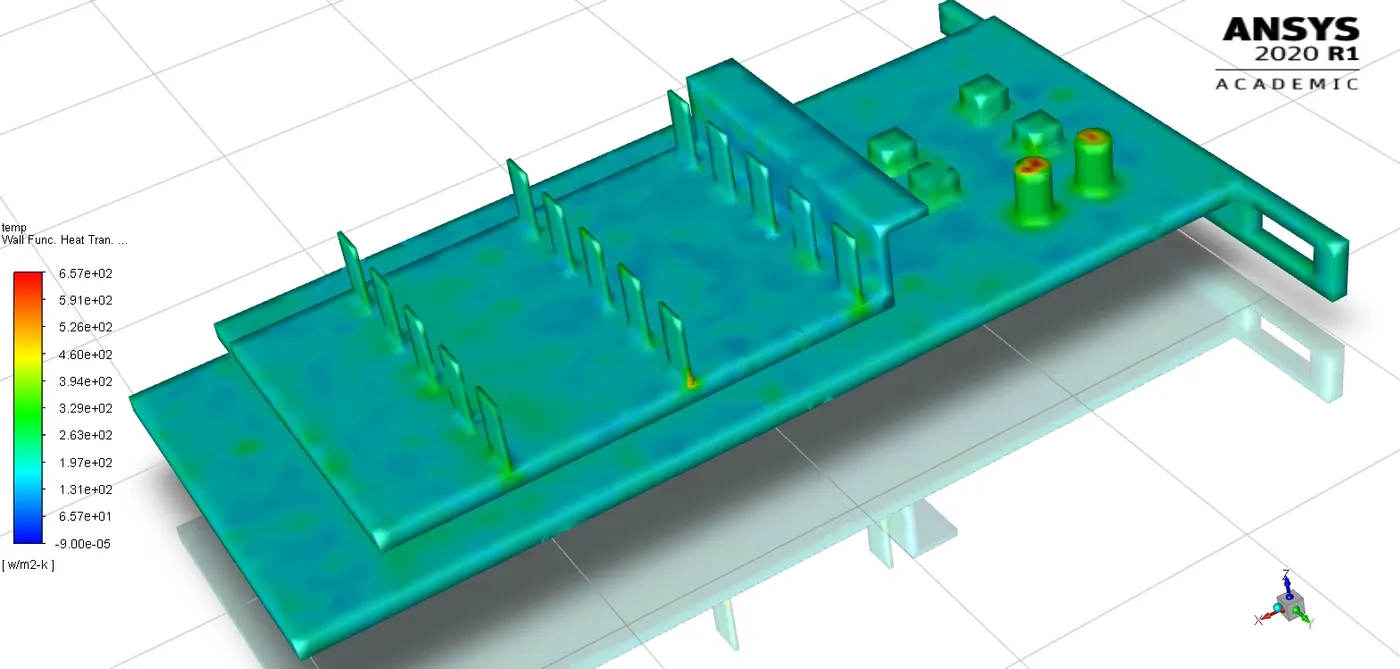
Figure below shows the countour of wall adjecent heat transfer coefficient which has attained a value of 65700w/m^2-k
CONCLUSION
1) TEMPERATURE V/S VELOCITY
|
VELOCITY in m/s |
GPU_TEMP in kelvin |
FINS_TEMP in kelvin |
WALL FUNCTION HEAT TRANSFER COEFFICIENT in w/m^2-k |
| 1 | 336.74 | 326.442 | 43038.481 |
| 3 | 319.84 | 310.78 | 57361.278 |
| 5 | 315.15 | 307.229 | 65700 |
-
From above table we can clearly conclude that as cooling fluid velocity increases, temperature of fins & GPU decreases
-
It can be clearly stated that increasing velocity results in more effective cooling.
- From temperature countours plot, the zones which are away from heat source is having less temperature & zones near the heat source are having are having maximum temperature.
- For confirmation of convergence, we can observe the plot for fin temperature & GPU temperature. It becomes parralel to x axis which means we have achieved steady state simulation beacuse parameters are not changing wrt number of iterations.
- Maximum temperature attained by GPU is 336.74k if velocity is 1m/s, 319.84k ifvelocity is 3m/s, 315.15k if velocity is 5m/s. It can be seen clearly as velocity increases due to more cooling the maximum temperature decreases.