CONJUGATE HEAT TRANSFER ANALYSIS ON A GRAPHICS CARD
AIM:
- Performing a steady-state conjugate heat transfer analysis on a model of graphics card.
- Simulation is run for velocities 1 m/s, 2.5 m/s, 5 m/s & 10 m/s based on the air velocity supplied by cooling fan.
OBJECTIVE:
- Determining the maximum temperature and heat transfer coefficient attained by the processor.
- Identifying potential hotspots on the graphics card model.
GOVERNING EQUATONS:
“Conjugate heat transfer” (CHT) is used to describe the variation of temperature between the solids and fluids due to the exchange of thermal energy between them.
Heat Transfer in a Solid - Conduction: Diffusion of heat due to temperature gradients in solids. A measure of the amount of conduction for a given gradient is heat conductivity. Conduction is described by Fourier’s law defining the conductive heat flux, q, proportional to the temperature gradient
q = -K*V*T
For Unsteady-state:
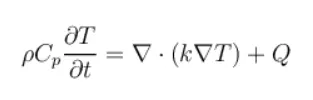
Heat Transfer in a Fluid - Convection: When heat is carried away by moving fluid. The flow can either be caused by external influences, forced convection or by buoyancy forces, natural convection.

GRAPHICS CARD:
A graphics card (also called a display card, video card, display adapter, or graphics adapter) is an expansion card which generates a feed of output images to a display device (such as a computer monitor). Frequently, these are advertised as discrete or dedicated graphics cards, emphasizing the distinction between these and integrated graphics. At the core of both is the graphics processing unit (GPU), which is the main part that does the actual computations, but should not be confused with the video card as a whole, although "GPU" is often used to refer to video cards.
Usually, the graphics card is made in the form of a printed circuit board (expansion board) and inserted into an expansion slot, universal or specialized (AGP, PCI Express).
POWER DEMAND:
Current high-performance video cards tend to consume large amounts of power. For example, the “Thermal Design Power (TDP)” for the GeForce Titan RTX is 280 watts. When tested while gaming, the GeForce RTX 2080 Ti Founder's Edition averaged 300 watts of power consumption.
Some of the most power-hungry graphics cards in the world are the AMD Radeon HD 7990 (375 W TDP) and Nvidia GeForce GTX 690 (300 W TDP), both are dual-GPU cards. Single-GPU boards tend to be quite a bit lower, though the AMD Radeon R9 290-series cards creep up closer to 300 W. In either case, that's a lot of heat to dissipate.
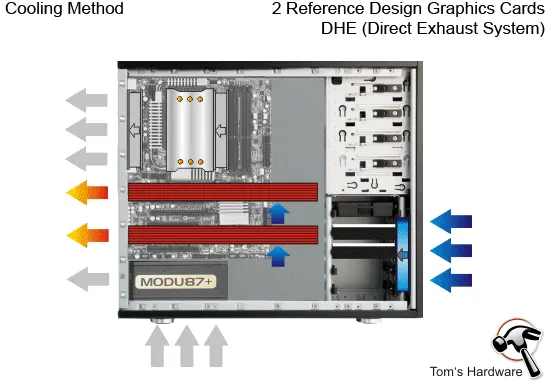
Modern video cards with a power consumption of over 75 watts usually include a combination of six-pin (75 W) or eight-pin (150 W) sockets that connect directly to the power supply. Providing adequate cooling becomes a challenge in such computers. Computers with multiple video cards may require power supplies over 750 watts. Heat extraction becomes a major design consideration for computers with two or more high-end video cards.
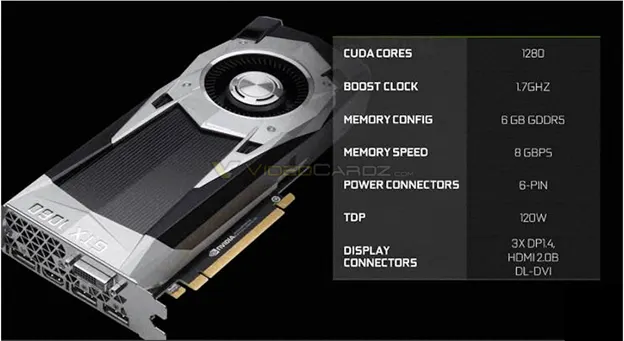
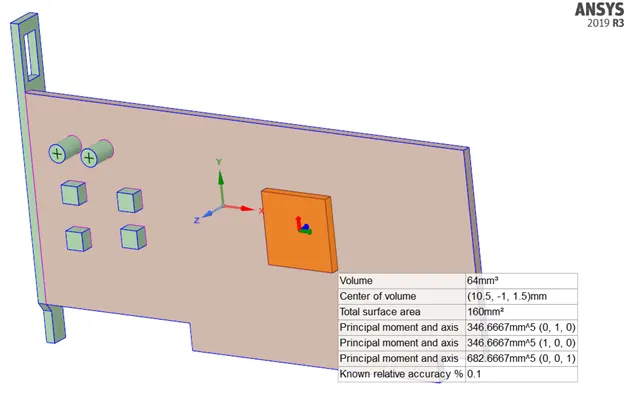
The graphic card currently used to run this simulation is Nvidia GTX-1060 clocked at 120 W and the TDP for this simulation is assumed to be the same as that of Nvidia GTX-1060. The GPU generates heat n a graphics card during calculations or processing of data, hence it is the heat source in this simulation.
GRAPHICS CARD MODEL:
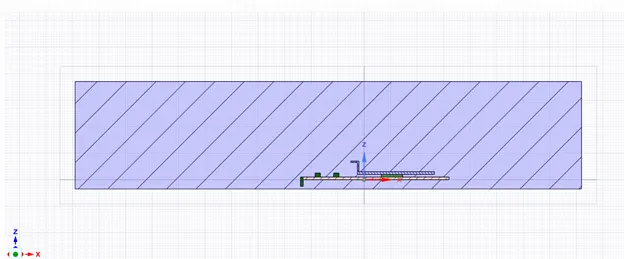
A simplified model of Graphics card with enclosure (flow domain).
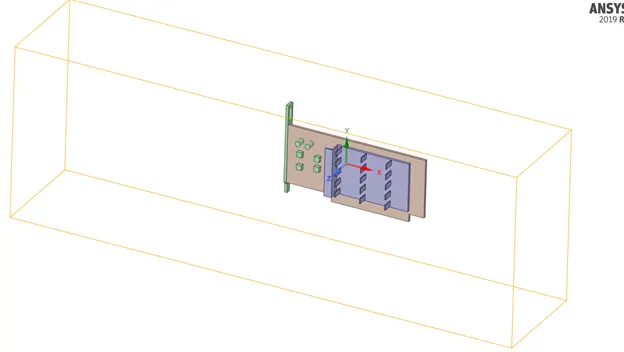
Interference check was done and share topology was set to share.
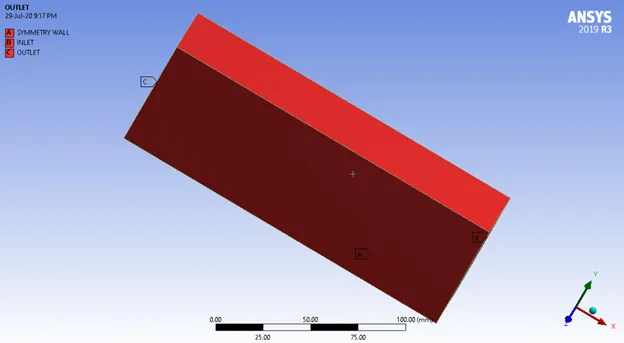
BOUNDARIES:
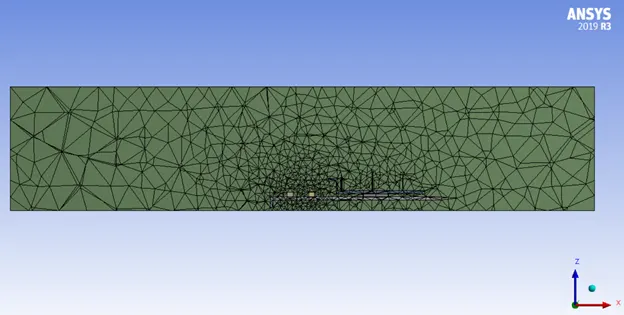
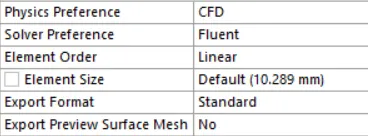
BASELINE MESH:

REFINED MESH:
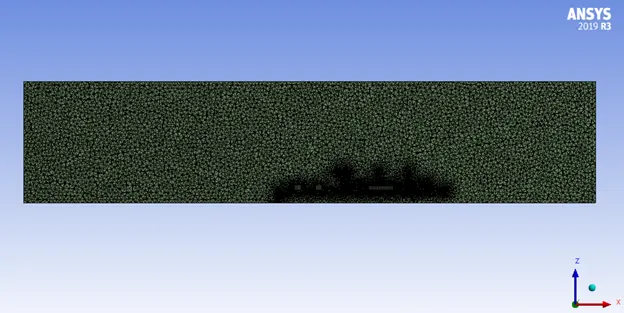
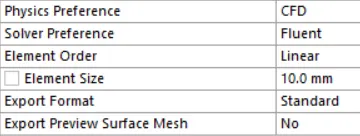
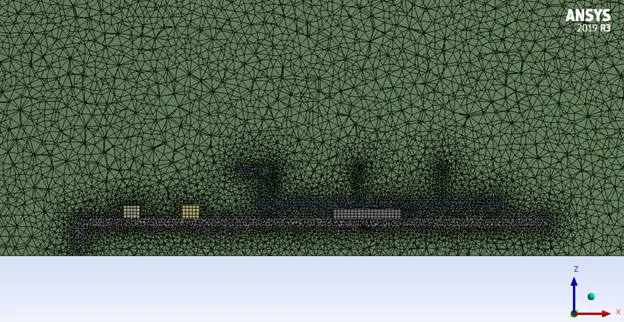
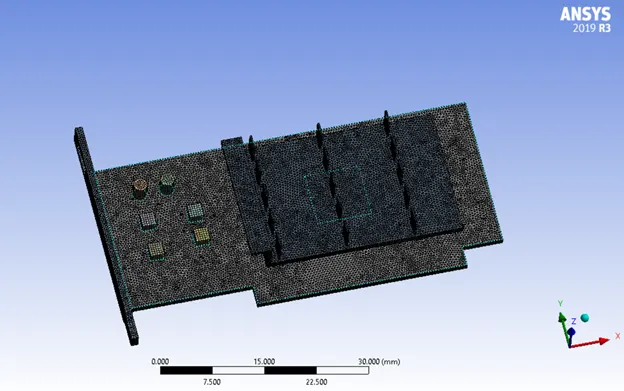
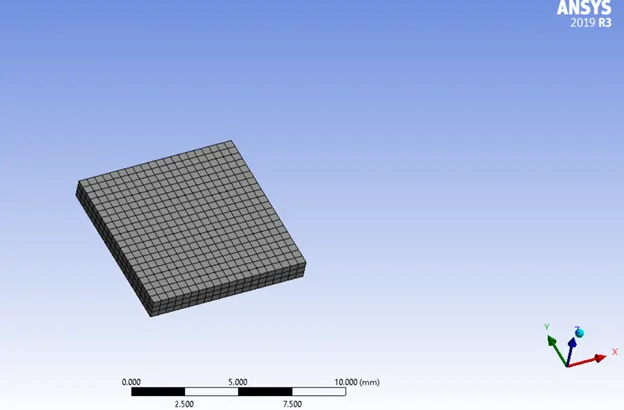

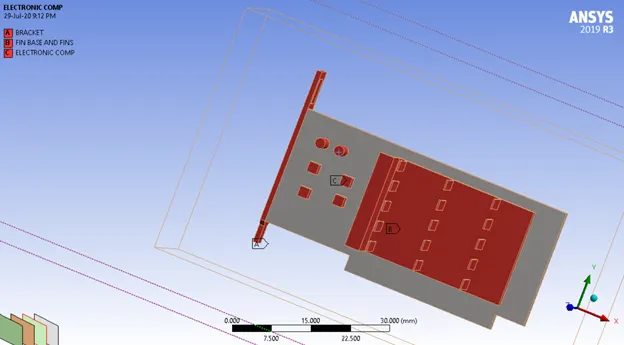
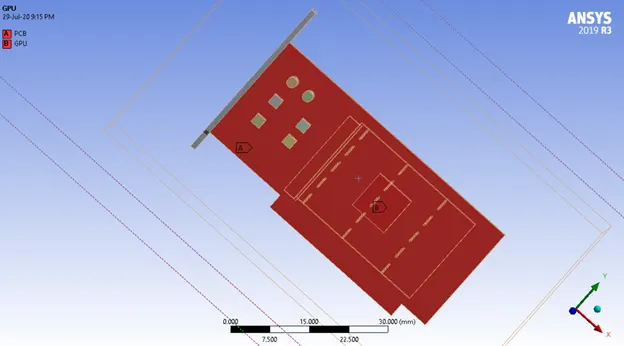
Sizing applied to each named selection (Boundaries):
Body Sizing -> On Enclosure -> Element size = 1.5 mm
Body Sizing -> On Graphics Card (all 10 bodies) -> Element size = 0.4 mm
Face Sizing -> On Graphics Card (all 145 faces) -> Element size = 0.35 mm
Since we need to find the wall heat transfer and temperature on the processor, the finest mesh was applied there.
STEADY STATE SMULATION:
MATERIALS USED (Properties Below):
Cooling Fluid `->` Air
Bracket `->` Steel
PCB (Printed Circuit Board) `->` Copper
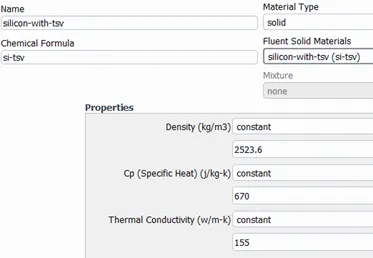
Electronic Components `->` Silicon with TSV (This is an user defined solid material, not found in fluent database)
GPU (Processor) `->` Silicon with TSV (This is an user defined solid material, not found in fluent database)
Fin Base and Fins `->` Aluminium
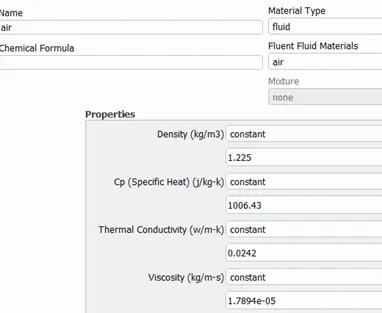
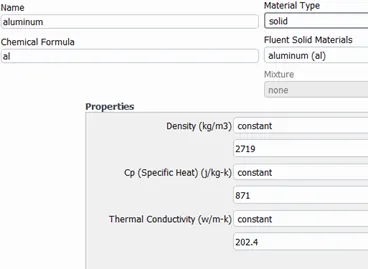
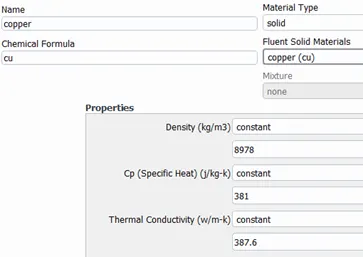
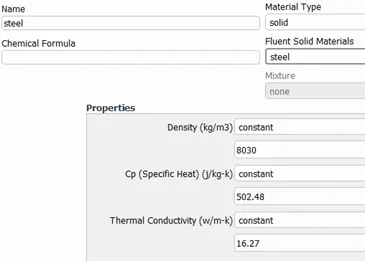
ρ = 1.225 kg/m3
μ = 1.7894 × 10^-5 kg/m-s
L = 0.056 m
ReL = ρ*V*L/μ
Vmax = 5 m/s
ReL = (1.225×5× 0.056)/1.7894 × 10^-5 = 19,168.436347
Hence, Turbulence Model. Since the wall functions needs to be considered to get wall precise values, k-epsilon Realizable model is used in the simulation. With energy equation turned on for conjugate heat transfer analysis.
Solution Method: COUPLED
Mach Number, M = velocity of fluid/velocity of sound
Velocity of fluid = V = 5m/s
Velocity of Sound = `sqrt ((γ×P)/ρ)`
𝛄 = 1.4
P = 101325 Pa
Velocity of Sound = 340.29399 m/s
M = 5/340.29399 = 0.0146931775
M < 0.3 (Here, we do not need to take the compressibility factor into account; Incompressible flow)
Hence, Pressure based solver is used.
BOUNDARY CONDITIONS:
Simulation will be done for 4 cases based on the inlet air velocity, which is dependent on the cooling fan.
CASE 1 `->` INLET: Velocity Magnitude = 1 m/s
CASE 2 `->` INLET: Velocity Magnitude = 2.5 m/s
CASE 3 `->` INLET: Velocity Magnitude = 5 m/s
CASE 4 `->` INLET: Velocity Magnitude = 10 m/s
Temperature = 300 K
OUTLET: Pressure (Gauge) = 0 Pa
The Thermal Design Power (TDP) of the Graphic Card assumed here (Nvidia GTX 1060) is 120 W.
Hence, the total heat energy generated per volume by the GPU or Processor (W) = `(TDP)/(Volume of GPU)`
W = `120/(64×10^(-9))` = `1.875 × 10^(9)` W/m3
In Cell Zones `->` GPU `->` Edit `->` check Source Terms `->` Number of energy sources =1
Constant Energy Source = 1.875e9 W/m3
CASE 1, VMin = 1 m/s:
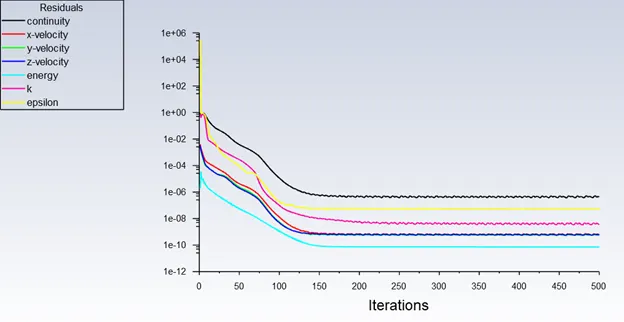
Number of iterations given to run = 500
Number of iterations to converge = 180
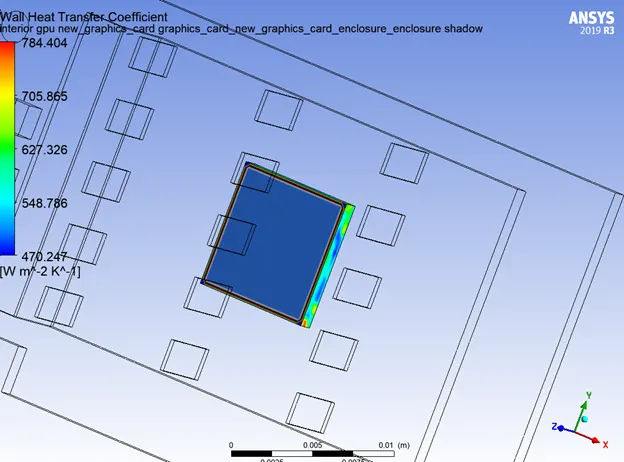
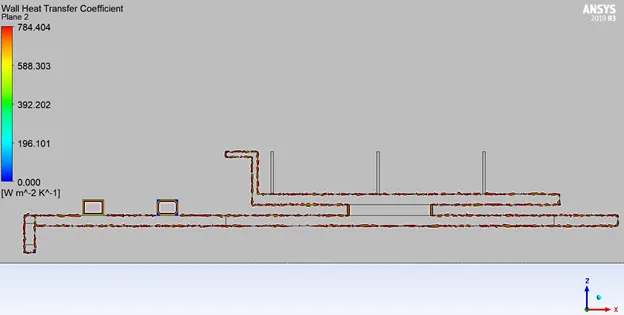
Local Wall Heat Transfer Coefficient
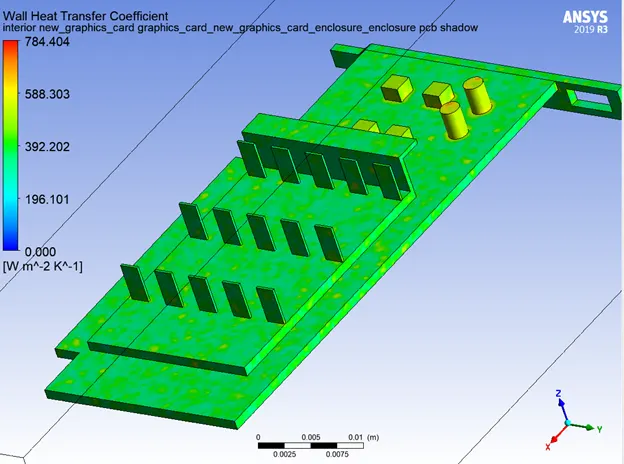
Global Wall Heat Transfer Coefficient
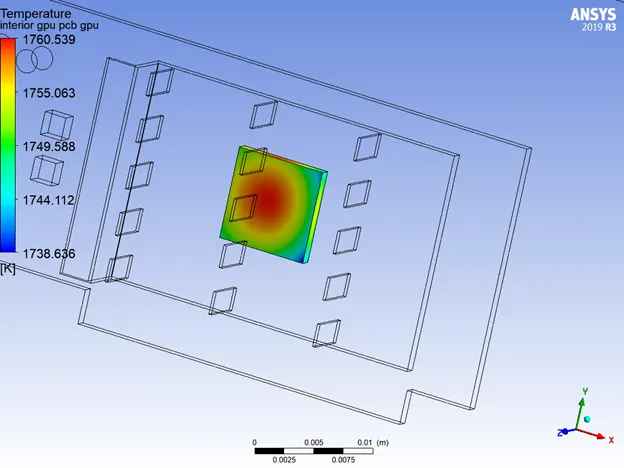
Local Temperature Distribution on Individual Parts
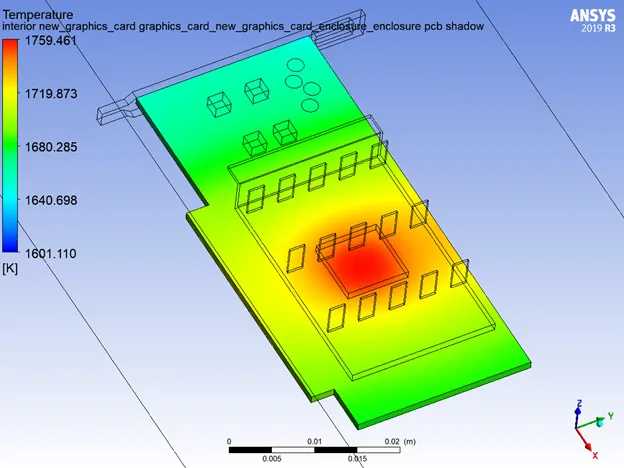
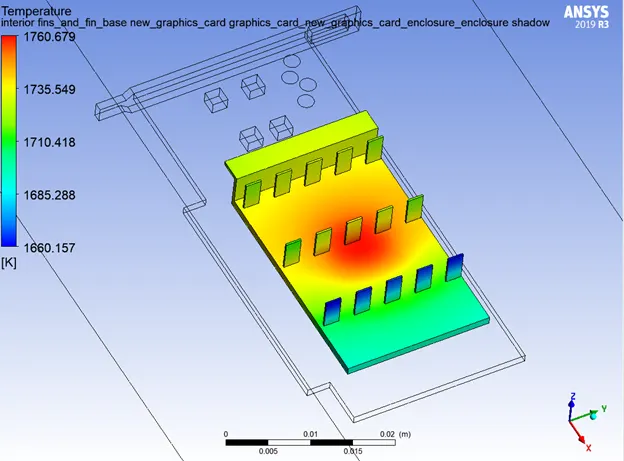
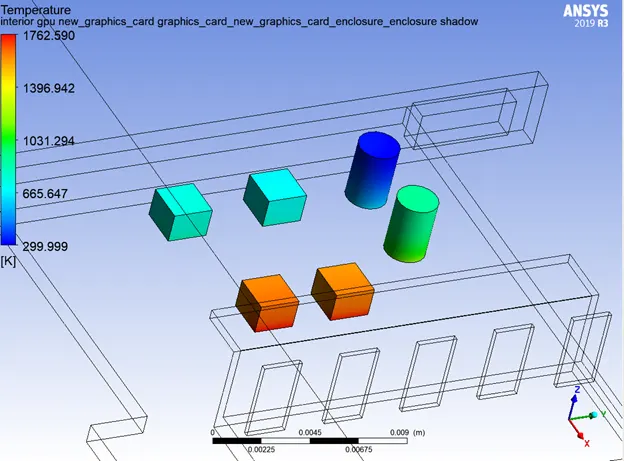
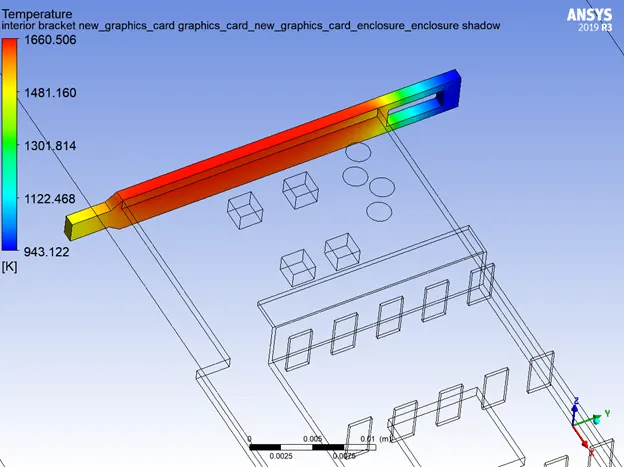
Global Temperature Distribution
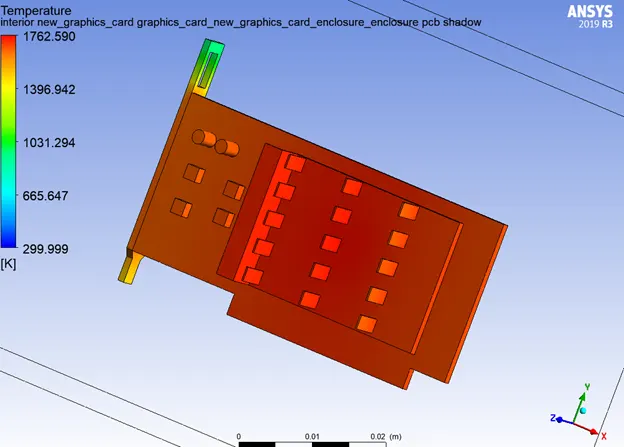
Temperature Contour
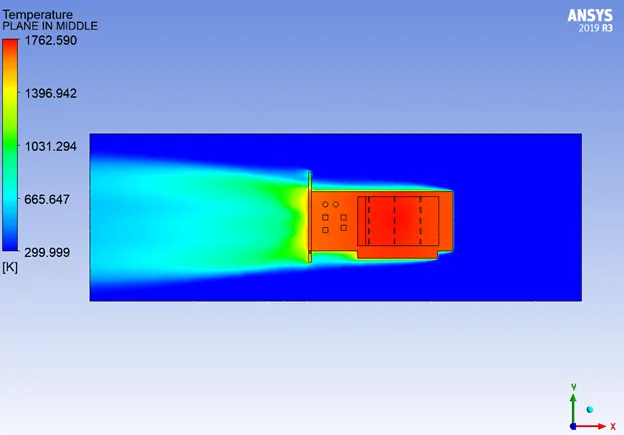
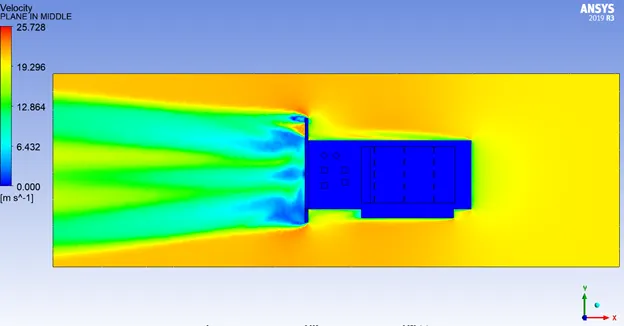
Velocity Contour
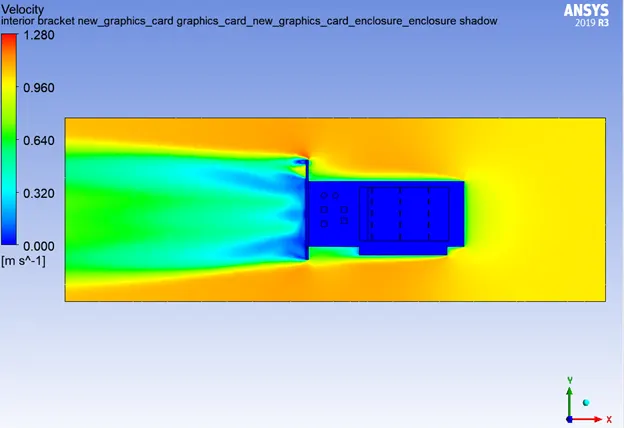
CASE 2, V = 2.5 m/s:
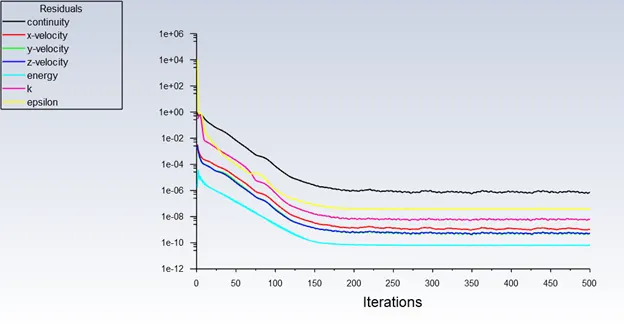
Number of iterations given to run = 500
Number of iterations to converge = 180
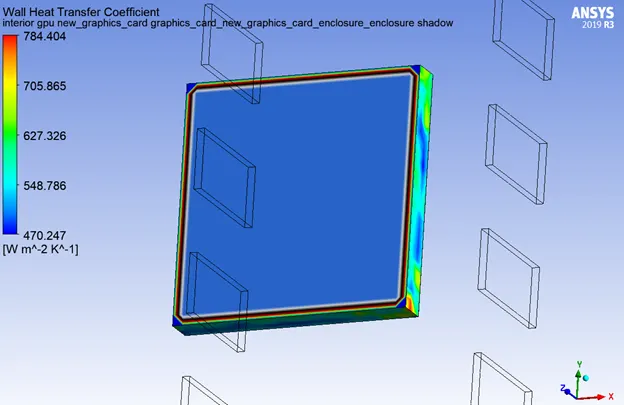
Local Wall Heat Transfer Coefficient
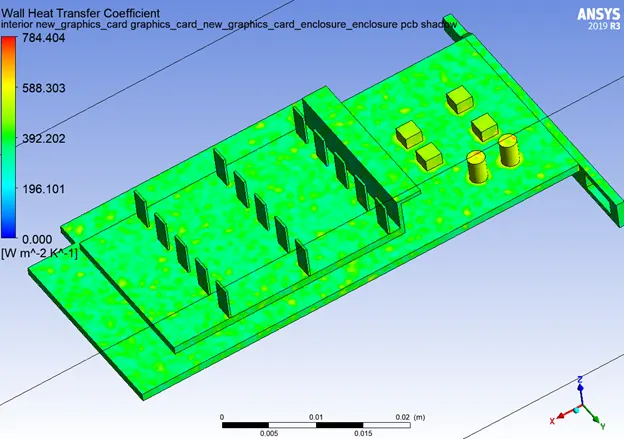
Global Wall Heat Transfer Coefficient
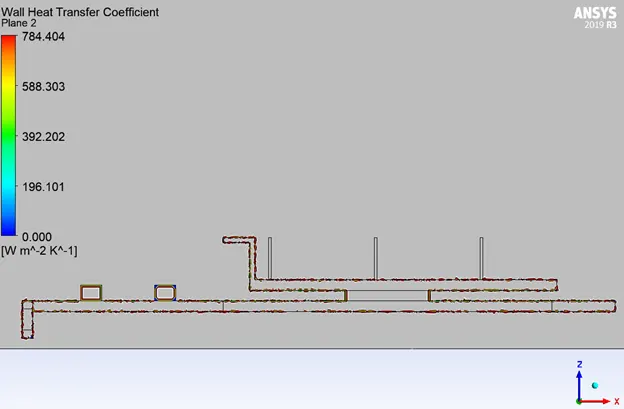
Local Temperature Distribution on Individual Parts
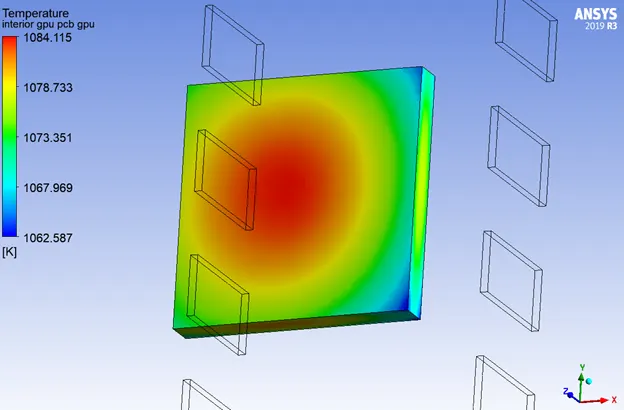
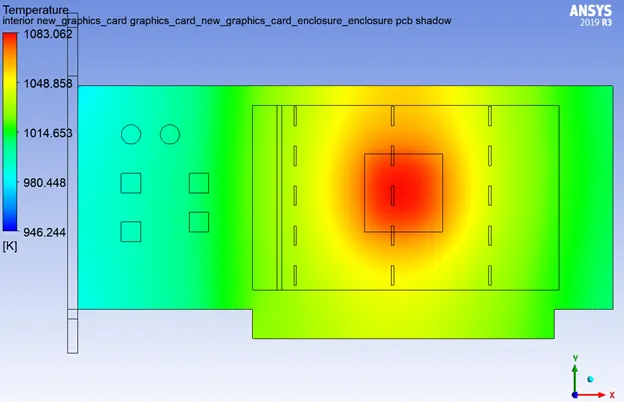
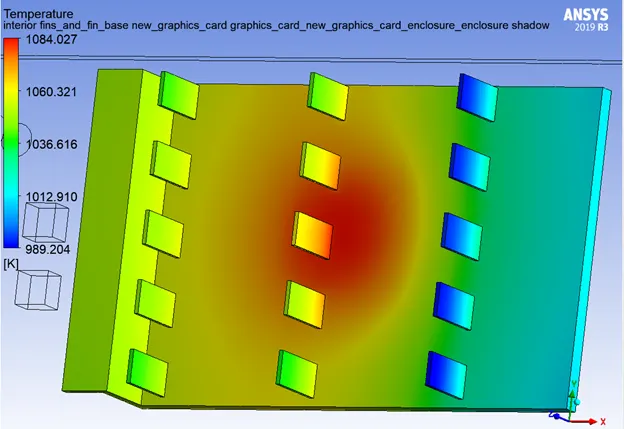
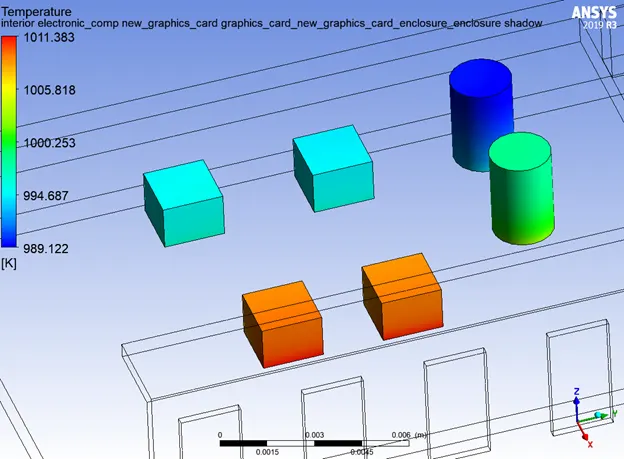
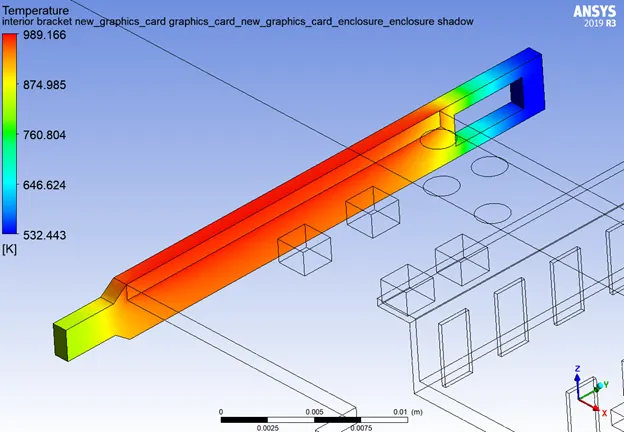
Global Temperature Distribution
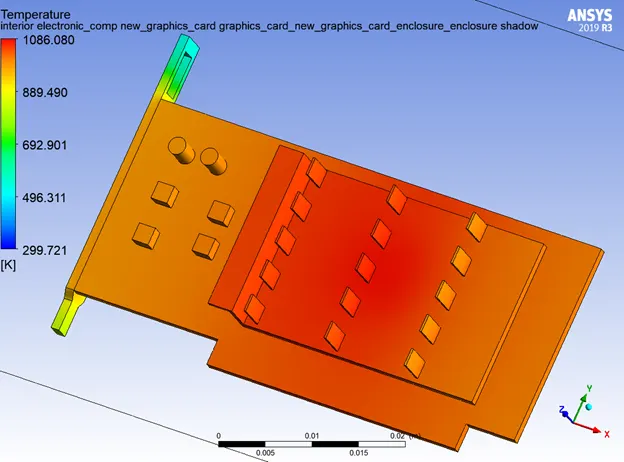
Temperature Contour
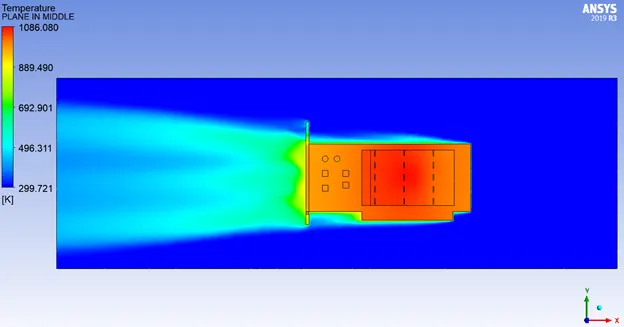
Velocity Contour
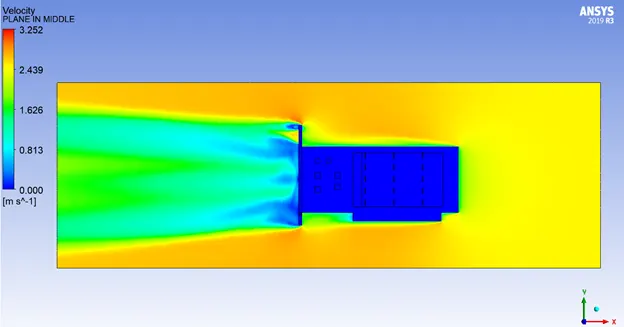
CASE 3, V = 5 m/s:
Number of iterations given to run = 700
Number of iterations to converge = 610
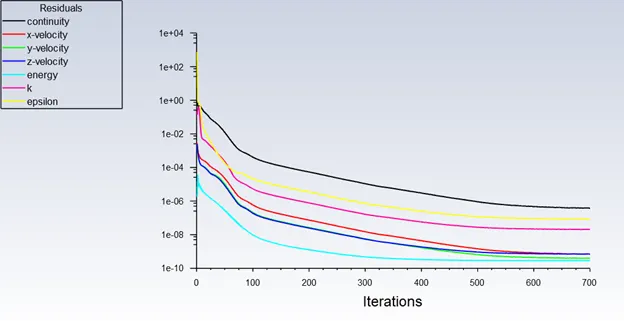
Local Wall Heat Transfer Coefficient
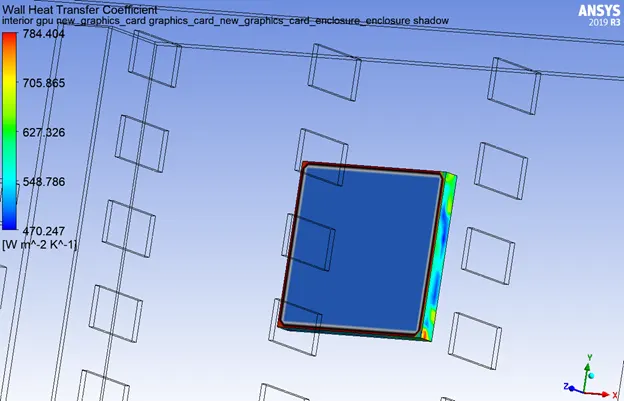
Global Wall Heat Transfer Coefficient
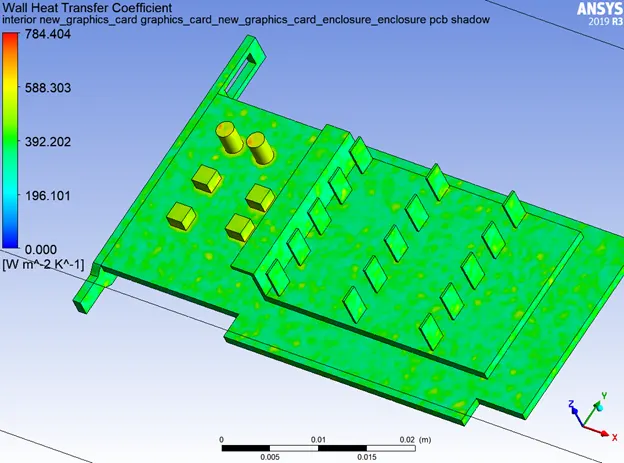
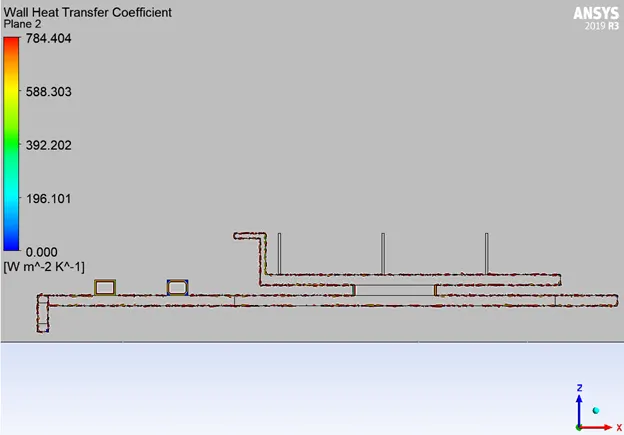
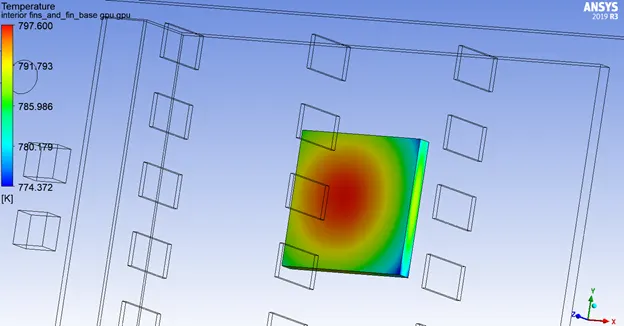
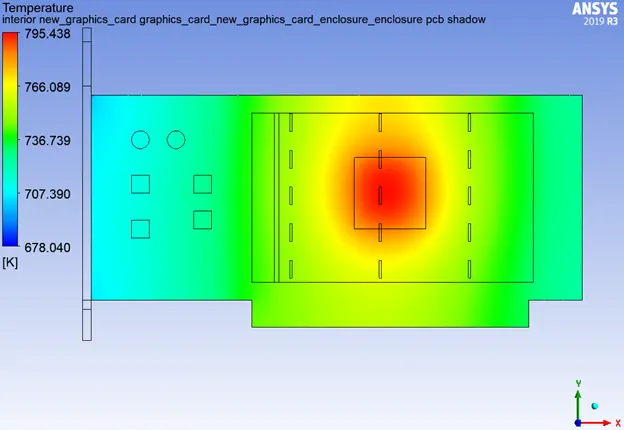
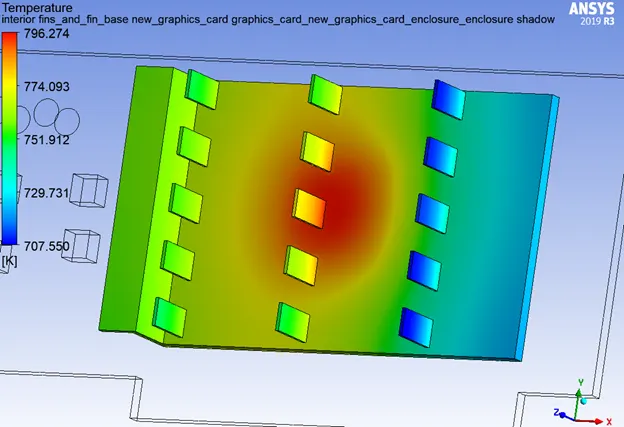
Local Temperature Distribution on Individual Parts
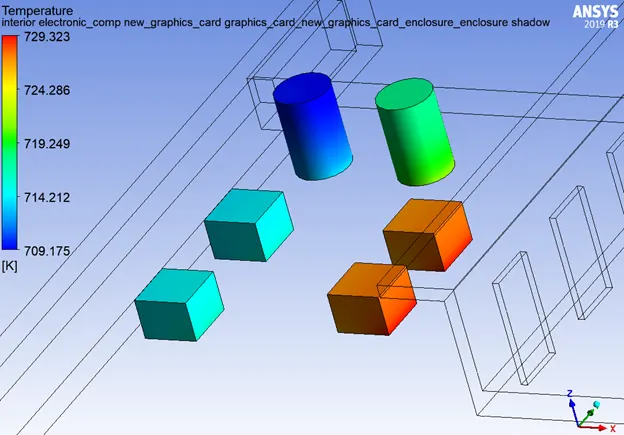
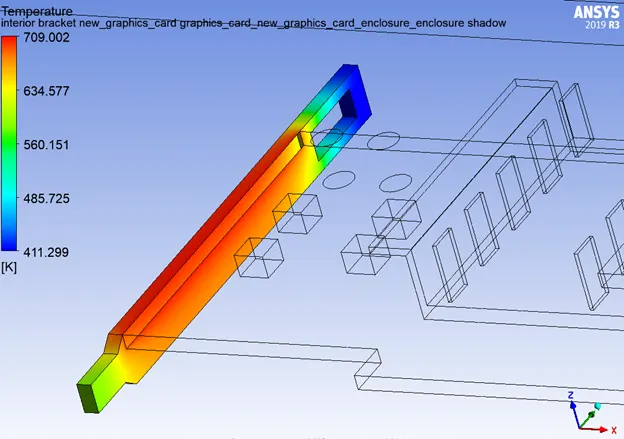
Global Temperature Distribution
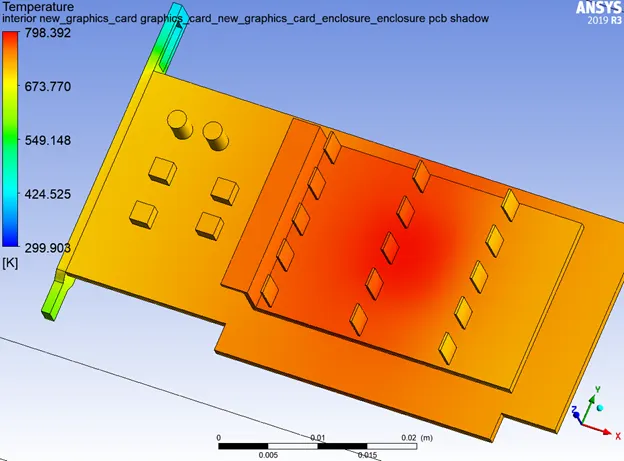
Temperature Contour
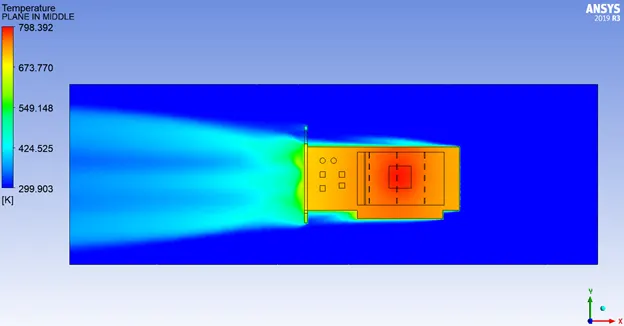
Velocity Contour
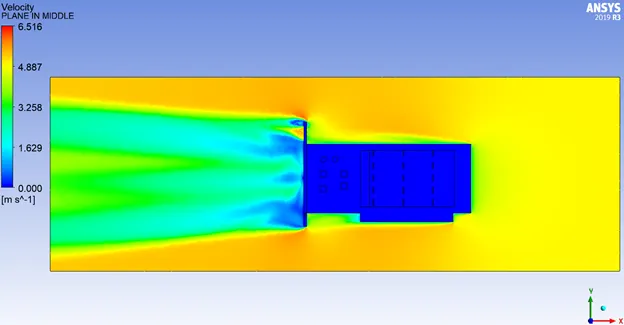
CASE 4, VMax = 10 m/s:
Number of iterations given to run = 500
Number of iterations to converge = 350
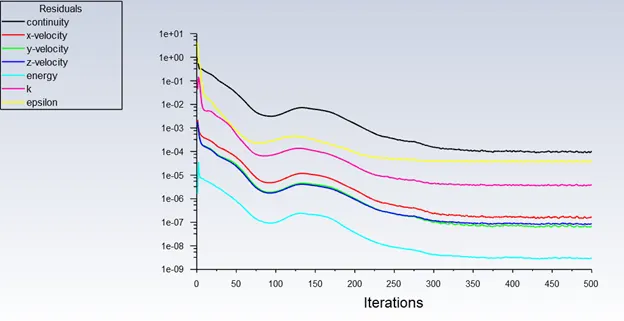
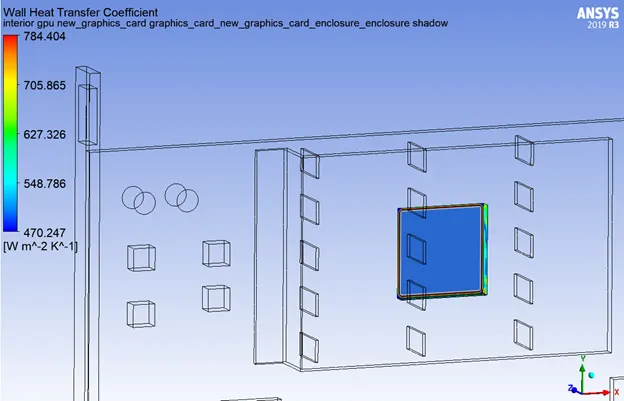
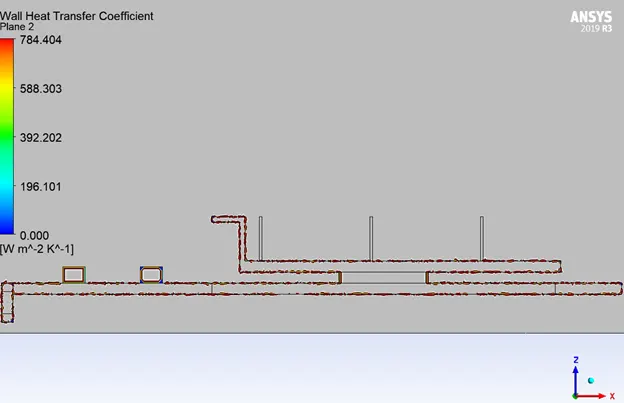
Local Wall Heat Transfer Coefficient
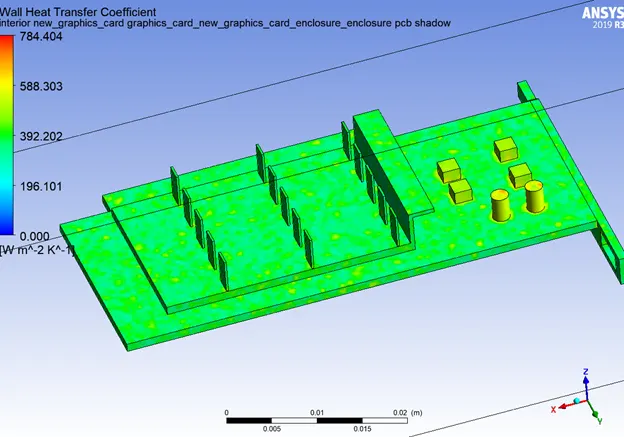
Global Wall Heat Transfer Coefficient
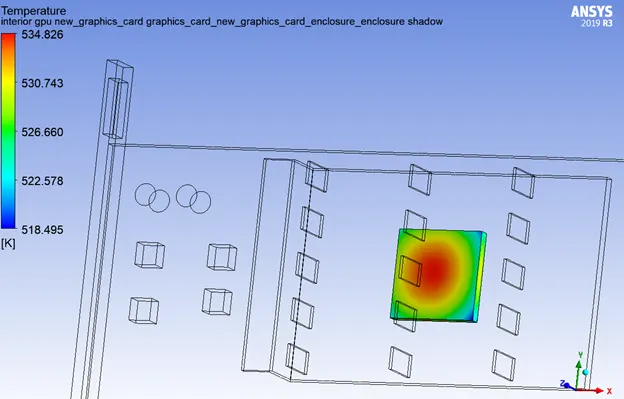
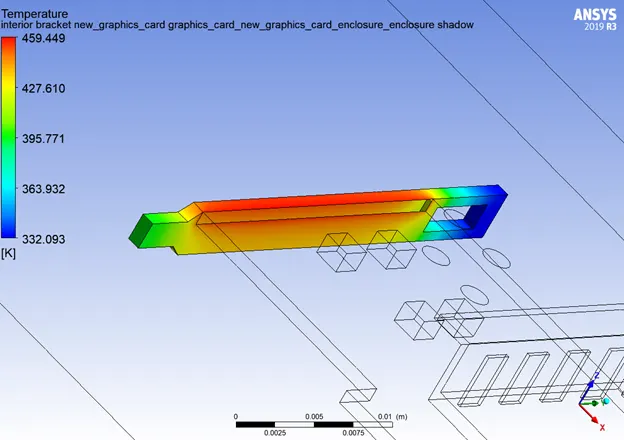
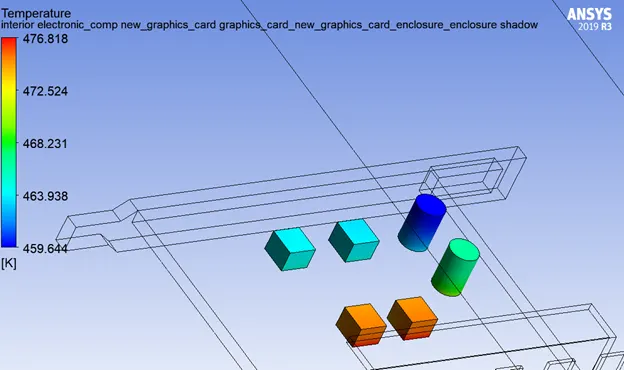
Local Temperature Distribution on Individual Parts
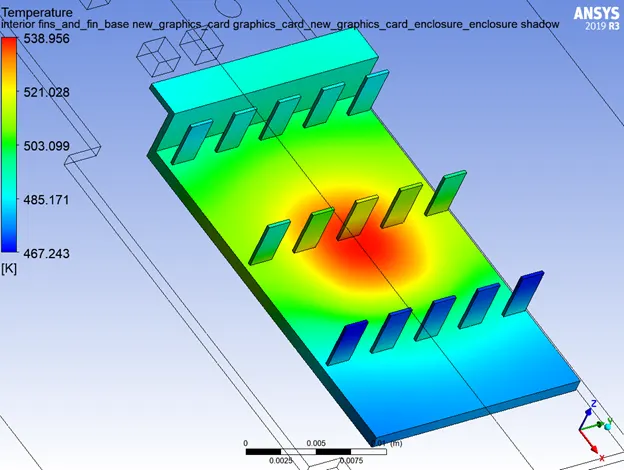
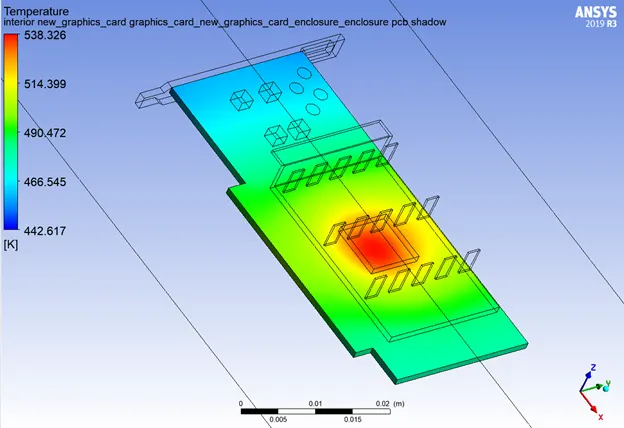
Global Temperature Distribution
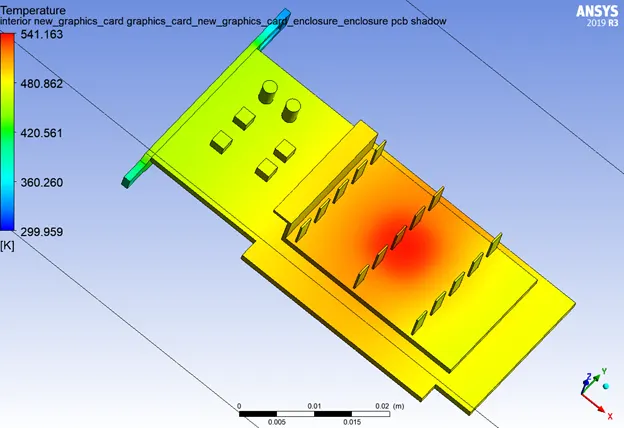
Temperature Contour
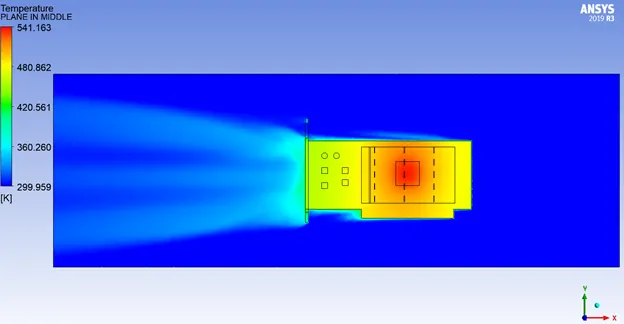
Velocity Contour
INFERENCE:
|
CASES |
INLET VELOCITY (FAN) |
MESH |
MAX. TEMPERATURE ATTAINED BY GPU (PROCESSOR) |
MAX. HEAT TRANSFER COEFFICIENT ATTAINED BY GPU (PROCESSOR) |
|
1 |
1 m/s |
Refined Mesh |
1762.59 K |
784.404 W/m2K |
|
2 |
2.5 m/s |
Refined Mesh |
1086.08 K |
784.404 W/m2K |
|
3 |
5 m/s |
Refined Mesh |
798.392 K |
784.404 W/m2K |
|
4 |
10 m/s |
Refined Mesh |
534.826 K |
784.404 W/m2K |
The mesh used in this simulation offered finest grid in the GPU (processor), body sizing used here provided higher accuracy in the calculation of the wall heat transfer coefficient. The solution method coupled was used for the ease of time required for convergence.
CONCLUSION:
The above observations show that, as the velocity of air increases the temperature of the GPU (Processor) and of the other components of the graphic card decreases. This may be due to the fact that an increase in the velocity facilitate the rate of heat transfer by convection and therby promotes cooling of the electronic components and the graphic card as a whole. So, at the maximum air velocity (when cooling fan at maximum rpm) the coolng action is more pronounced.
The possible hotspots in the graphics card due to the heat generation by the GPU was determined by the temperature distribution of individual components and the temperature contours. As a whole graphics card, the predominant hotspot is the GPU. Looking at it individually, in the fin base the hotspot is nearer to the area connected to the GPU, the same goes for the PCB (Printed Circuit Board). For the Electronic Components, the ones near to the GPU had higher temperature and for the Bracket, the joint where the PCB attaches to it had a higher temperature.