Combustion simulation using Ansys Fluent
Abstract:
A combustion analysis is performed in this project with methane-air mixture with eddy dissipation mechanism. A combustor model is designed with necessary turbulent modelling scheme and post processing the solution by observing the different mass fraction of reacting species. A comparative study is also done to improve the NOX and soot level by adding few percentages of water with fuel to reduce the emission of pollutants.
Objective:
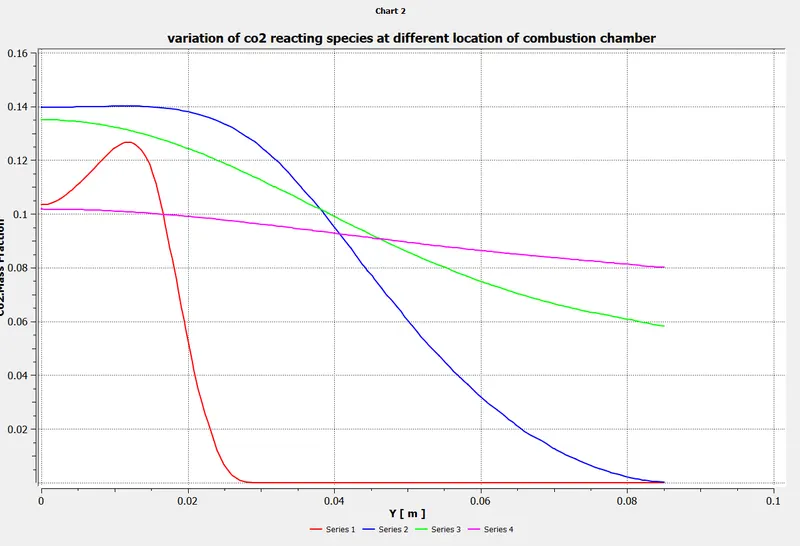
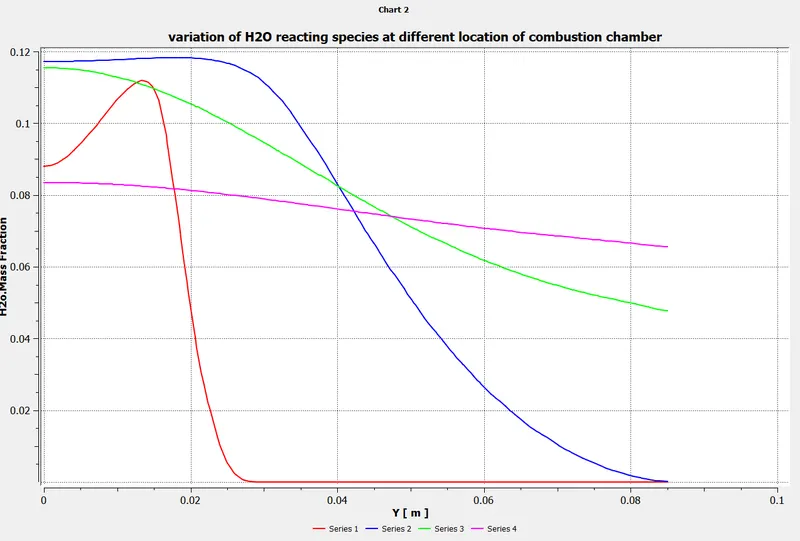
- Perform a combustion simulation on the combustor model and plot the variation of the mass fraction of the different species’ in the simulation using line probes at different locations of the combustor as shown in Fig. You need to plot for CO2, H2O, CH4, N2, O2, NOx emissions & Soot formation.
- In the next part, you need to add the water content in the fuel from 5% to 30% by mole and observe the effect of it on the results. It is necessary to provide line plots and contours to prove the claim.
Introduction:
Combustion is the scientific word for burning. In a combustion reaction, a substance reacts with oxygen from the air. Combustion reactions happen at high temperatures, and transfer energy to the surroundings as light and heat. This is why you see flames when things burn. One important combustion reaction is that of methane. Methane reacts with oxygen from the air and produces either a hot blue or an orange flame. The energy that the reaction produces can be used to heat water, cook food, generate electricity or even power vehicles. The products of combustion reactions are compounds of oxygen, called oxides. Since methane is made up of atoms of carbon and hydrogen, the products of its combustion reaction are oxides of carbon and hydrogen. The names of these oxides are carbon dioxide and water.
Combustion of an organic fuel in air is always exothermic because the double bond in O2 is much weaker than other double bonds or pairs of single bonds, and therefore the formation of the stronger bonds in the combustion products CO2 and H2O results in the release of energyhe bond energies in the fuel play only a minor role, since they are similar to those in the combustion products; e.g., the sum of the bond energies of CH4 is nearly the same as that of CO2. The heat energy is approximately −418 kJ per mole of O2 used up in the combustion reaction, and can be estimated from the elemental composition of the fuel. Uncatalyzed combustion in air requires relatively high temperatures. Complete combustion is stoichiometry concerning the fuel, where there is no remaining fuel, and ideally, no residual oxidant. Thermodynamically, the chemical equilibrium of combustion in air is overwhelmingly on the side of the products. However, complete combustion is almost impossible to achieve, since the chemical equilibrium is not necessarily reached, or may contain unburnt products such as Co and NO and even soot. Thus, the produced smoke is usually toxic and contains unburned or partially oxidized products. Any combustion at high temperatures in air, which is 78 percent N2, will also create small amounts of several NO commonly referred to as Nox since the combustion of nitrogen is thermodynamically favored at high, but not low temperatures.
Types of combustion:
1. Complete Combustion
Complete combustion requires a combination of fuel and oxygen. During the combustion process, the reactant is completely burned in oxygen, leaving a limited amount of byproduct. When a hydrocarbon is burned in oxygen, the reaction will usually lead to the production of carbon dioxide and water.
When other elements are burned, they typically leave commonly known oxides leftover. For example, carbon will produce carbon dioxide, nitrogen leads to nitrogen dioxide and sulfur will yield so2.
2. Incomplete Combustion
Incomplete combustion occurs when there is not enough oxygen for the fuel to fully react. In this case, the byproducts, carbon dioxide and water, are not produced. Instead, the reaction will leave behind carbon monoxide and soot. Incomplete combustion also produces less energy than complete combustion, making it less efficient overall.
3. Rapid Combustion
When rapid energy requires external heat energy for a reaction to occur, it is classified as rapid combustion. This reaction will continue to remain live until all of the fuel is burned up. As a byproduct, this form of combustion produces large amounts of heat and light energy at a rapid pace.
One common example of this occurs when you light a candle. The combustion reaction takes place when a flame ignites the wick, producing a constant light that doesn’t stop until all of the wax has been burned through.
4. Spontaneous Combustion
Spontaneous combustion received its name because no outside energy is required for the reaction to begin. It occurs spontaneously. During spontaneous combustion, an increase in temperature due to an internal reaction, followed by thermal runaway and the presence of sufficient oxygen will start the process. Once the fuel reaches a temperature that is high enough, it will ignite all on its own. For example, phosphorus will self-ignite at room temperature without any application of heat.
5. Explosive Combustion
Explosive combustion is exactly what you would expect; an explosion. This type of combustion occurs at an extremely rapid pace. When a force is used to ignite the fuel, heat, light and sound energy are produced immediately. One common example of this can be seen in fireworks. When a spark lights the fuse, the fireworks explode, causing heat, light and sound.
Modelling approach:
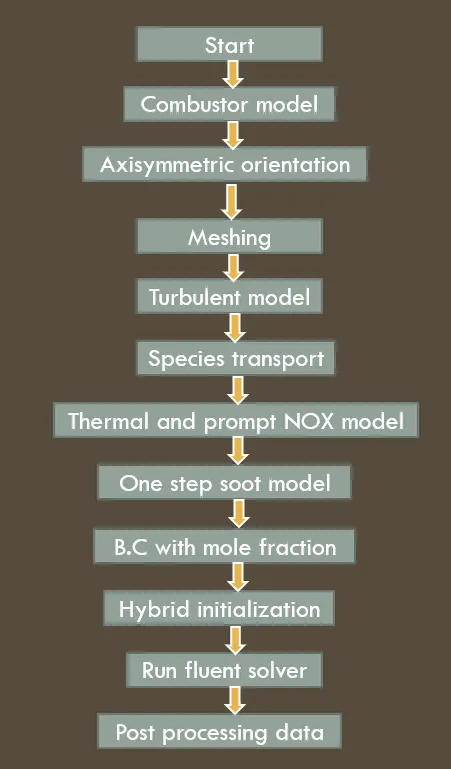
Geometry design:
- First import the combustor model as stp file to space claim design modeler.
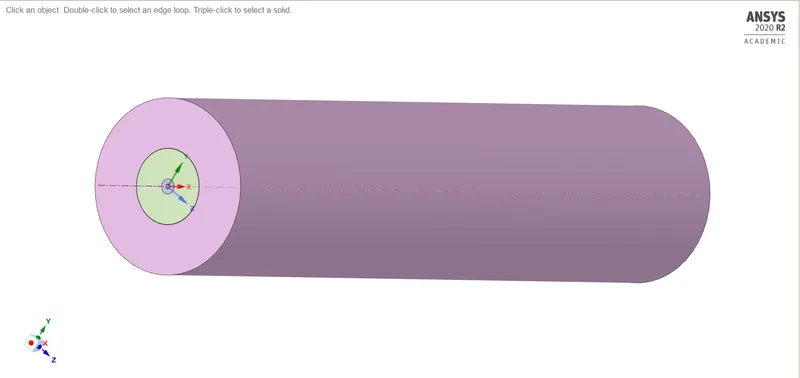
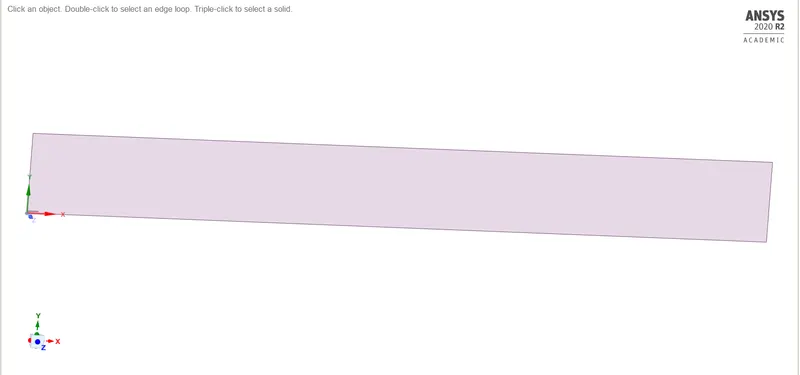
- We split the body symmetrically from x and y plane. This is done to reduce the computational time and power.
- Choose the split body command and select the outer wall, fuel inlet wall, combustion wall. Select the cut plane as x axis and cut the body.
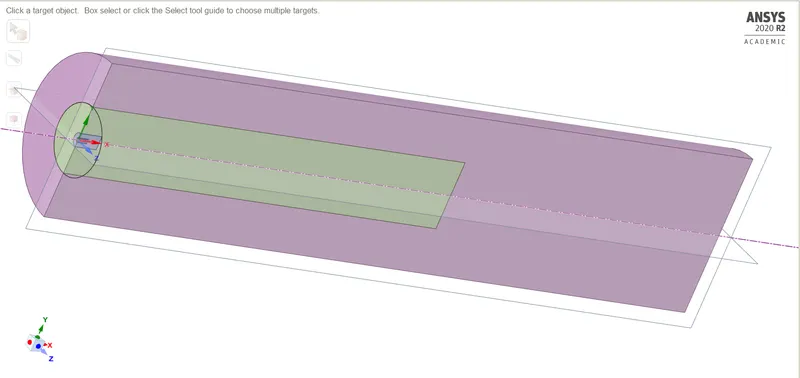
- Similar procedure is repeated in y axis plane.
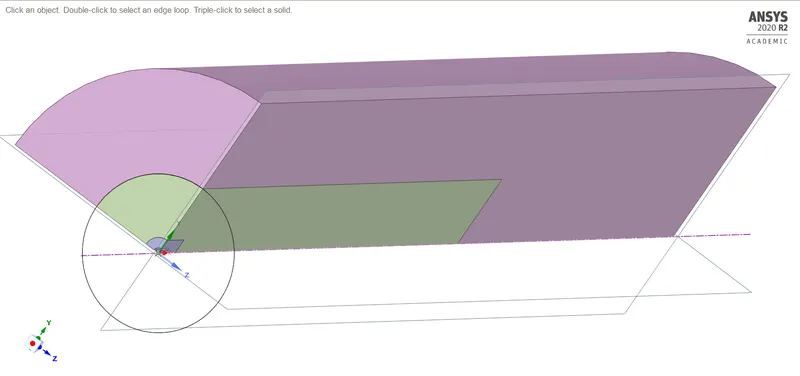
- Now press ctrl+c to copy the internal cut portion and paste it in a new design space.
- This is the final geometry, where combustion simulation will be performed.
Meshing:
- open the mesh console.
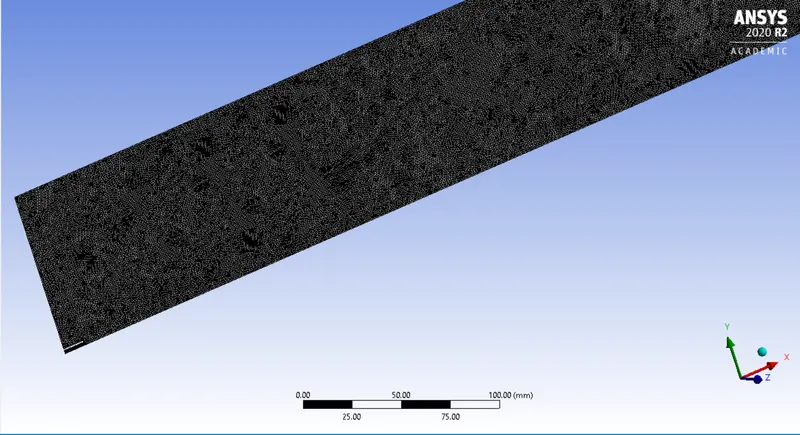
- go to mesh size>> provide sizing of 1mm>> activate the capture proximity icon>> click on generate mesh icon
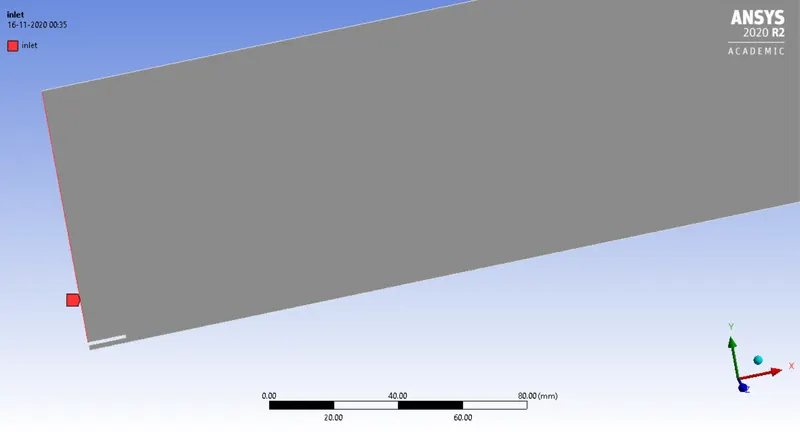
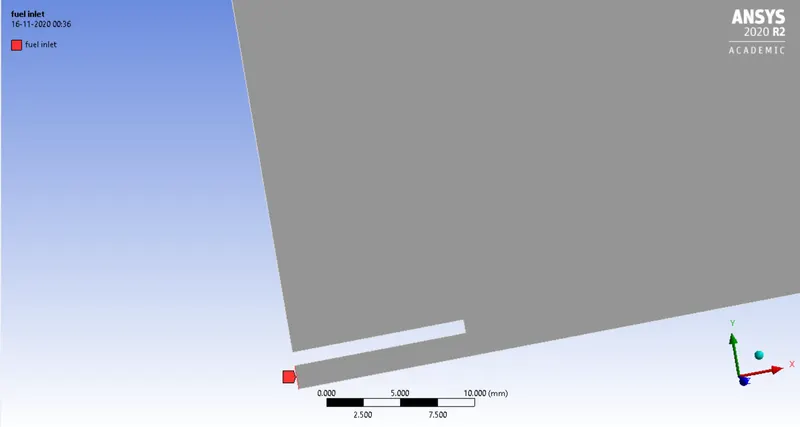
- create named selection for inlet , fuel inlet, axis, wall and outlet
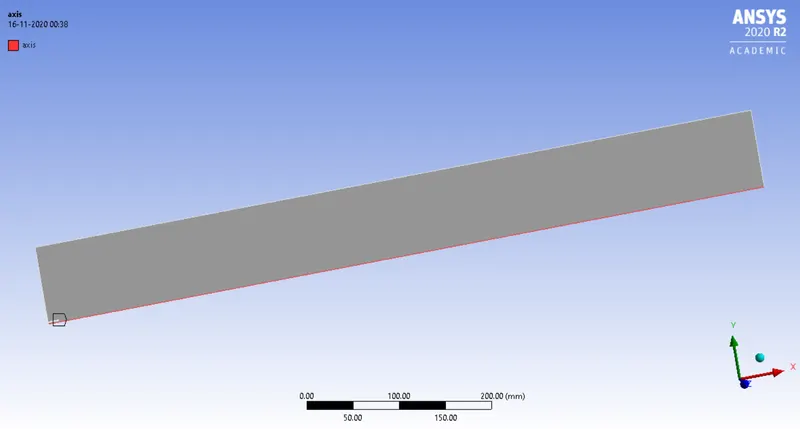
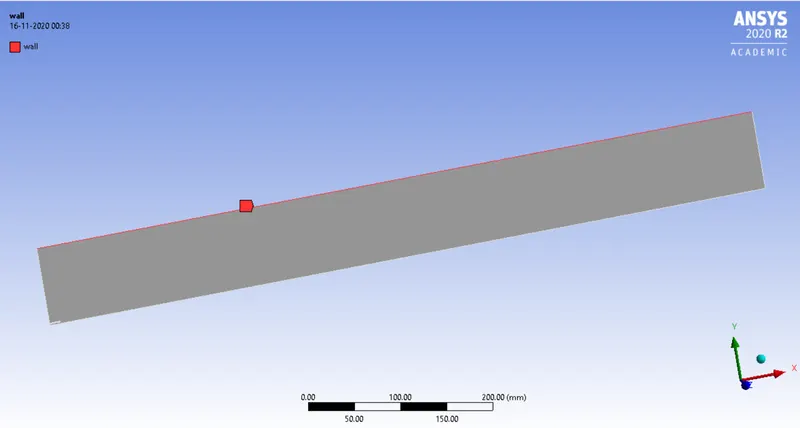
- update the mesh settings.
Pre-processing physics setup:
- Open the fluent console.
- Use pressure-based solver>> choose axisymmetric domain>> steady state solver.
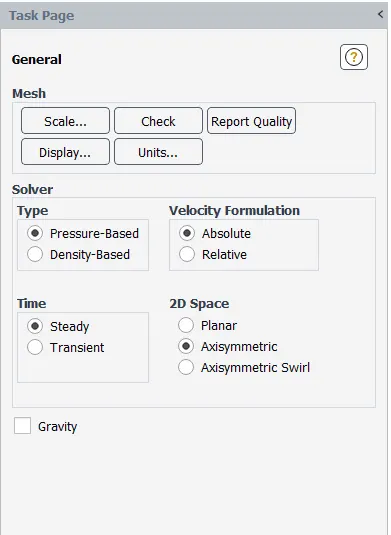
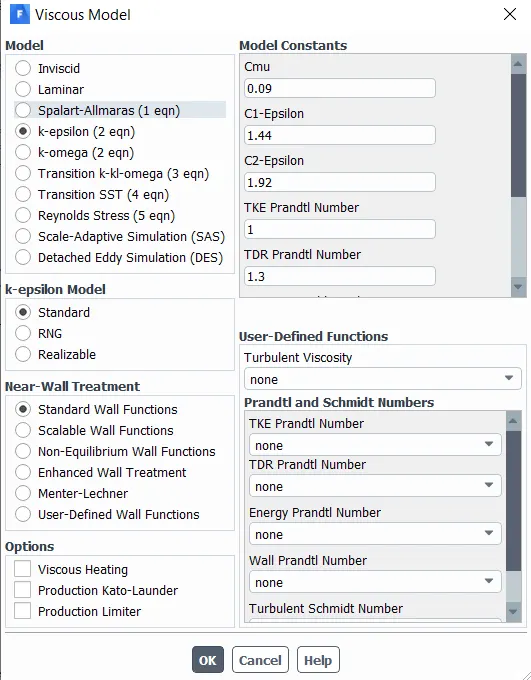
- Turn on the energy tab>> from viscous model choose k-epsilon model.
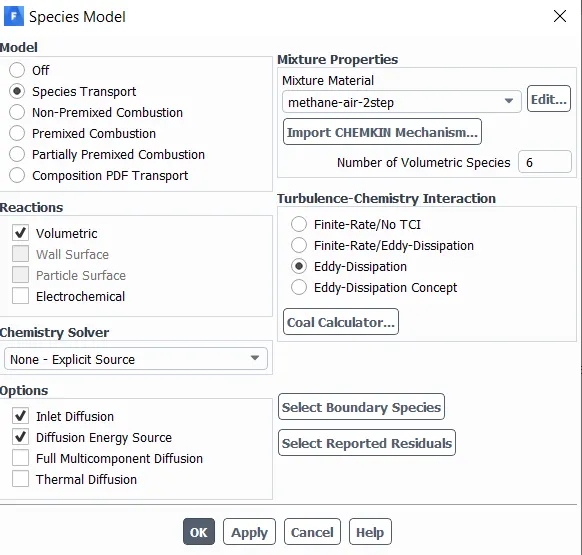
- Activate species>> select transport species>> select volumetric reaction with inlet diffusion and diffusion energy source term>> choose mixture properties as methane-air 2 step>> choose turbulence chemistry interaction as eddy dissipation model.
- From physics tab we enable the nox model by activating the thermal and prompt nox section>> for fuel type select ch4
- For soot model check for one step approach>> select fuel as ch4 and oxidant as o2
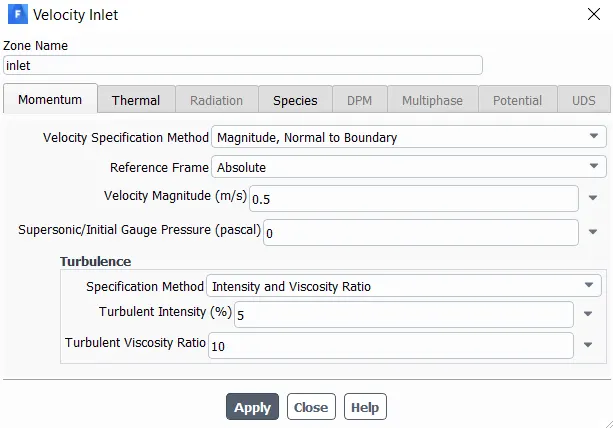
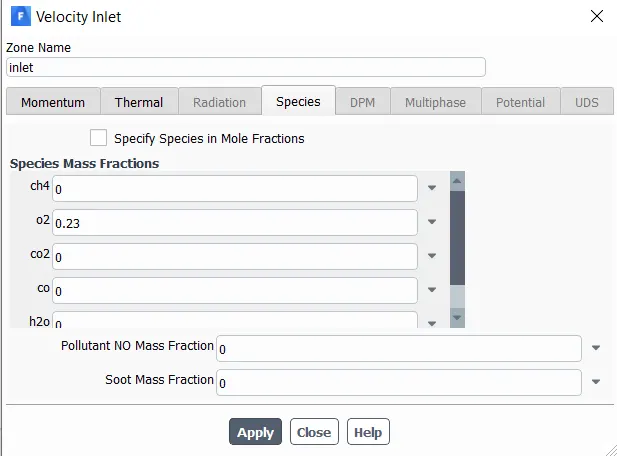
- now we apply boundary condition to the air inlet>> choose velocity as 0.5m/s and species as O2 with mass fraction of 0.23
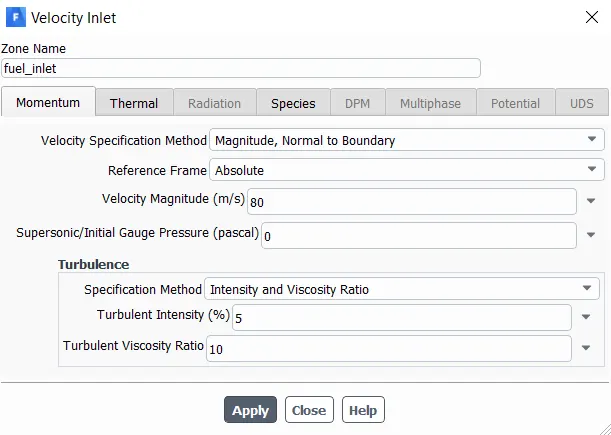
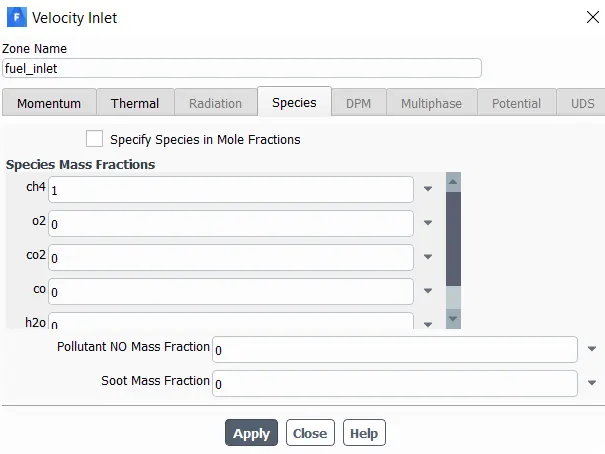
- with boundary condition of fuel inlet>> choose velocity as 80m/s>> species as ch4 with required mole fraction
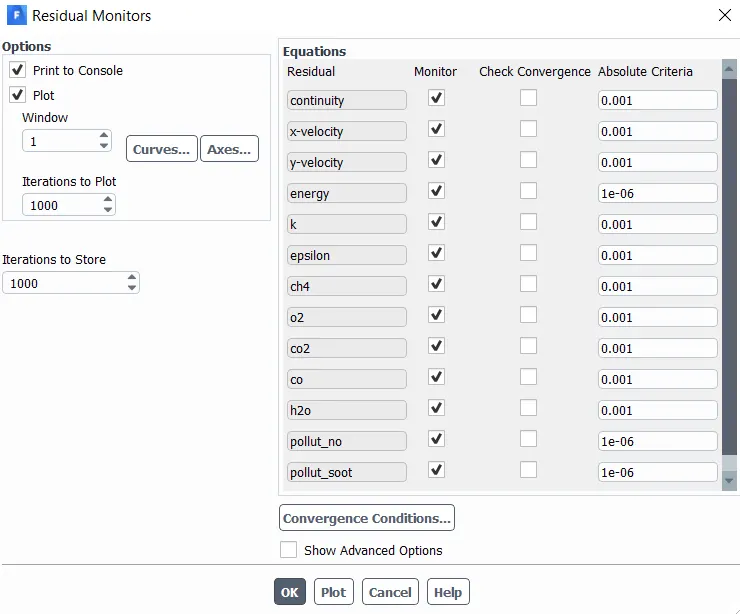
- For convergency uncheck all the convergent criteria.
- Hybrid initialization is done
- A contour plot from result tab is created to map the thermal distribution along the combustion chamber
- With a fixed no of iteration of 800 steps, the solver is run.
Post processing details:
Part 1:Perform a combustion simulation on the combustor model and plot the variation of the mass fraction of the different species’ in the simulation using line probes at different locations of the combustor as shown in Fig. You need to plot for CO2, H2O, CH4, N2, O2, NOx emissions & Soot formation.
Conventional case
Convergence of iteration
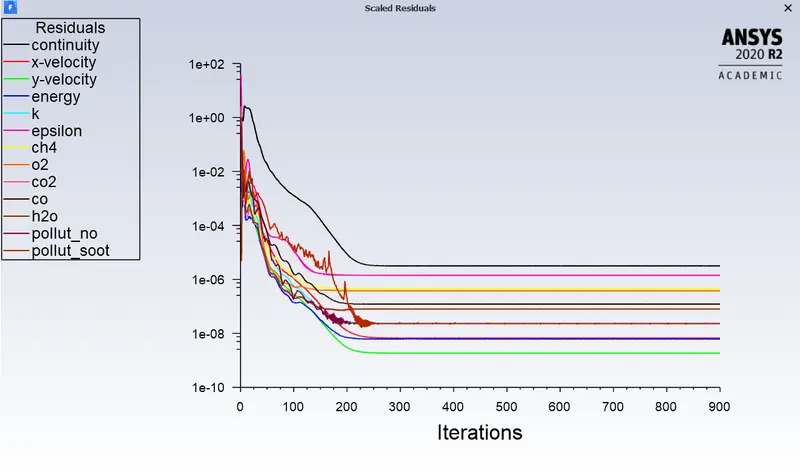
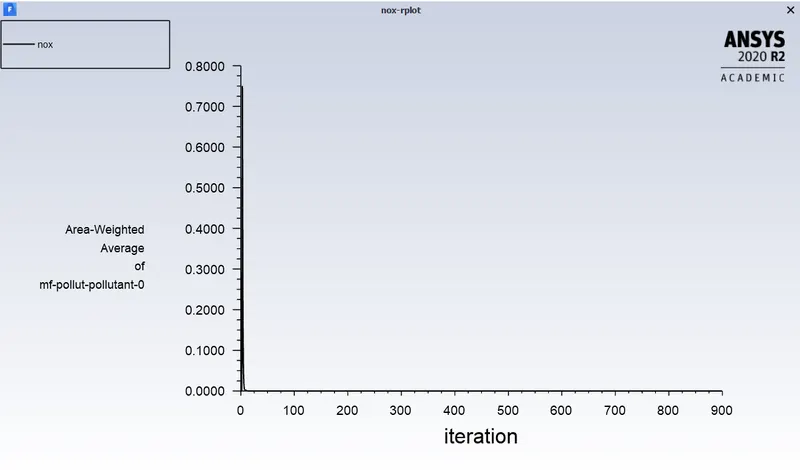
NOX emission plot
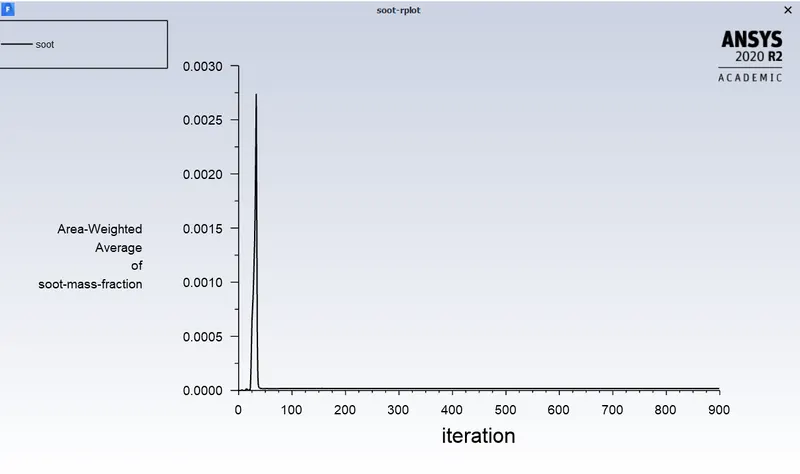
Soot emission plot
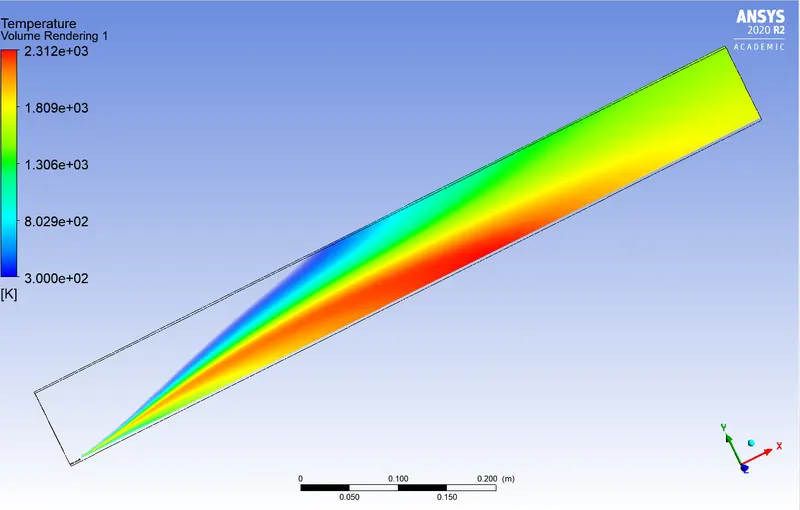
Temperature distribution in volumetric domain
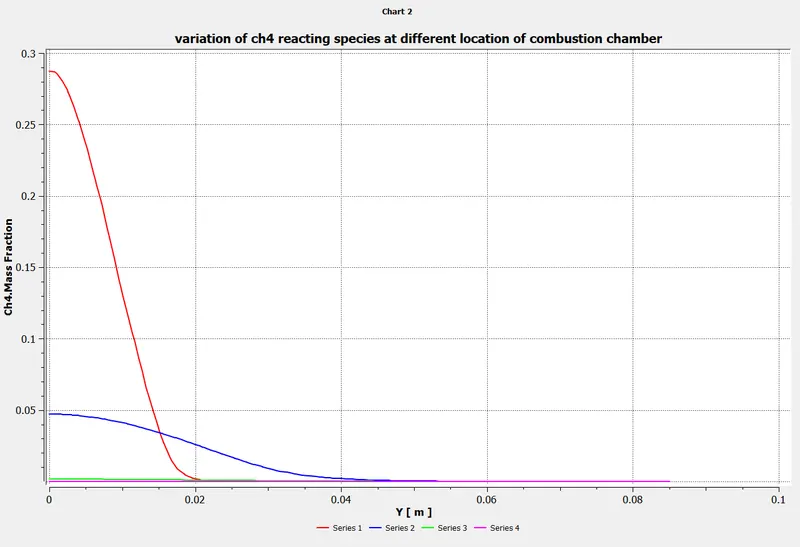
Line plot distribution at different section
Mass fraction of CH4 reacting species
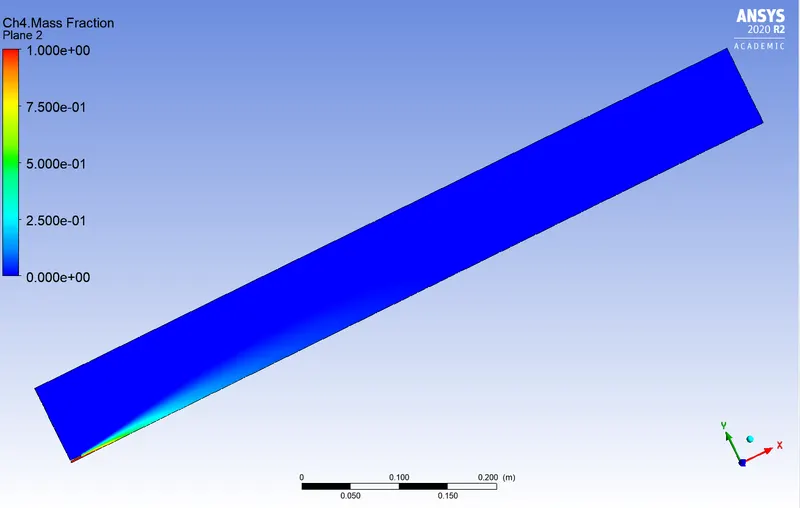
Graphical variation of CH4 at different location of combustion chamber
Mass fraction of CO2 reacting species
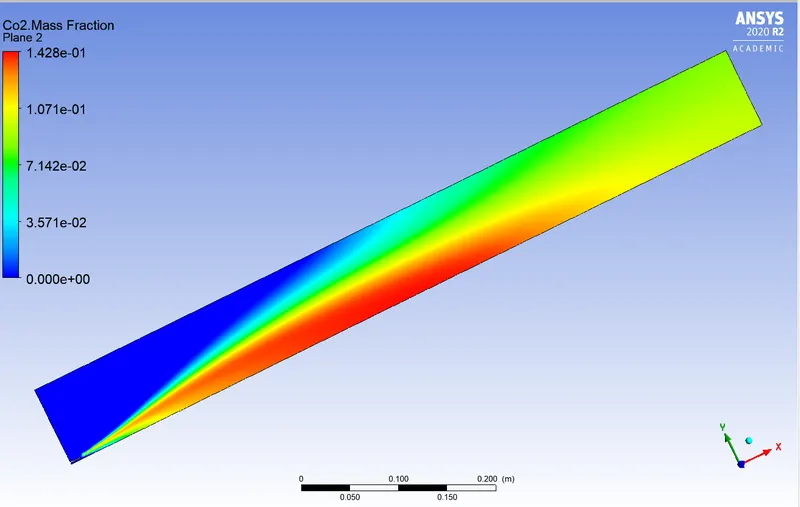
Graphical variation of CO2at different location of combustion chamber
Mass fraction of H2O reacting species
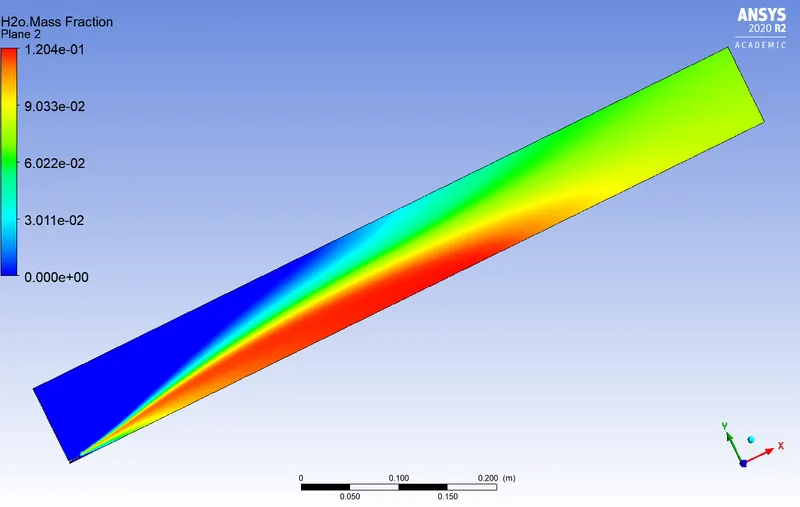
Graphical variation of H2O at different location of combustion chamber
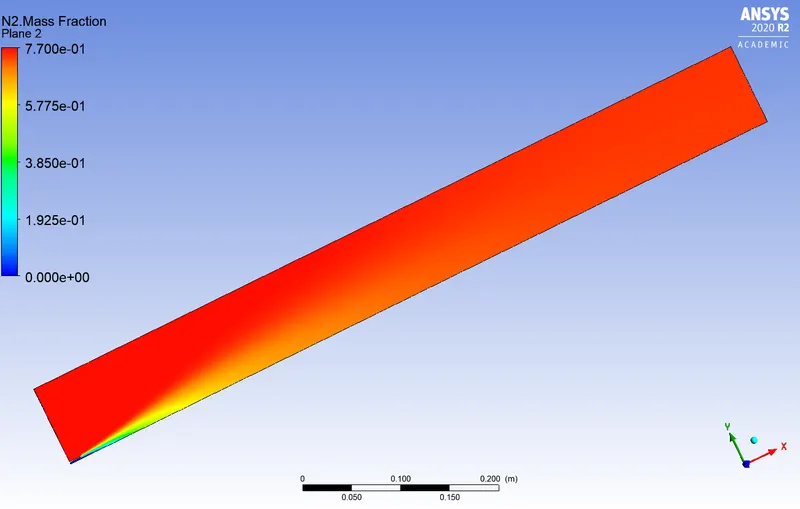
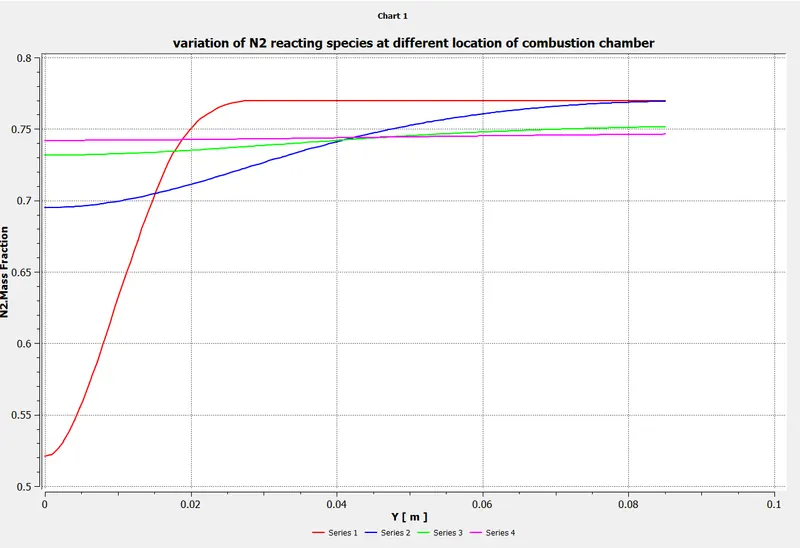
Mass fraction of N2 reacting species
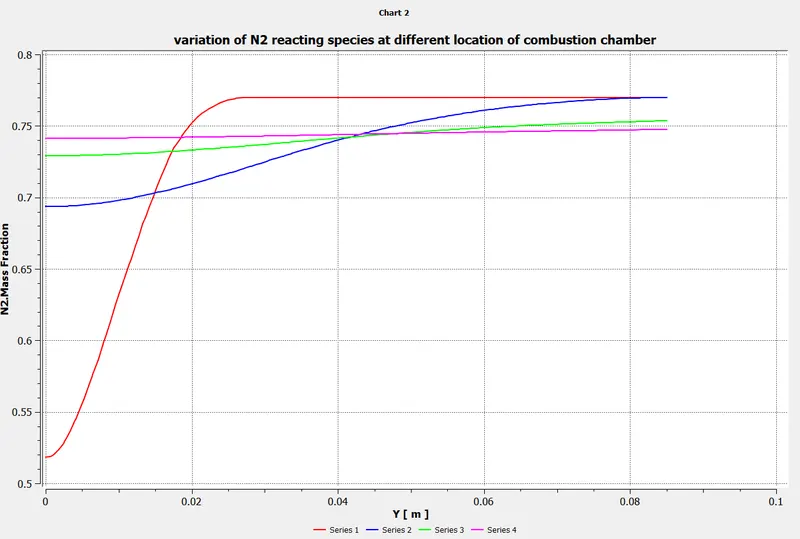
Graphical variation of N2 at different location of combustion chamber
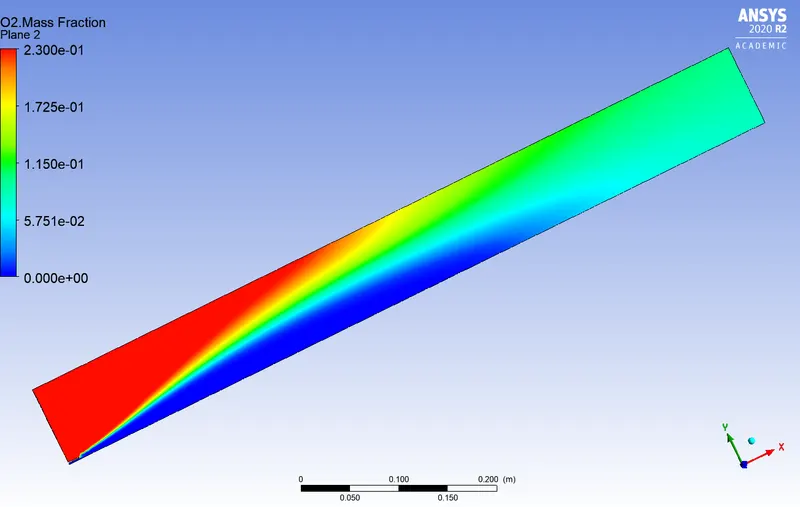
Mass fraction of O2 reacting species
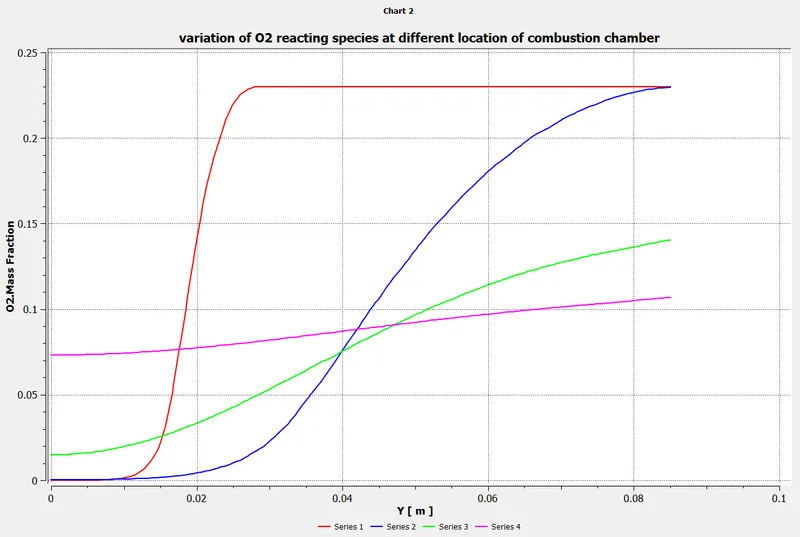
Graphical variation of O2at different location of combustion chamber
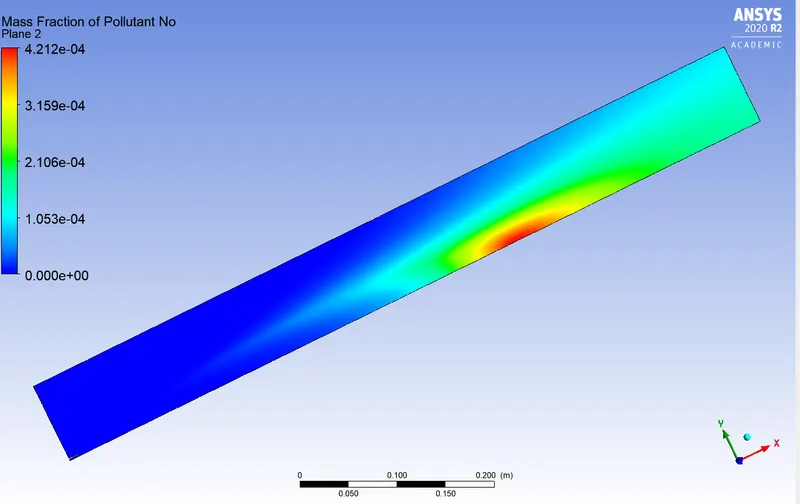
Mass fraction of NOX pollutant
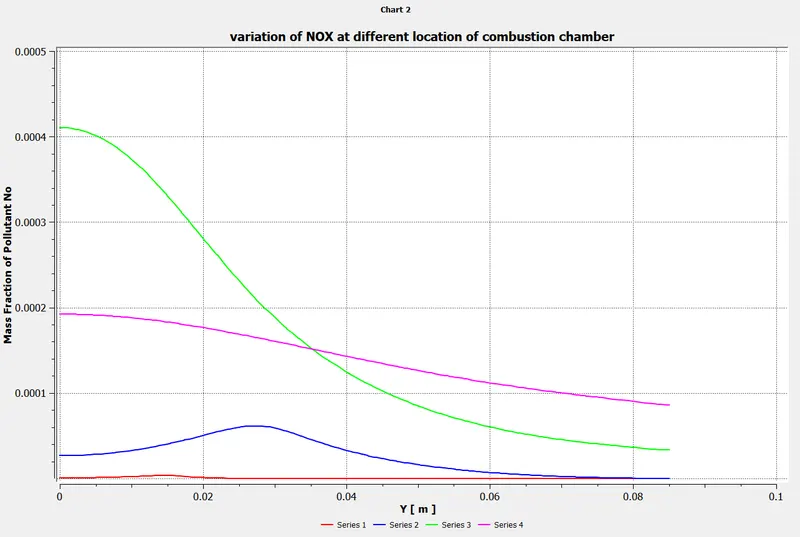
Graphical variation of NOX at different location of combustion chamber
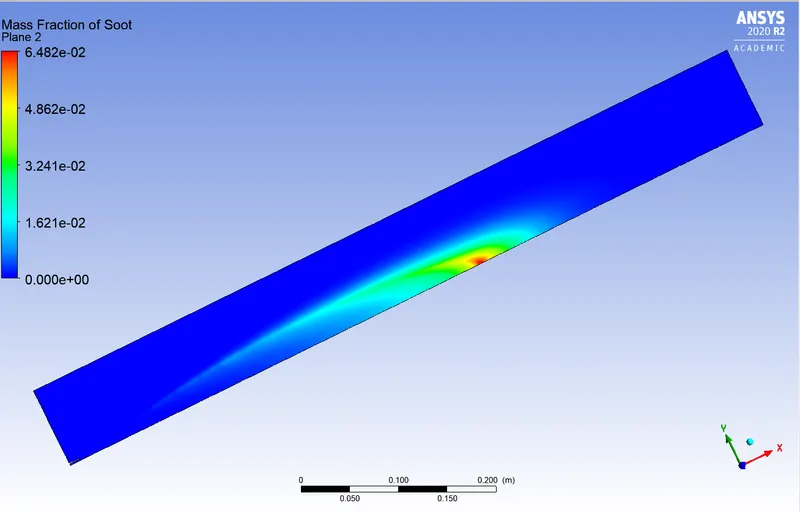
Mass fraction of soot
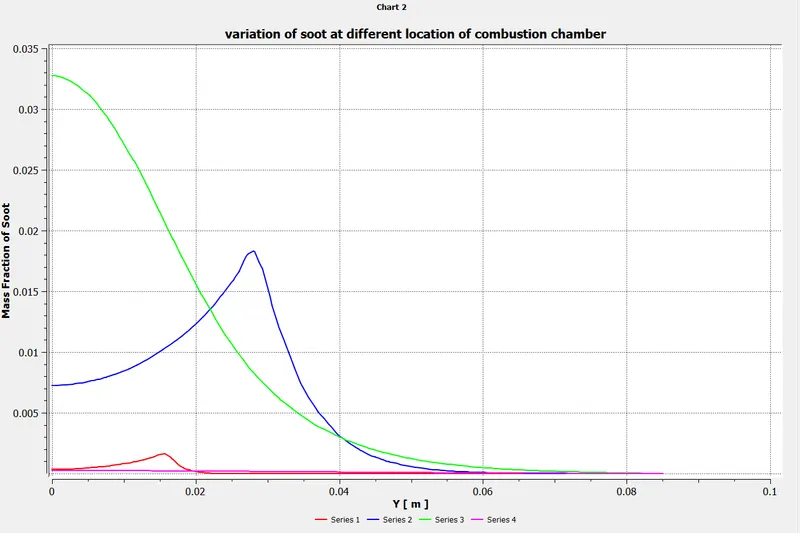
Graphical variation of soot at different location of combustion chamber
Part 2:
As you must have observed from the above simulation, the Nox and soot is getting formed at the outlet of the combustor. Such formation has harmful effects on the environment and humans. The stringent government norms also demand the least formation of Nox and soot and to satisfy those requirements, you need to check the effect of adding the water in the fuel.
In this part, you need to add the water content in the fuel from 5% to 30% by mole and observe the effect of it on the results. It is necessary to provide line plots and contours to prove your claim.
Percentage of water addition to fuel- 5%
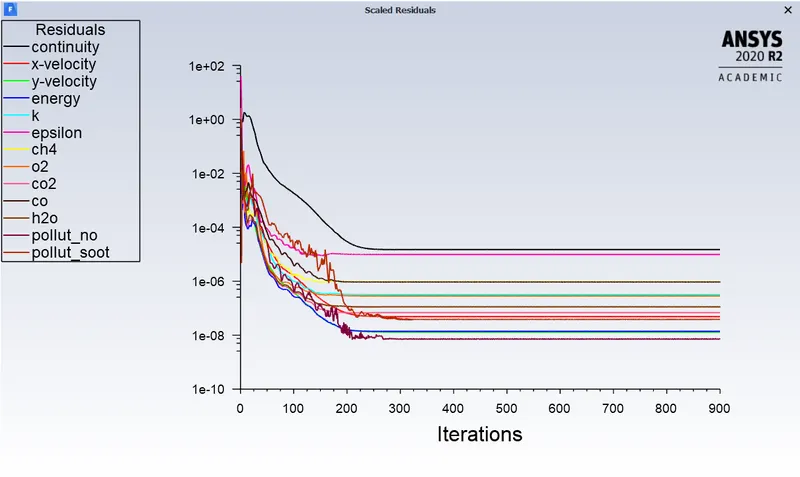
Convergence of iteration
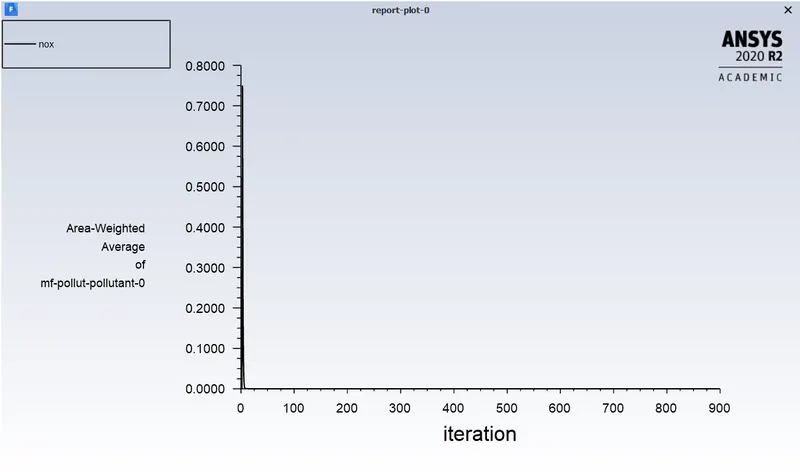
NOX emission plot
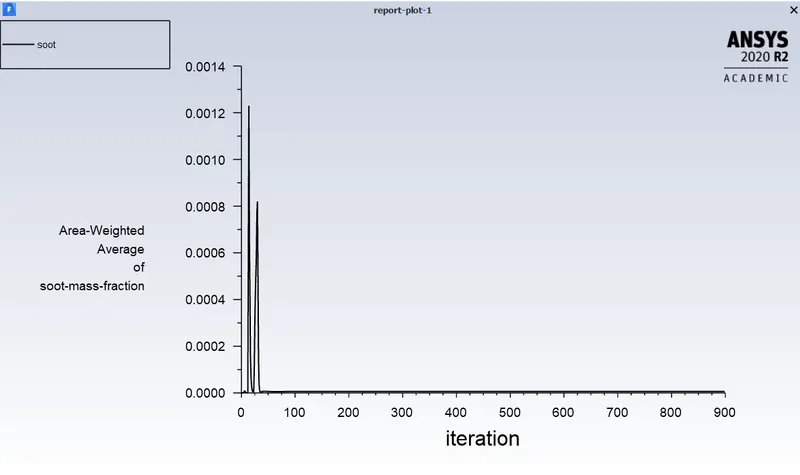
Soot emission plot
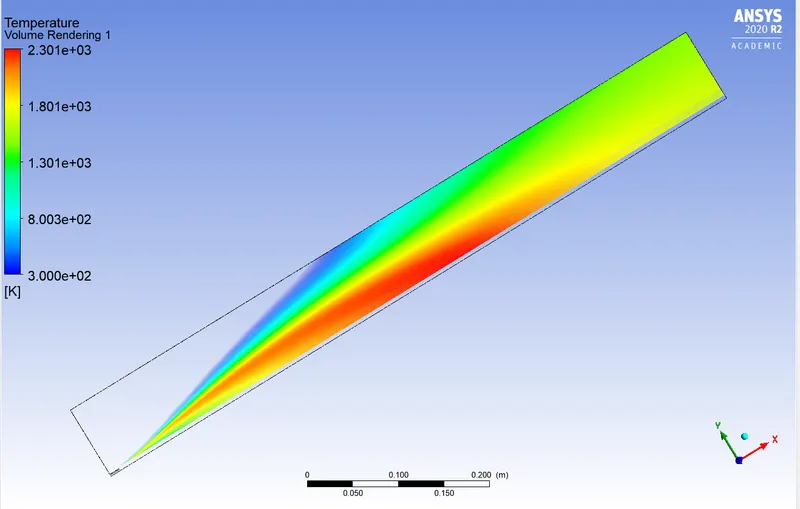
Temperature distribution in volumetric domain
Mass fraction of CH4 reacting species
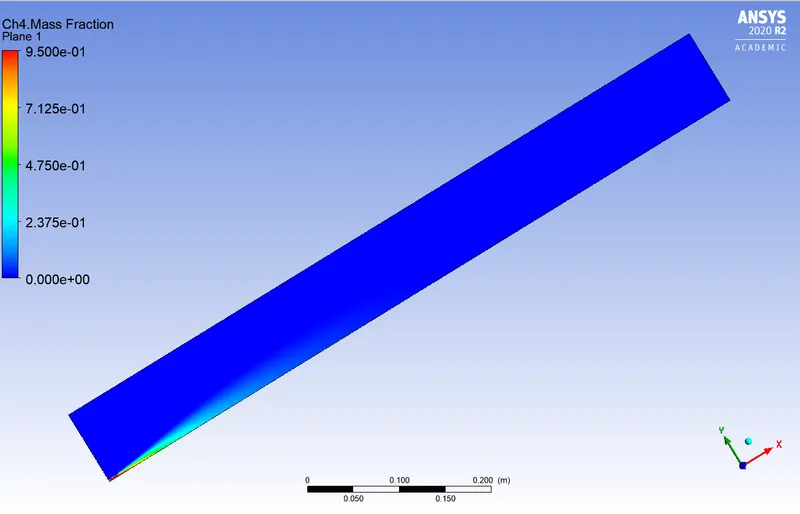
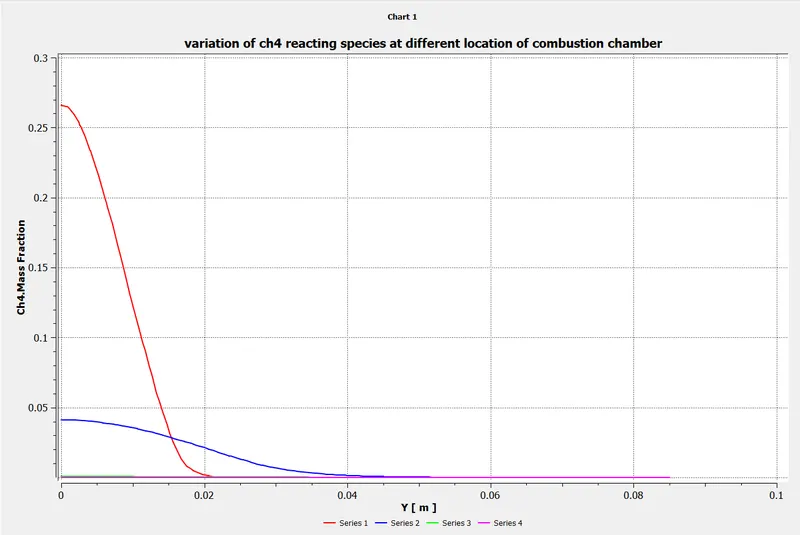
Graphical variation of CH4 at different location of combustion chamber
Mass fraction of CO2 reacting species
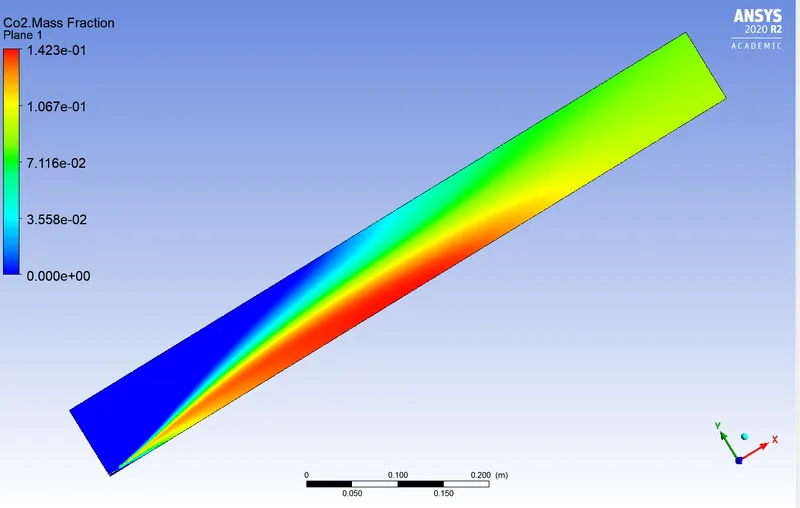
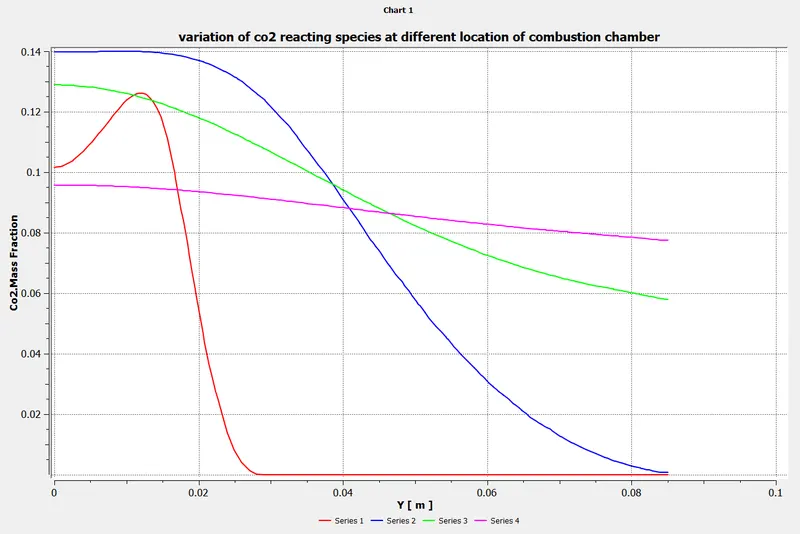
Graphical variation of CO2at different location of combustion chamber
Mass fraction of H2O reacting species
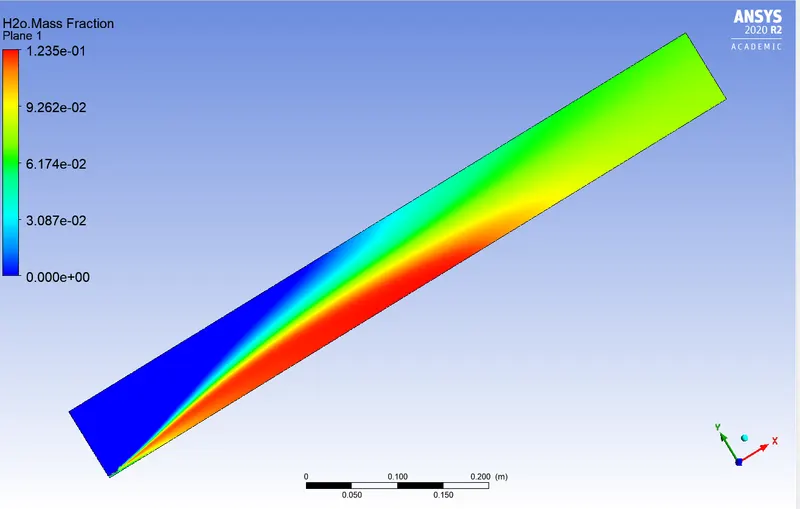
Graphical variation of H2O at different location of combustion chamber
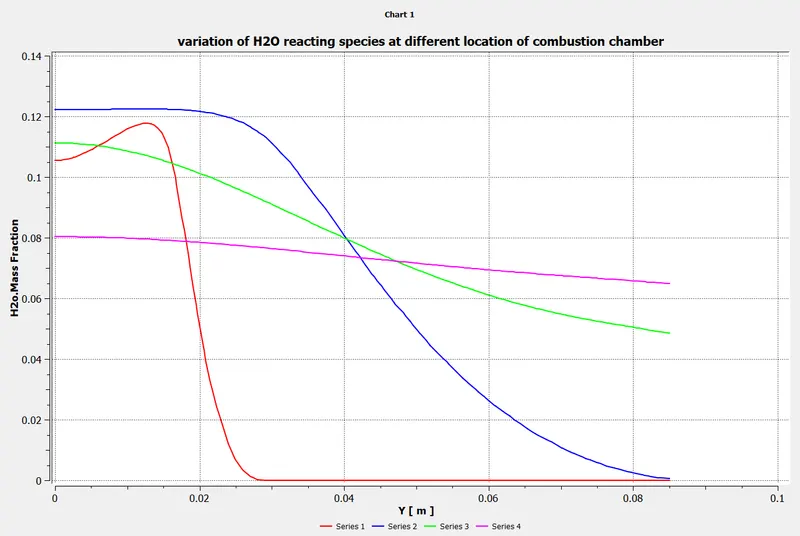
Mass fraction of N2 reacting species
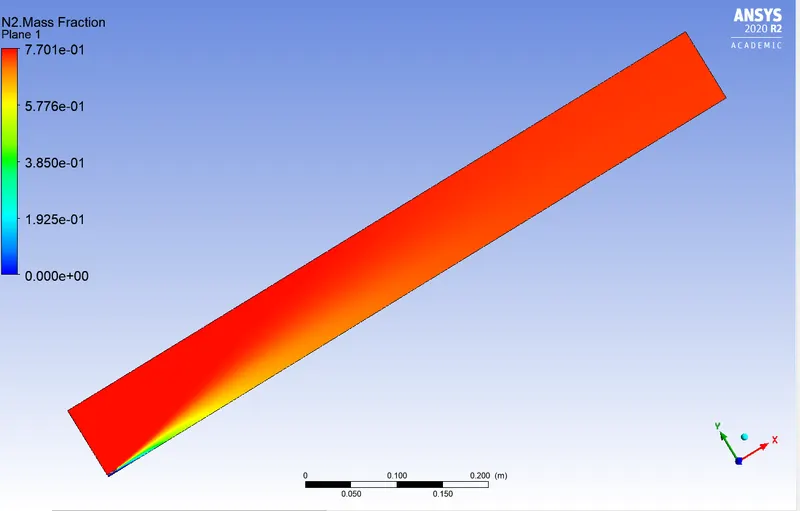
Graphical variation of N2 at different location of combustion chamber
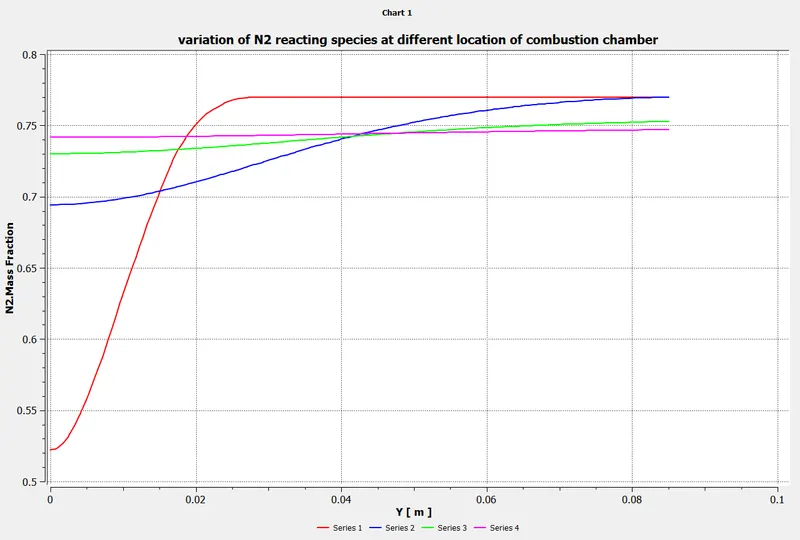
Mass fraction of O2 reacting species
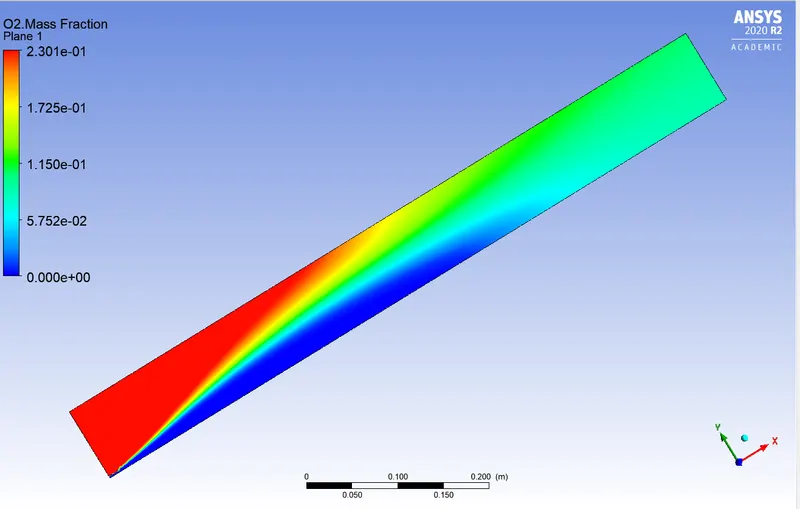
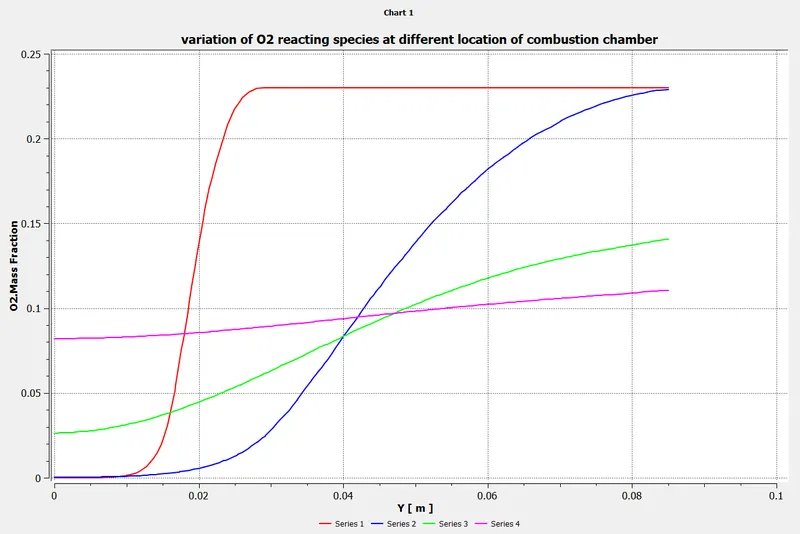
Graphical variation of O2 at different location of combustion chamber
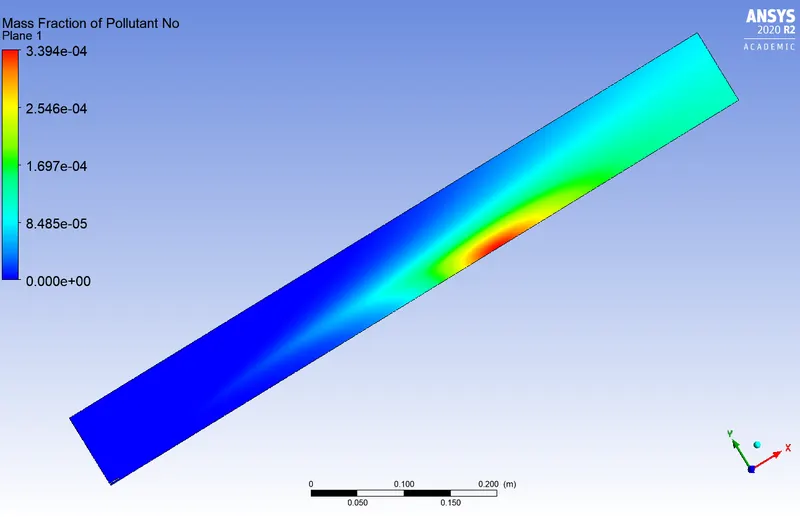
Mass fraction of NOX pollutant
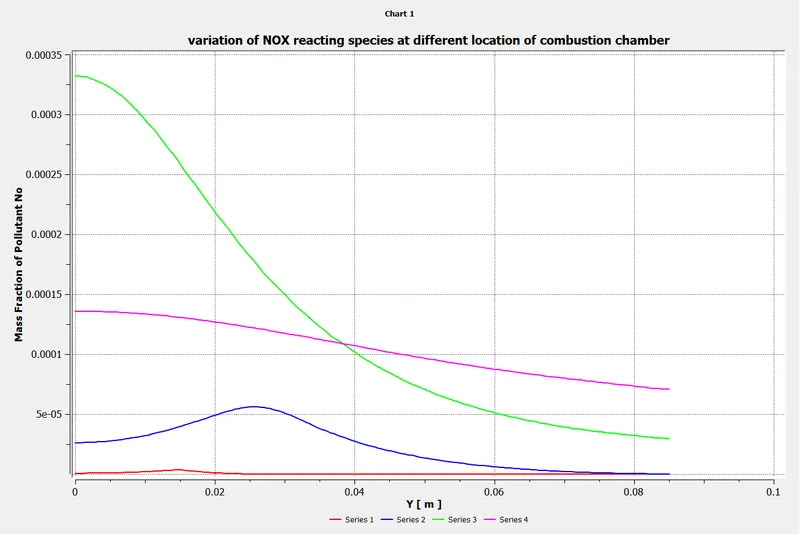
Graphical variation of NOX at different location of combustion chamber
Mass fraction of soot
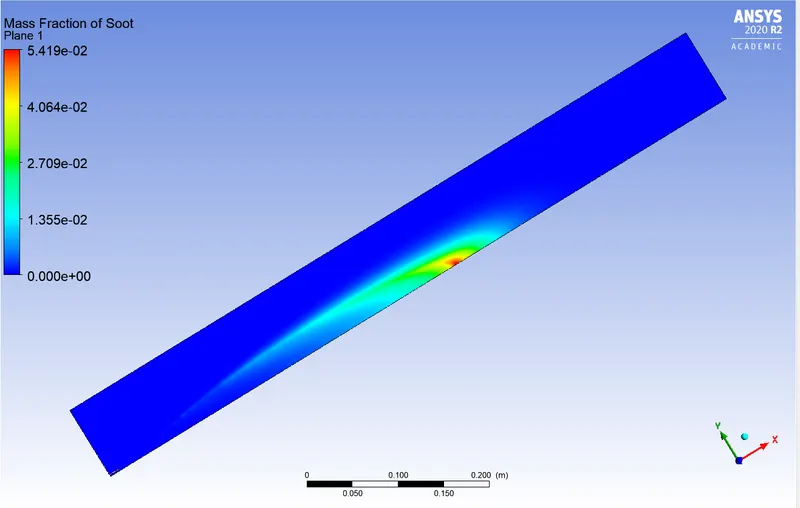
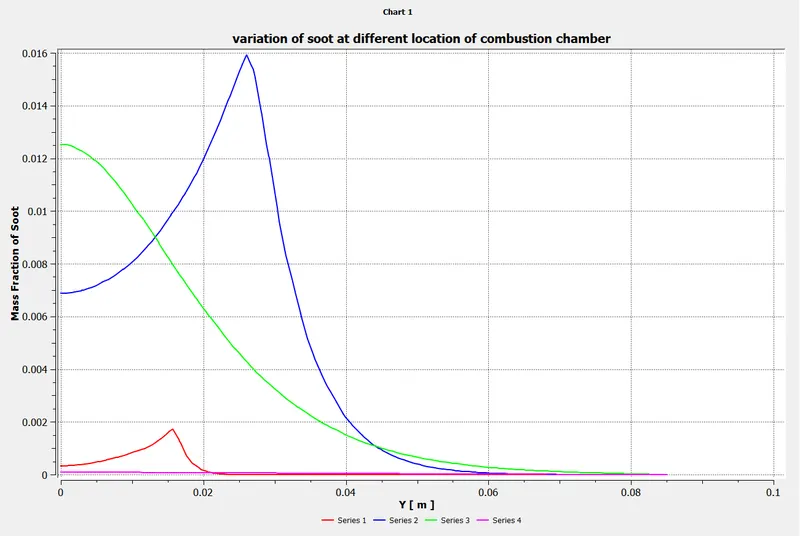
Graphical variation of soot at different location of combustion chamber
Case 2:
Percentage of water addition to fuel- 15%
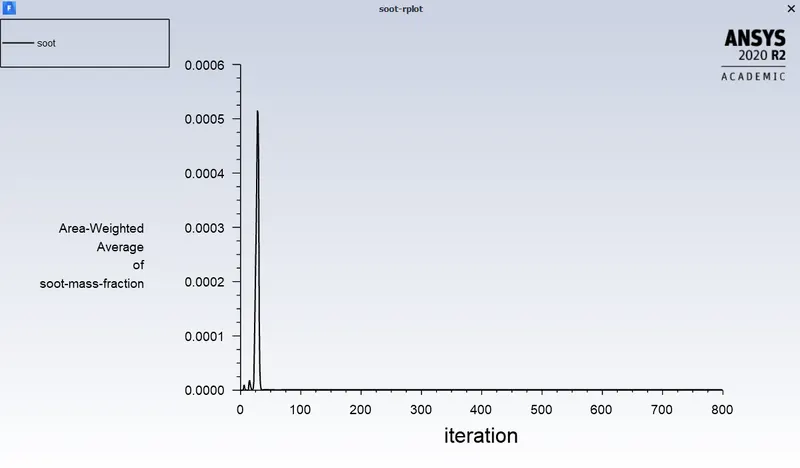
Convergence of iteration
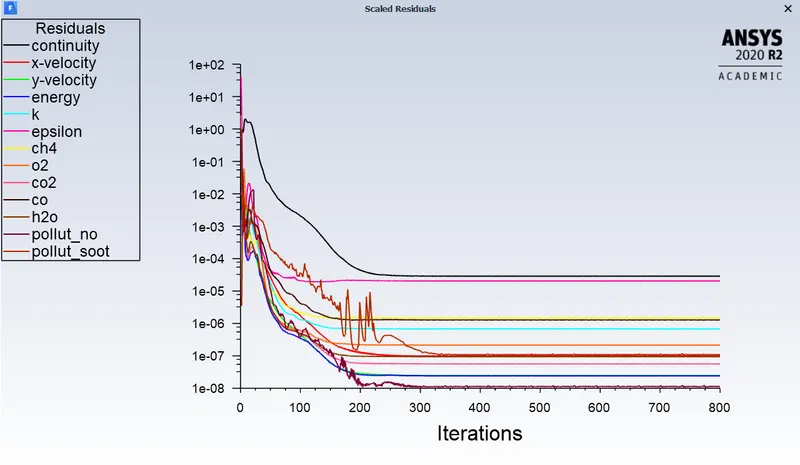
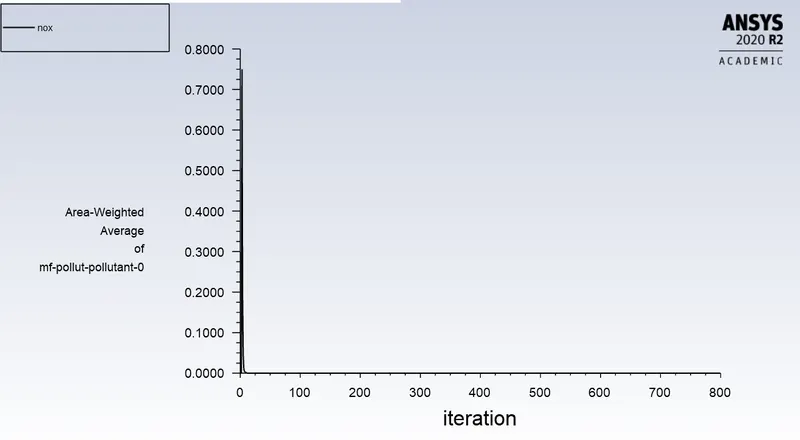
NOX emission plot
Soot emission plot
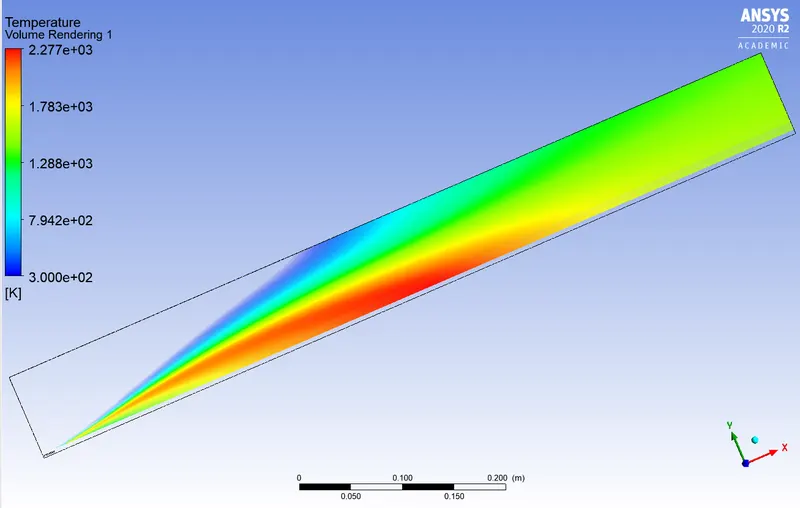
Temperature distribution in volumetric domain
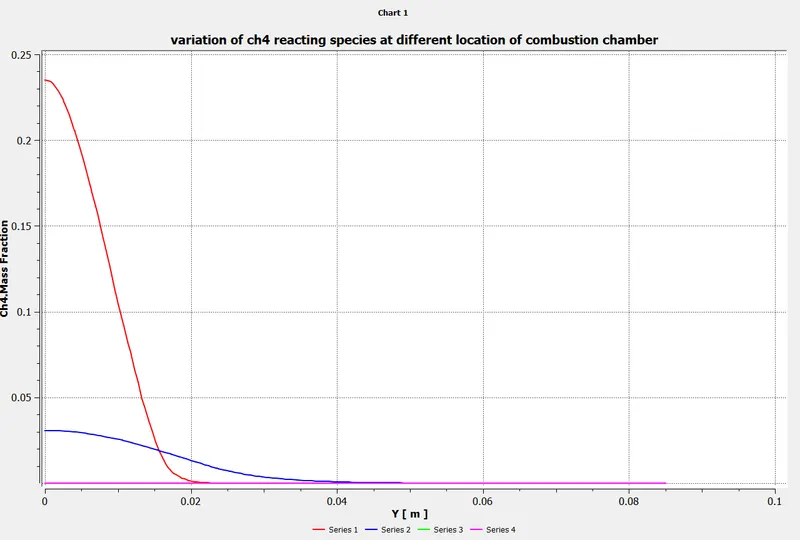
Mass fraction of CH4 reacting species
Graphical variation of CH4 at different location of combustion chamber
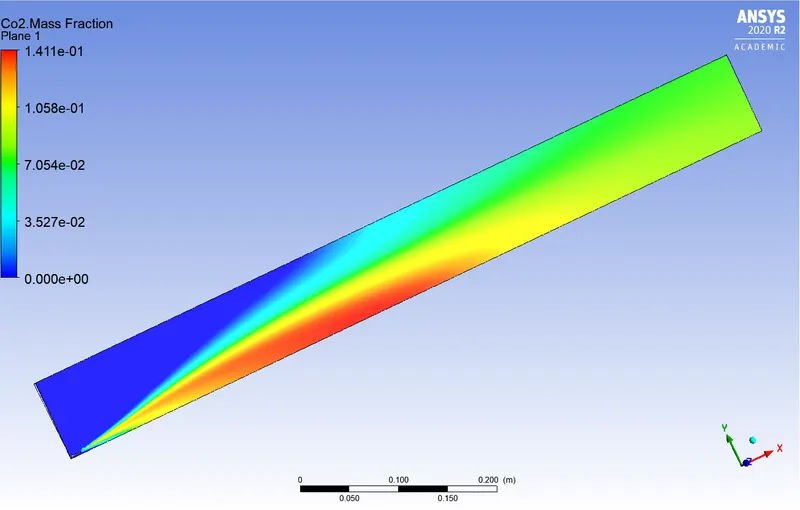
Mass fraction of CO2 reacting species
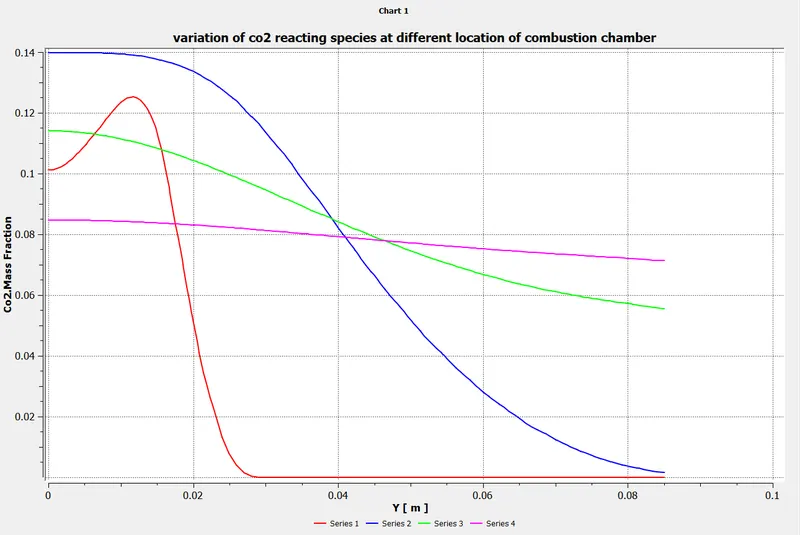
Graphical variation of CO2at different location of combustion chamber
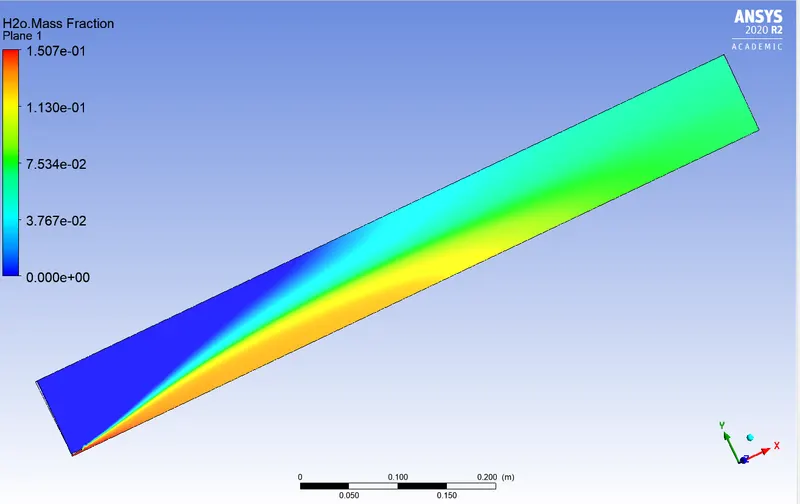
Mass fraction of H2O reacting species
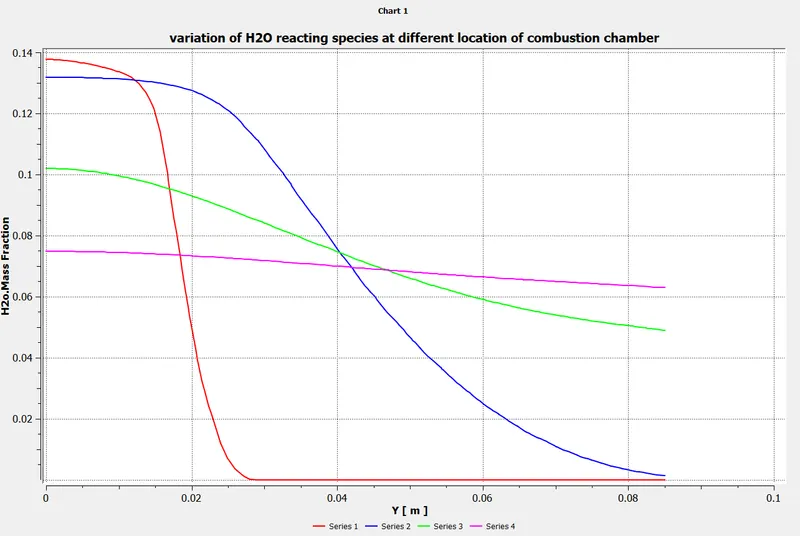
Graphical variation of H2O at different location of combustion chamber
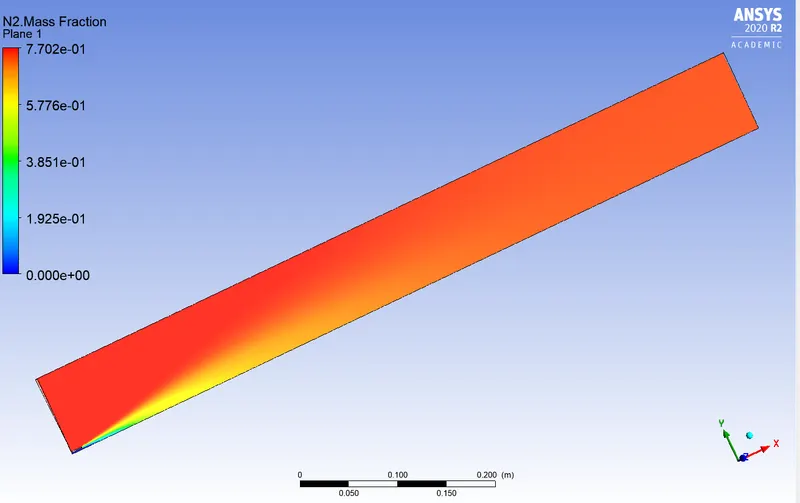
Mass fraction of N2 reacting species
Graphical variation of N2 at different location of combustion chamber
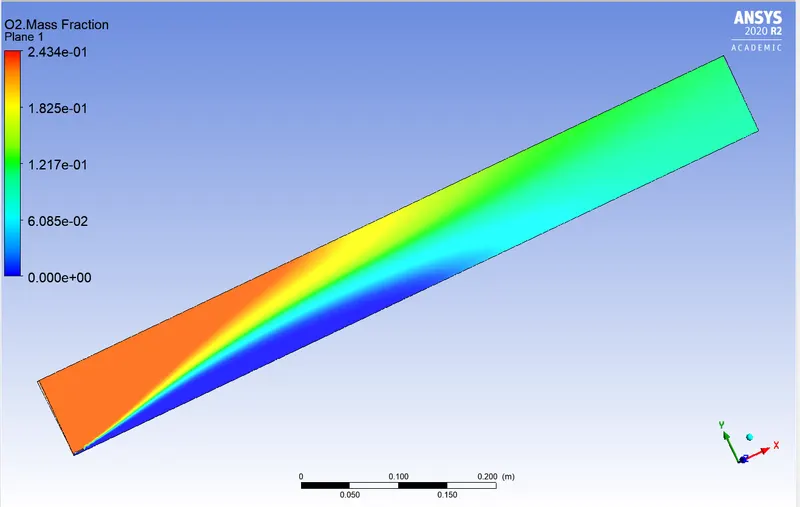
Mass fraction of O2 reacting species
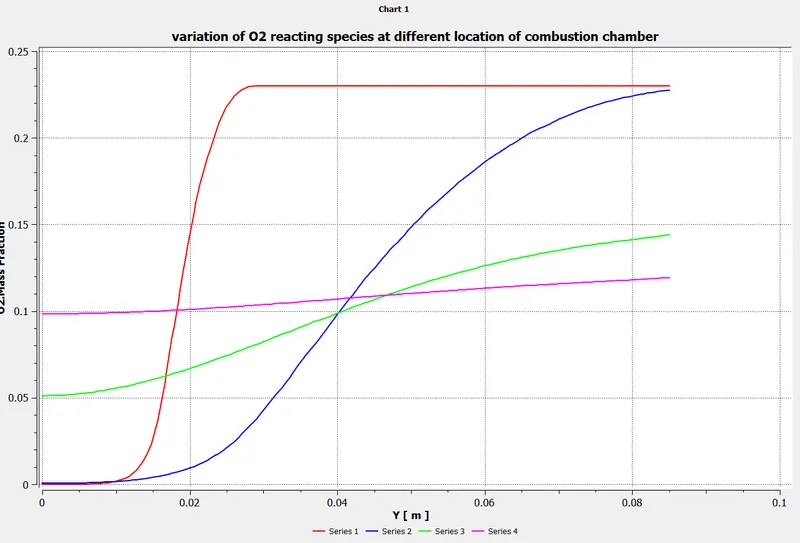
Graphical variation of O2at different location of combustion chamber
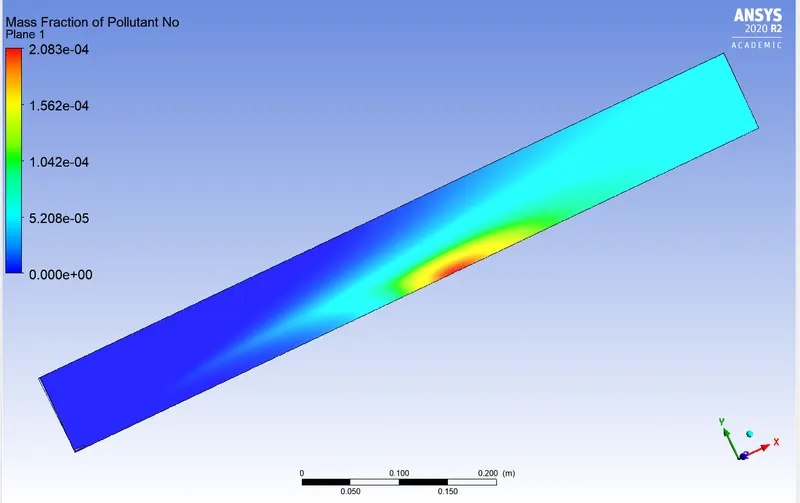
Mass fraction of NOX pollutant
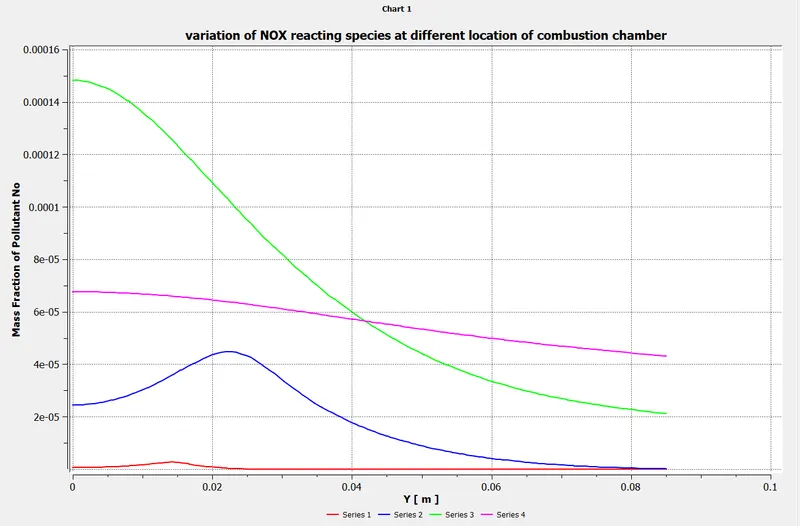
Graphical variation of NOX at different location of combustion chamber
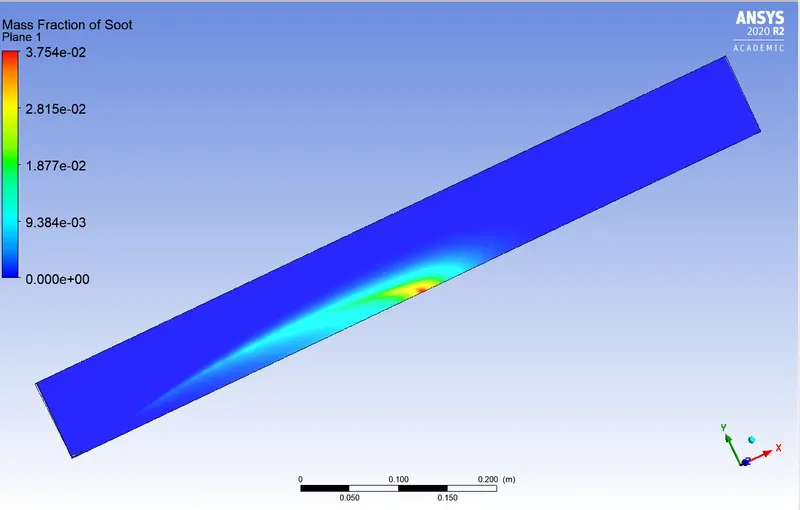
Mass fraction of soot
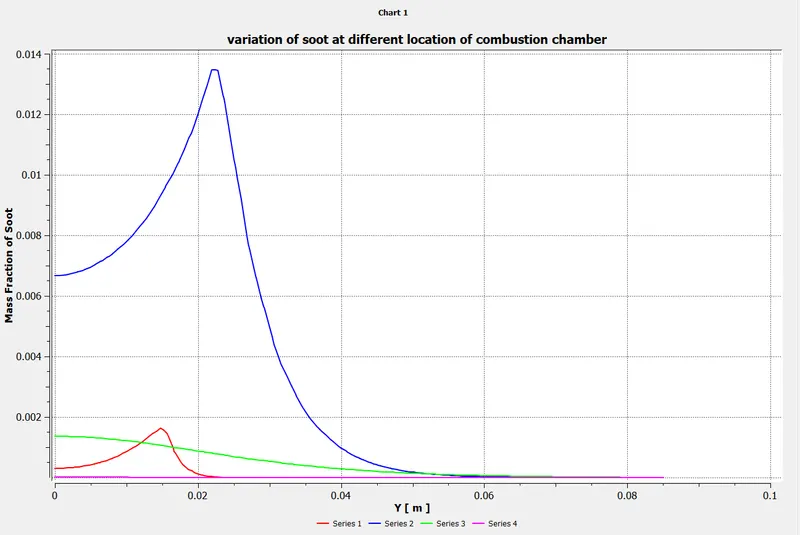
Graphical variation of soot at different location of combustion chamber
Case 3:
Percentage of water addition to fuel- 30%
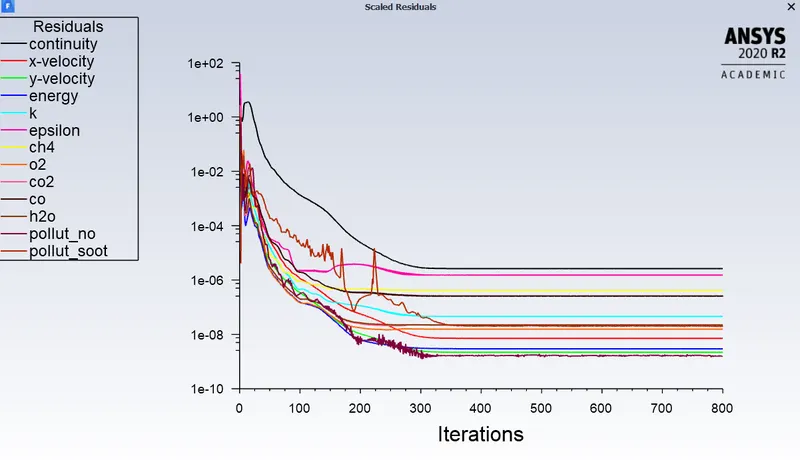
Convergence of iteration
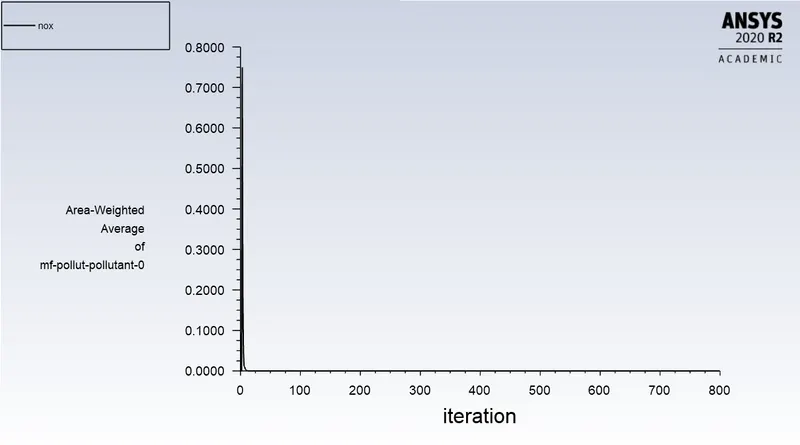
NOX emission plot
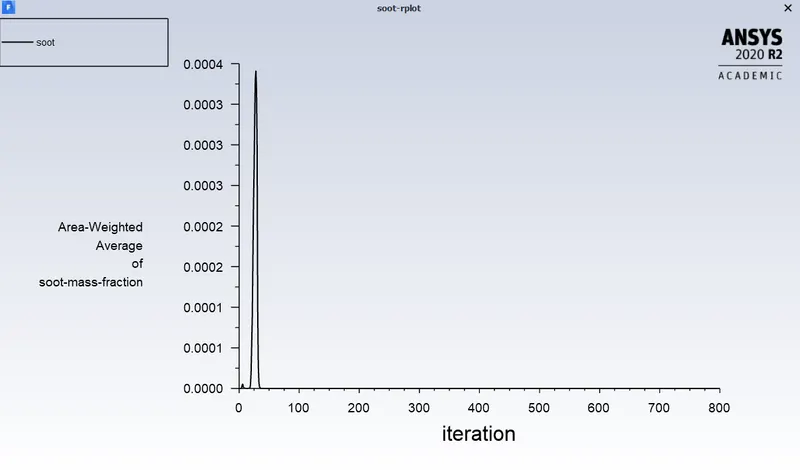
Soot emission plot
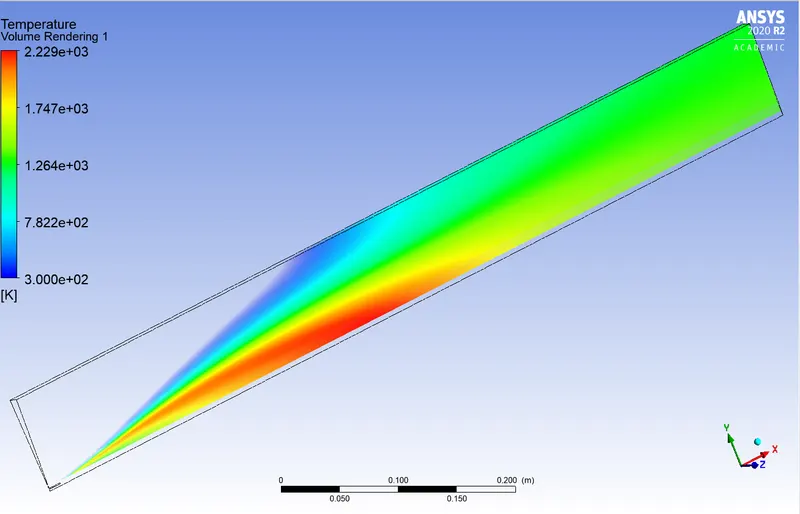
Temperature distribution in volumetric domain
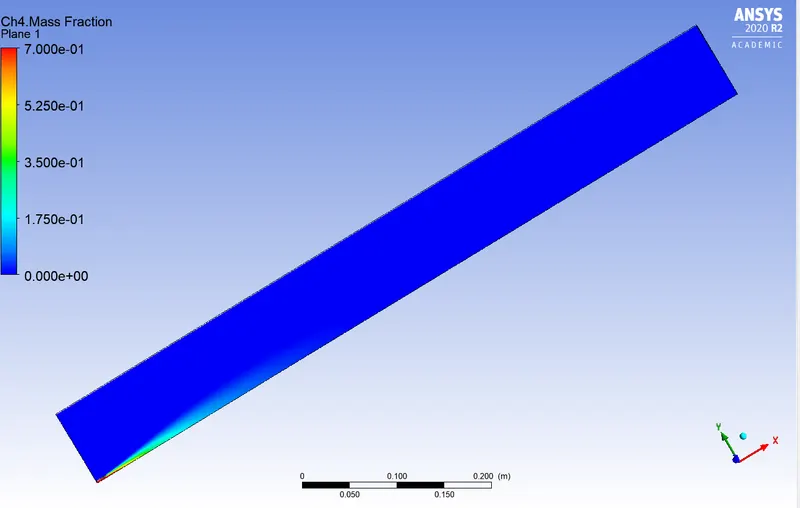
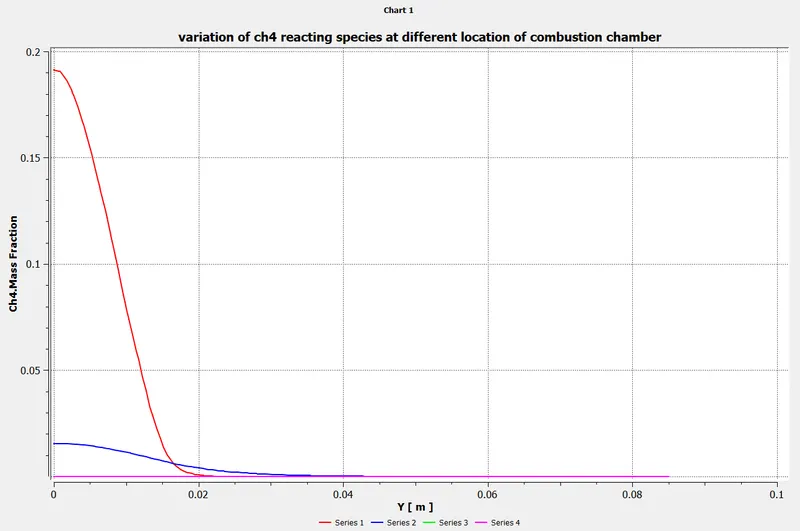
Mass fraction of CH4 reacting species
Graphical variation of CH4 at different location of combustion chamber
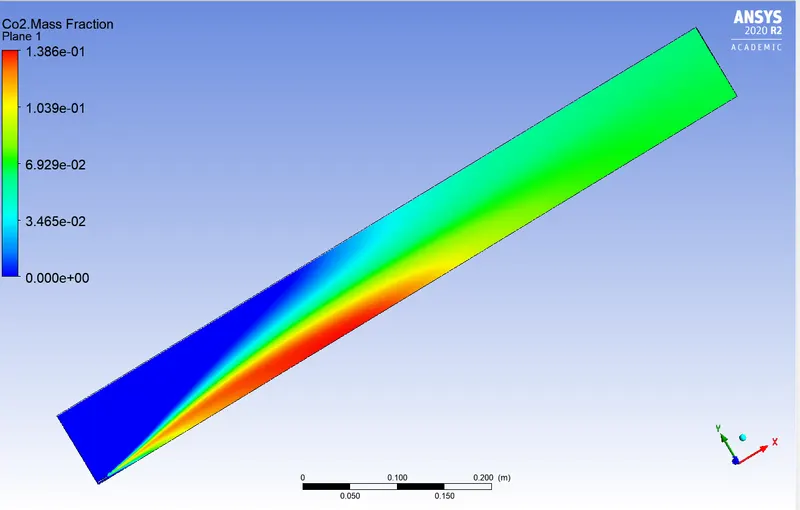
Mass fraction of CO2 reacting species
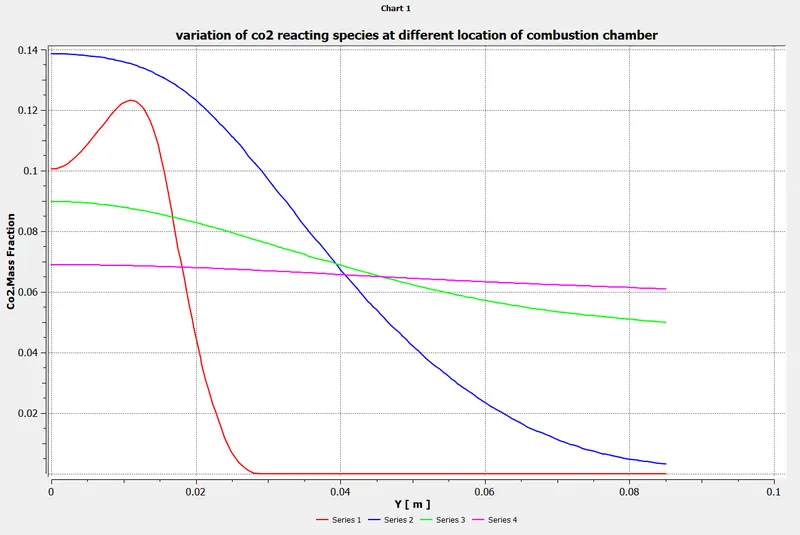
Graphical variation of CO2at different location of combustion chamber
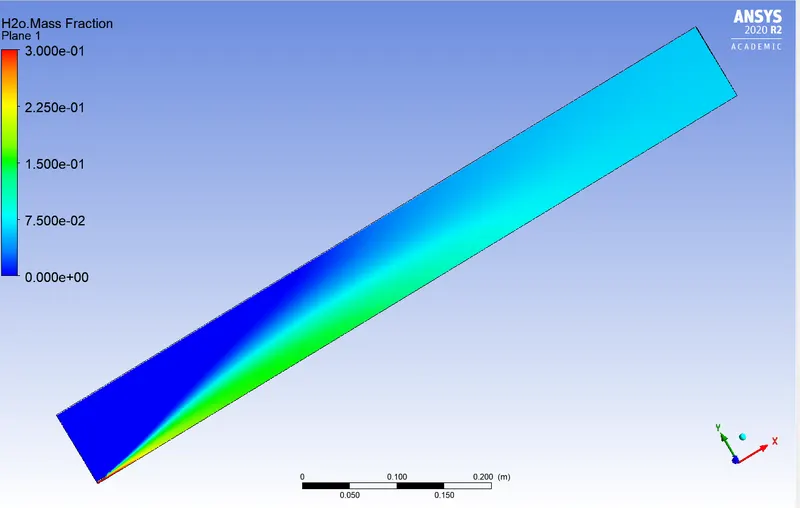
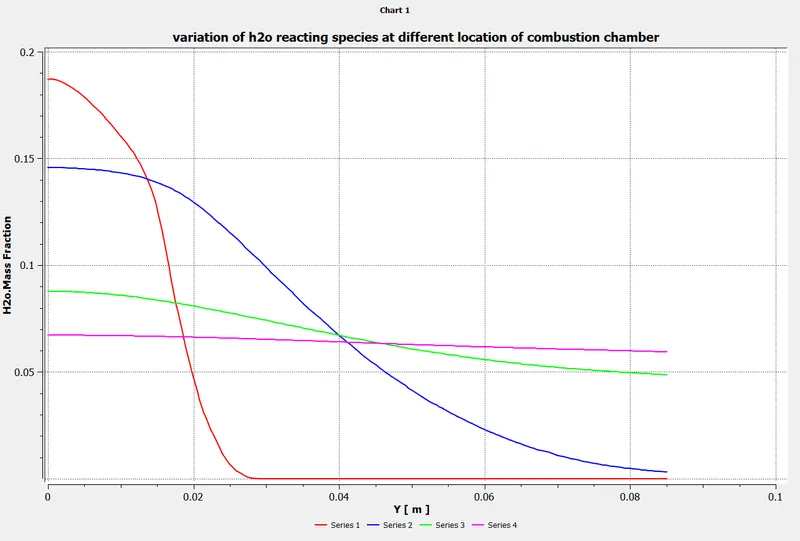
Mass fraction of H2O reacting species
Graphical variation of H2O at different location of combustion chamber
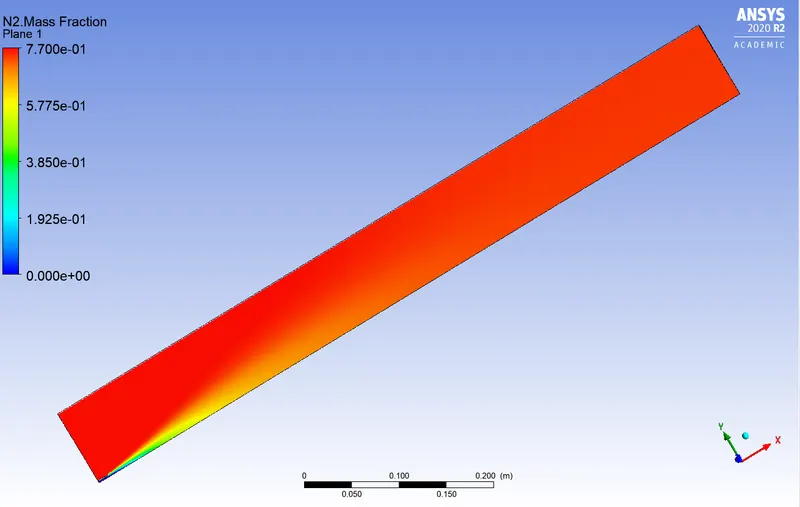
Mass fraction of N2 reacting species
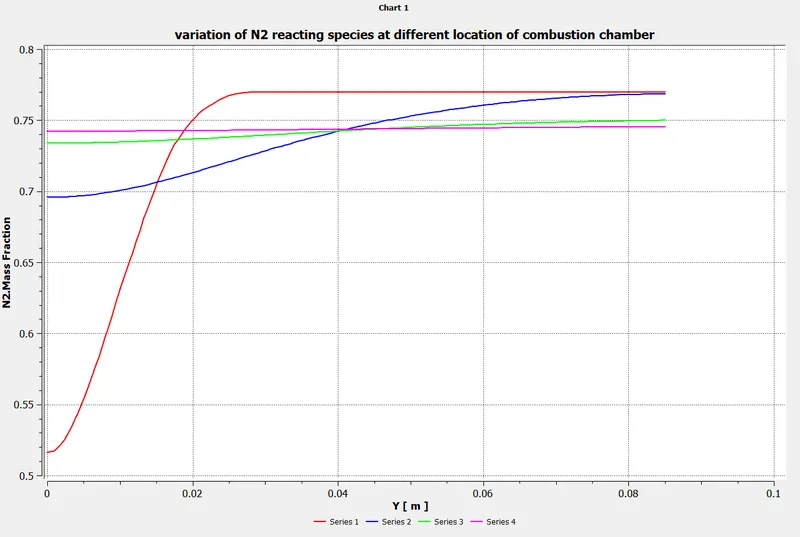
Graphical variation of N2 at different location of combustion chamber
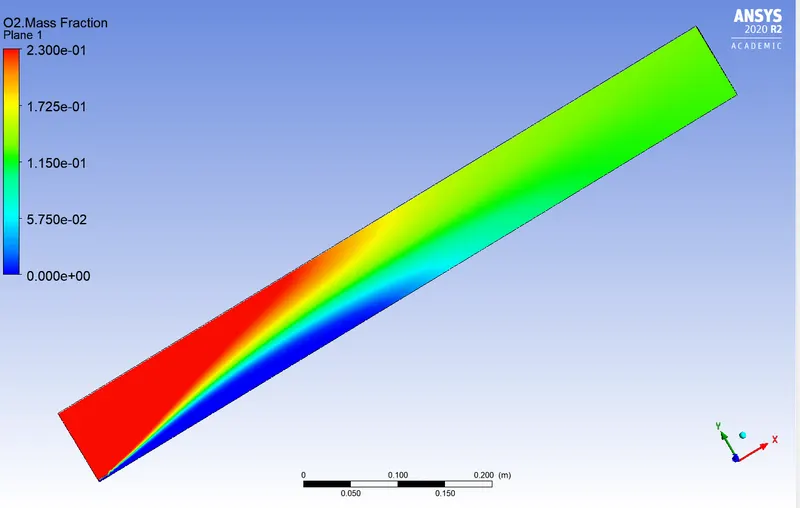
Mass fraction of O2 reacting species
Graphical variation of O2 at different location of combustion chamber
Mass fraction of NOX pollutant
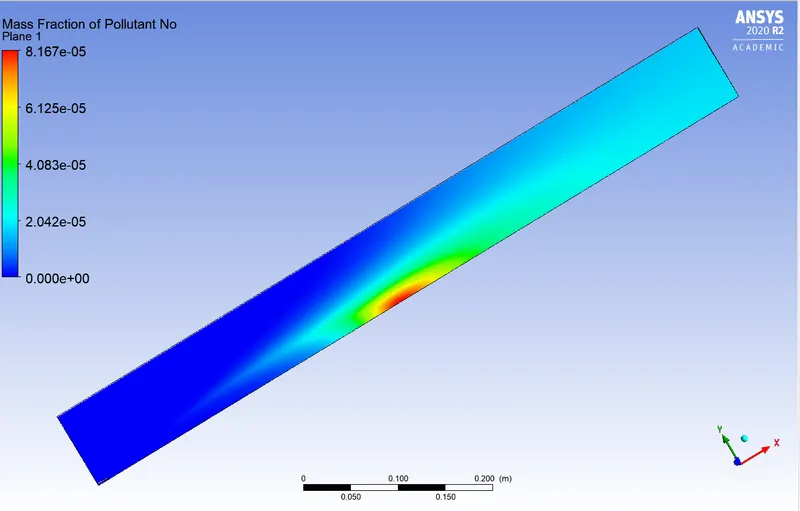
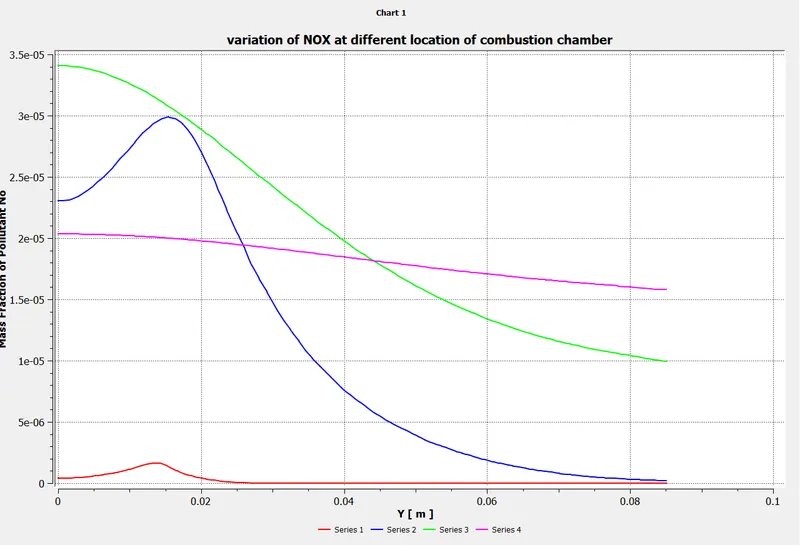
Graphical variation of NOX at different location of combustion chamber
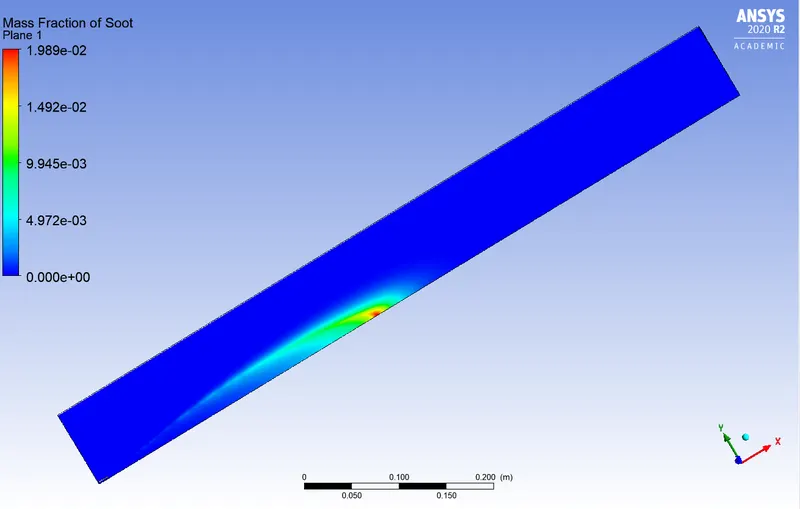
Mass fraction of soot
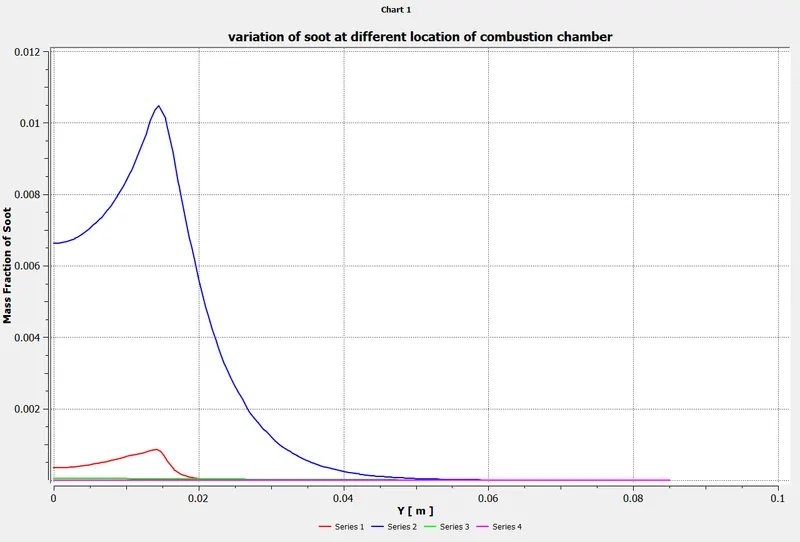
Graphical variation of soot at different location of combustion chamber
Comparison between conventional case and water added fuel case:
The table shows the comparison between various combustion products after analysis
|
Combustion product |
Conventional case |
Fuel+water-5% |
Fuel+water-15% |
Fuel+water-30% |
|
Temperature |
2.312e3 |
2.301e3 |
2.27e3 |
2.229e3 |
|
Mass fraction of CH4 |
1 |
0.95 |
0.85 |
0.7 |
|
Mass fraction of CO2 |
0.1428 |
0.1423 |
0.1411 |
0.1386 |
|
Mass fraction of H2O |
0.1204 |
0.123 |
0.1507 |
0.3 |
|
Mass fraction of N2 |
0.77 |
0.77 |
0.77 |
0.77 |
|
Mass fraction of O2 |
0.23 |
0.23 |
0.243 |
0.241 |
|
Mass fraction of NOX |
4.212e-4 |
3.394e-4 |
2.083e-4 |
8.167e-5 |
|
Mass fraction of soot |
6.482e-2 |
5.419e-2 |
3.75e-2 |
1.989e-2 |
From the above comparison table, we can find that small addition of water in fuel plays an important role in pollution control and less production of nox and soot material. Emission of nox and soot are potentially harmful to environment and human health. The general observation from the combustion analysis tells that the level of nox and soot decreases with increase in water content inside fuel. The temperature also decreases at the outlet section due to this factor. Among all the cases 30% addition of water content inside fuel is found to be best and also supports the claim to reduce the pollutants effectively and increase the life span of engine.
Conclusions:
- A two step methane air mixture is followed by nox and soot modelling which predicts the amount of pollutants at the outlet.
- With appropriate addition of water, the reduction of pollutants at the outlet is obtained.
- The CFD predicted analysis supports the claim to reduce the pollutant at the outlet with certain of fuel water mixture.