Challenge 1
Solution:
1.0 Aim:
To plot the stress-strain curve of concrete as per the modified Hognestad method and per IS 456-2000 and to show the comparison and characteristic features of the stress-strain curves.
2.0 Introduction:
It is the graphical illustration of the concrete material deformation under applied load. The horizontal axis is labeled Strain and the vertical axis is labeled Stress. Concrete is generally subjected to Compressive failure. The produced curve is non-linear. The graph has been plotted using Modified Hognestad and IS 456 2000.
3.0 Explanation:
3.1 As per clause 6.2.3.1, IS 456-2000: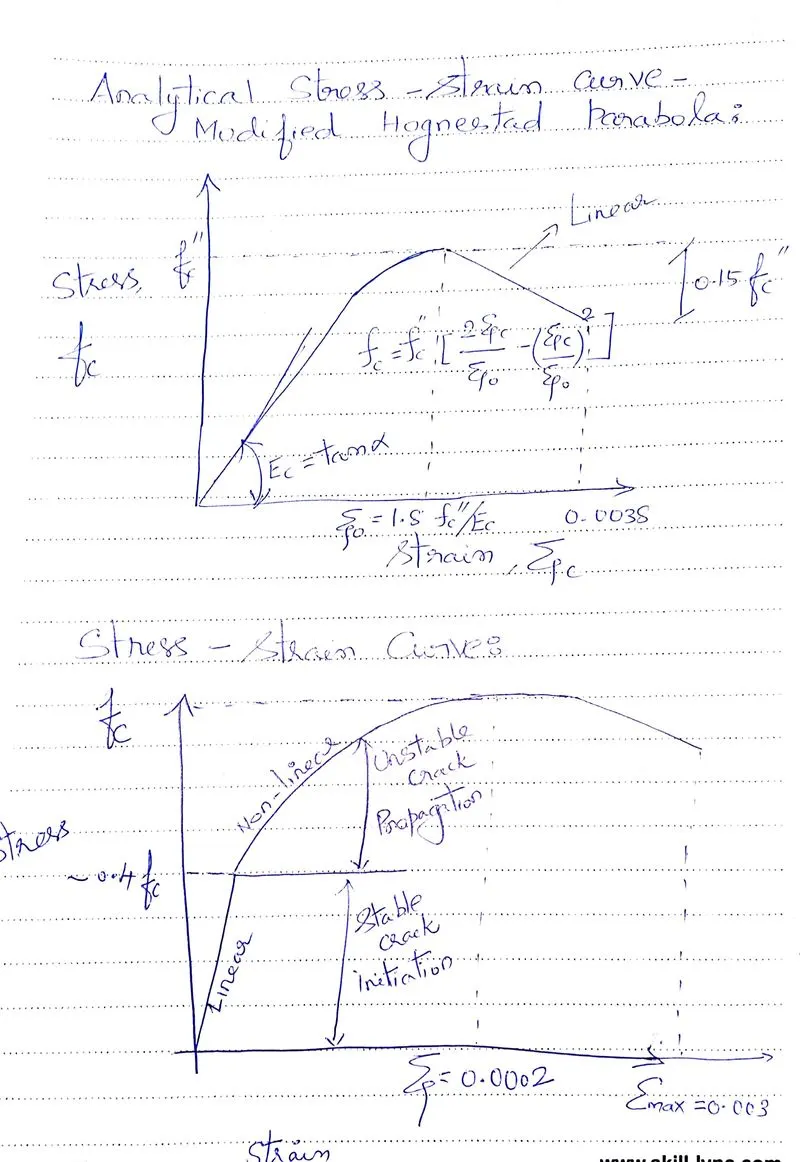
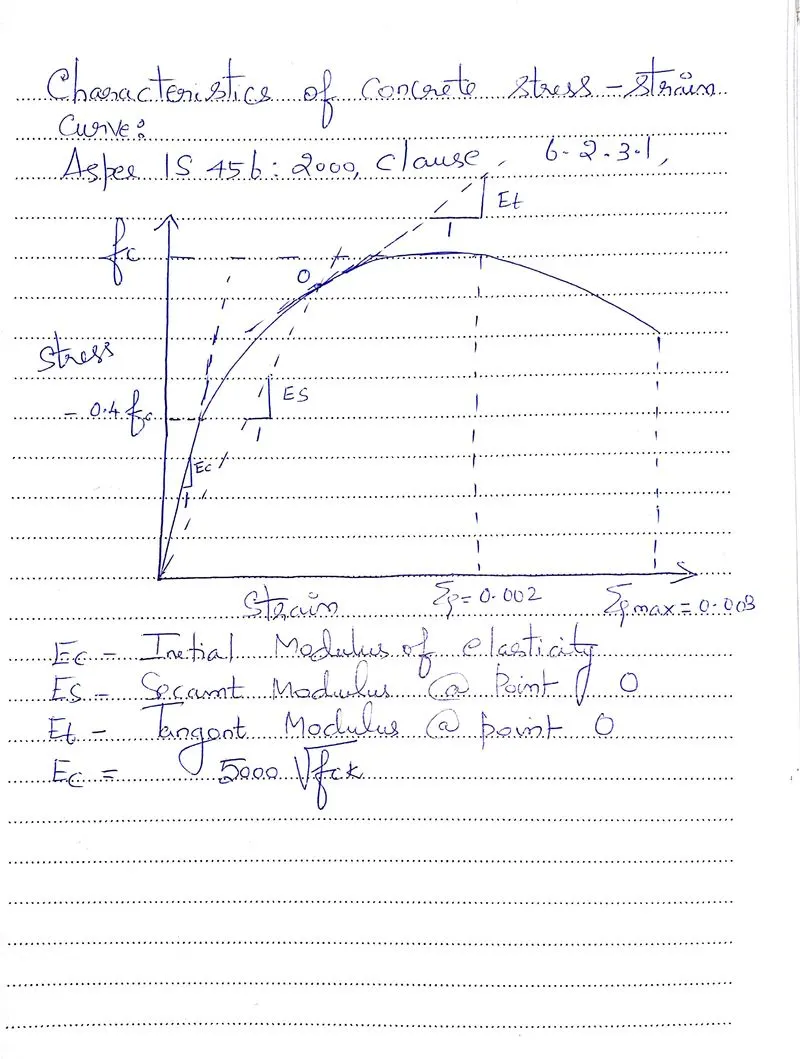
The curve starts at the origin and travels upright linear up to 0.4 fc on the y-axis. Then, the curve travels like a non-linear curve increasing, attaining a peak, and travels up to some point, and ends linearly at a point ε=0.003. Peak Strength, fc is at ε=0.002. Above the point 0.4 fc, the curve is non-linear under unstable crack propagation, below this point, the region is said to be stable crack initiation.
3.2 Modified Hognestad Stress-Strain Curve:
The horizontal axis is labeled Strain, ε and the vertical axis is labeled Stress, fc. The curve starts at the origin and travels upright linear, Then, the curve travels like a non-linear curve increasing, attaining a peak point fc’, travels up to some point at ε0 = 1.8 fc”/Ec , and ends linearly at a point ε=0.0038.
Here, fc= fc” [ 2 (εc/ε0) - (εc/ε0)2]
A tangent has been drawn along the originated curve, the angle measured is Ec=tanα
The height from the peak point to the endpoint of the linear curve is 0.15 fc’.
4.0 Characteristic features of the comparison of the stress-strain curves:
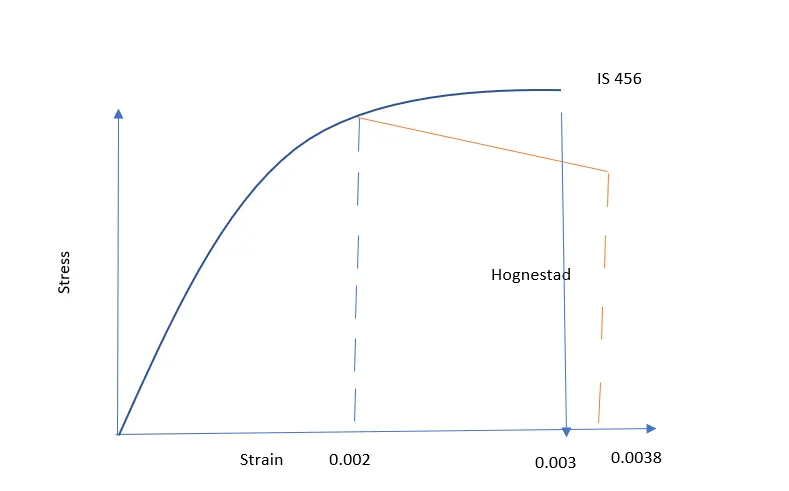
IS 456 suggests a perfect constitutive model for concrete and is assumed to be a peak strain of 0.002 at a peak stress fc. Hognestad’s method states that the ultimate strain value is 0.0038. IS 456 Method state that the ultimate strain value is 0.003. IS 456 adopts a parabolic linear stress-strain curve for concrete. The stress-strain relationship is 0.002 under direct compression and 0.0035 under flexure. Ec=5000 `root`fck.
5.0 Result:
The non-linear behavior of concrete leads to the formation of microcracks. These microcracks will be developed under the application of load. Thus, the stress-strain curve for both methods has been studied.