Centrifugal pump design and analysis
PROJECT REPORT
CENTRIFUGAL PUMP DESIGN AND ANALYSIS
Centrifugal pump is a hydraulic machine which converts mechanical energy into hydraulic energy by the use of centrifugal force acting on the fluid. These are the most popular and commonly used type of pumps for the transfer of fluids from low level to high level. Its is used in places like agriculture, municipal (water and wastewater plants), industrial, power generation plants, petroleum, mining, chemical, pharmaceutical and many others.When a certain mass of liquid is made to rotate by an external source, it is thrown away from the centrifugal axis of rotation and a head is impressed which enables it to rise to a higher level. Centrifugal Pumps can be used for viscous and non-viscous liquids and has higher efficiency.
The Main parts of Centrifugal Pump are:
1. Impeller 2. Casing 3. Delivery Pipe 4. Suction Pipe with Foot Valve Strainer
Working of Centrifugal Pump :
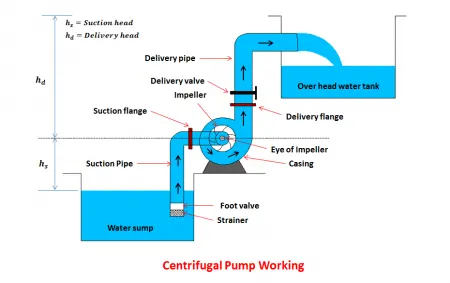
The first step in the operation of a centrifugal pump is priming. Priming is the operation in which suction pipe casing of the pump and the position of fluid with the liquid which is to be pumped so that all the air from the position of pump is driven out and no air is left. The necessity of priming of a centrifugal pump is due to the fact that the pressure generated at the centrifugal pump impeller is directly proportional to density of fluid that is in contact with it.
After the pump is primed the delivery valve is still kept closed and electric motor is started to rotate the impeller. The delivery valve is kept closed in order to reduce valve is opened the liquid is made to flow in an outward radial direction there by vanes of impeller at the outer circumference with high velocity at outer circumference due to centrifugal action vacuum is created.
This cause liquid from sump to rush through suction pipe to eye of impeller thereby replacing long discharge from center circumference of the impeller is utilized in lifting liquid to required height through delivery pipe.
OBJECTIVE :
Design a 3D model of Centrifugal Pump, and run a baseline flow simulation of Inlet flow as atmosphere Pressure and then perform Outlet flow and a study it for different velocities and plot the Performance diagram. Also, Obtain the relationship between Pressure ratio and mass flow rate and explain your results.
GEOMETRIC PARAMETERS :
| 1. | Impeller Diameter | 0.02 m |
| 2. | Outer Casing Diameter | 0.05 m |
| 3. | Inlet pipe length | 0.05 m |
| 4. | Outlet pipe length | 0.06 m |
CAD MODELS :
PROCEDURE:
FIRST, Design a 3D model of Centrifugal Pump with given input dimensions having total numbers of blades equal to 6.
SECOND, Set the rotating speed of the region equal to1000rpm. Also create lids Lids are at both ends of inlet and outlet.
THIRD, Setup a new flow simulation project and Insert Boundary conditions as Inlet as Environmental pressure 1 bar and Outlet as outlet velocity as 10 m/s.
FOURTH, Add surface goals of mass flow rate and total pressure at inlet, total pressure at outlet to find pressure ratio.
FIFTH, To change the different outlet velocity, Simulation is done with the velocity values of 10m/s, 15m/s, 20m/s, 25m/s, 30m/s in Input variables to study its nature. For Output parameters adding surface goal of total pressure inlet , surface goal of total pressure outlet, surface goal of mass flow rate at 1 kg/s, and the Cut plot of pressure and velocity is added.
SXITH, Configure Flow Trajectories for Pressure and Velocity to evaluate results.
RESULTS :
CASE 1 : OUTLET VELOCITY = 10 m/s
i} Velocity Plot ii} Pressure Plot
CASE 2 : OUTLET VELOCITY = 15 m/s
i} Velocity Plot ii} Pressure Plot
CASE 3 : OUTLET VELOCITY = 20 m/s
i} Velocity Plot ii} Pressure Plot
CASE 4 : OUTLET VELOCITY = 25 m/s
i} Velocity Plot ii} Pressure Plot
CASE 5 : OUTLET VELOCITY = 30 m/s
i} Velocity Plot ii} Pressure Plot
COMPARISION TABLE :
| Velocity (m/s) | SG Av Total Pressure Outlet [Pa] | SG Av Total Pressure Inlet [Pa] | Pressure Ratio | Mass Flow Rate |
| 10 | 1004518.103 | 101324.99999 | 9.91382 | -0.0439669938 |
| 15 | 950635.3265 | 101325 | 9.38204 | 0.227224717 |
| 20 | 877785.5231 | 101325.0023 | 8.66306 | 0.085217946 |
| 25 | 811710.1308 | 101325.0019 | 8.01095 | -0.242648606 |
| 30 | 621535.011 | 101324.9987 | 6.13407 | -0.125454666 |
1. Outlet Pressure vs Velocity
i} Comparision data table
| SG Av Total Pressure Outlet [Pa] | Velocity (m/s) |
| 1004518.103 | 10 |
| 950635.3265 | 15 |
| 877785.5231 | 20 |
| 811710.1308 | 25 |
| 621535.011 | 30 |
ii} Plot
2. Intlet pressure vs Velocity
i} Comparision data table
| SG Av Total Pressure Inlet [Pa] | Velocity (m/s) |
| 101324.99999 | 10 |
| 101325 | 15 |
| 101325.0023 | 20 |
| 101325.0019 | 25 |
| 101324.9987 | 30 |
ii} Plot
3. Mass flow rate vs velocity
i} Comparision data table
| Velocity (m/s) | Mass Flow Rate |
| 10 | -0.0439669938 |
| 15 | 0.227224717 |
| 20 | 0.085217946 |
| 25 | -0.242648606 |
| 30 | -0.125454666 |
ii} Plot
4. Pressure ratio vs Mass flow rate
i} Comparision data table
| Pressure Ratio | Mass Flow Rate |
| 9.91382 | -0.0439669938 |
| 9.38204 | 0.227224717 |
| 8.66306 | 0.085217946 |
| 8.01095 | -0.242648606 |
| 6.13407 | -0.125454666 |
ii} Plot
CONCLUSION:
1. Outlet velocity is inversly propotional to Pressure as Outlet velocity increased, pressure value gets decreased.
2. Mass flow rate remains nearly constant for all velocities for the model.