Breaking Ice with Air cushion Vehicle - Finding minimum pressure with Newton-Raphson method
AIM:
To determine the minimum cushion pressure
OBJECTIVE:
1.Write a program to Tabulate the results of p for h = [0.6,1.2,1.8,2.4,3,3.6,4.2] assuming a suitable relaxation factor.
2.Use the newton Raphson method to find out the value of pressure for h = 0.6 ft.
3.Tabulating the No of iterations and Relaxation
PROBLEM STATEMENT:
The given equation is to determine the cushion pressure needed to break a given thickness of ice using an air cushion vehicle
Where,
p=Cushion Pressure
h=Thickness of ice field
r=Size of the air cushion
σ=Tensile Strength
β-Width of the Ice wedge
The Given Inputs are,
β=0.5
r=40 feet
σ=150 pounds per square inch (psi)
h = [0.6,1.2,1.8,2.4,3,3.6,4.2]
According to Newton Raphson method
X_NEW=X_GUESS-α(F(X_GUESS)/F'(X_GUESS)
Wher X in ths condition is pressure
X_GUESS is the value that we guess
α is considered as the relaxation factor
So the code to do that s given below
PROGRAM:
The code used
#Breaking Ice with Air cushion Vehicle-Find Minimum Pressure with Newton Raphson Method

import math
import matplotlib.pyplot as plt
import numpy as np

#Function

def f(p,h):
	return (pow(p,3)*(1-pow(beta,2)))+(((0.4*h*pow(beta,2))-(sigma*pow(h,2)/pow(r,2)))*pow(p,2))+(((pow(sigma,2)*pow(h,4))/(3*pow(r,4)))*p)-(pow((sigma*pow(h,2)/(3*pow(r,2))),3))

#Derrivative

def fprime(p,h):
	return (3*(pow(p,2)*(1-pow(beta,2))))+(2*p*((0.4*h*pow(beta,2))-(sigma*pow(h,2)/pow(r,2))))+((pow(sigma,2)*pow(h,4))/(3*pow(r,4)))

#Given inputs

beta=0.5
r=40
sigma=150
Height=[0.6,1.2,1.8,2.4,3.0,3.6,4.2]

#General Inputs

p_guess=0.2      #Guessing Pressure
alpha=1         #Relaxation Factor
tolerance=1e-4   #Tolerance Eroor
Pressure= []     #Pressure Array


#Code to run the Newton Raphson Iterations

iter = 1
for h in Height:
	while(abs(f(p_guess,h))>tolerance):
		p_guess=p_guess-((f(p_guess,h)/fprime(p_guess,h))*alpha)
		iter = iter+1
	Pressure.append(p_guess)
	print(p_guess)

#Code to show the pressure and heights

for i in range(0,7):
	if i==0:
		print("Height:Pressure")
	print( Height[i] , ":" , Pressure[i] )

#Plotting
print('Number of iterations = ',iter)
plt.plot(Height,Pressure)
plt.xlabel('Height (Feet)')
plt.ylabel('Pressure (psi)')
plt.title('PRESSURE VS HEIGHT')
plt.xlim([0,10])
plt.ylim([0,0.5])
plt.show()
SOLUTION/CODE EXPLANATION:
Iitially we have to import math,matplotlib.pyplot,and numpy and next step we have taken is to define our function and we defined the function.According tho Newton Raphson method we have to define the derrivative of the function also and we defined that one also.Comming to next we have started giving inputs.
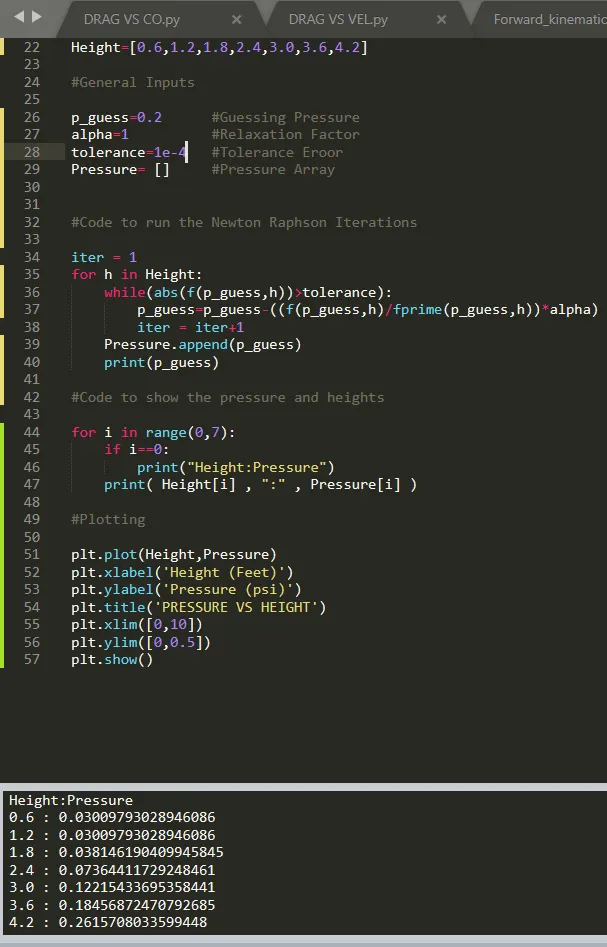
From 34 to 40 code we have coded to run the Newton Raphson iterations where iter is nothing but the variable and from 44 to 47 we just coded to print the Height and Pressure and atlast from 51 to 57 we have coded to plot the graph
RESULT:
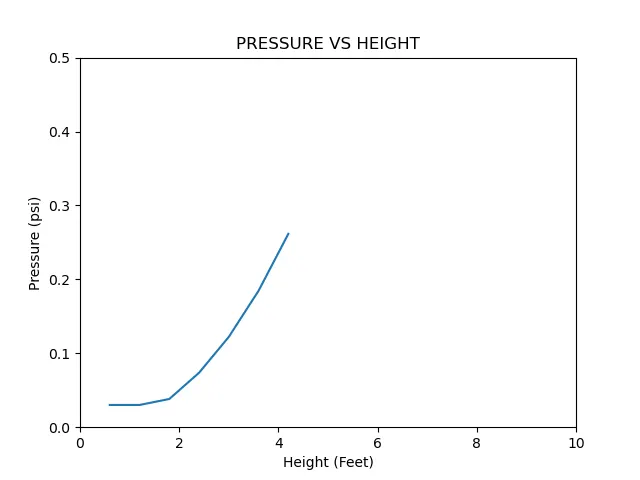
Using the Newton Raphson mmethod we have find the valure of pressure for h=0.6 ft and i.e is 0.03 and we have tabulate dthe result for given values of h
CASE 2
Tabulating the Relaxation Factor, Pressure and the No of Iterations
Find the below code
import math
import matplotlib.pyplot as plt
import numpy as np


#Function

def f(p,h):
	return (pow(p,3)*(1-pow(beta,2)))+(((0.4*h*pow(beta,2))-(sigma*pow(h,2)/pow(r,2)))*pow(p,2))+(((pow(sigma,2)*pow(h,4))/(3*pow(r,4)))*p)-(pow((sigma*pow(h,2)/(3*pow(r,2))),3))

#Derrivative

def fprime(p,h):
	return (3*(pow(p,2)*(1-pow(beta,2))))+(2*p*((0.4*h*pow(beta,2))-(sigma*pow(h,2)/pow(r,2))))+((pow(sigma,2)*pow(h,4))/(3*pow(r,4)))

#Given inputs

beta=0.5   #Width of the ice wedge
r=40       #size of the air cushion
sigma=150*144 #tensile stength of ice(converted to psf)
h=0.6         #thickness of the ice
alpha=np.linspace(0.1,1.5,100)
tol=1e-4

iterations=[]
pressure=[]
for i in alpha:
	iter=1
	p_guess=80
	while((abs(f(p_guess,h)))>tol):

		p_guess=p_guess-((f(p_guess,h)/fprime(p_guess,h))*i)
		iter = iter+1
	iterations.append(iter)
	pressure.append(p_guess)


#Printing the Results
print('Relaxation Factor',':' ,'Minimum Pressure',':','No of iterations')
for j in range(0,100):
	print(alpha[j],':',pressure[j],':',iterations[j])


#Plotting the Graphs
plt.plot(alpha,iterations)
plt.xlabel('Relaxation Factor')
plt.ylabel('No of Iterations')
plt.show()
CODE EXPLANATION:
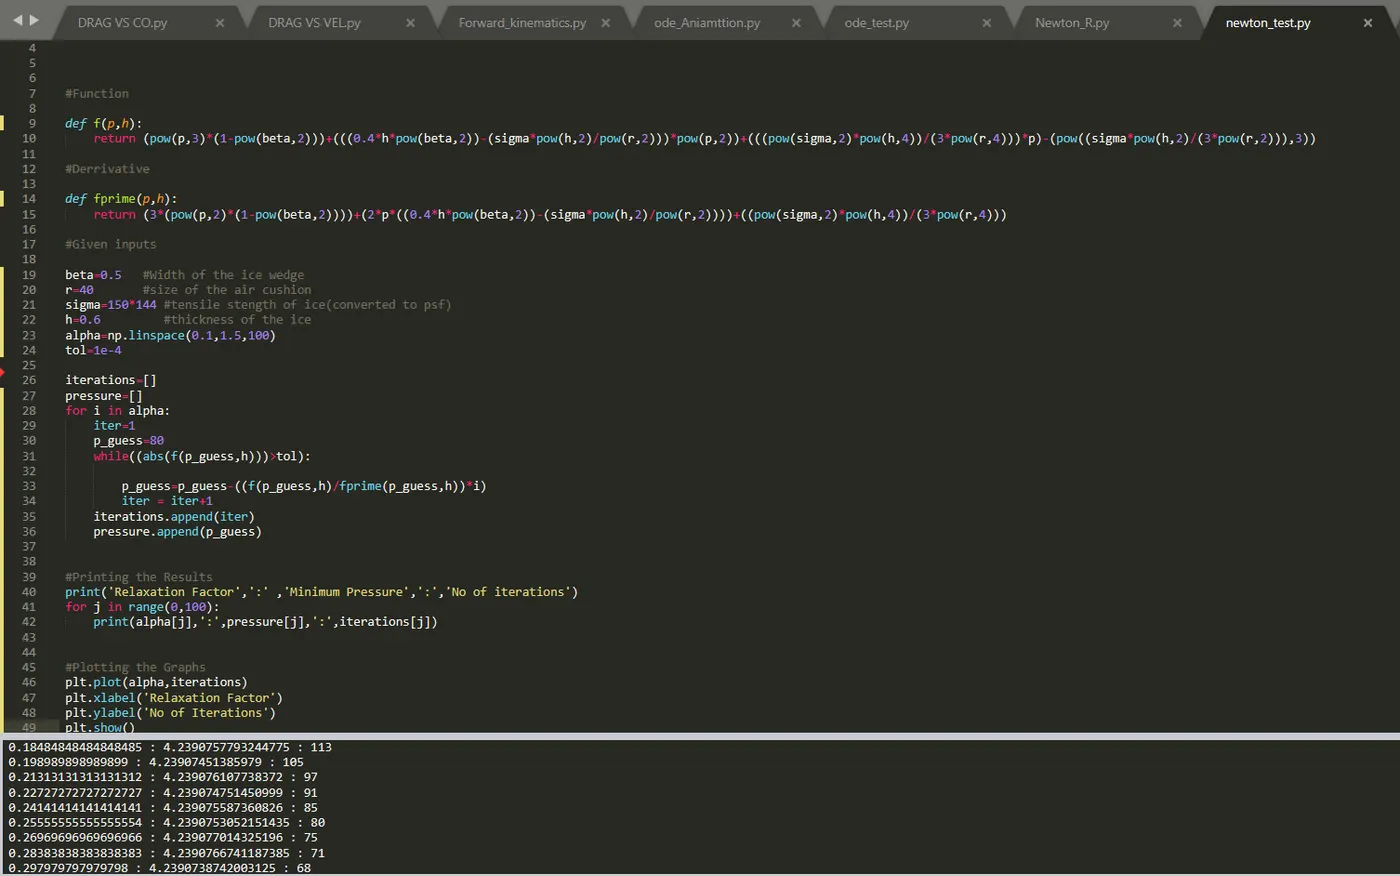
Same as before code we have started importing the modules and defining the function. And the basic inputs where given including the h=0.6 and along with that we were created the alpha using linspace command where it will produce 100 values between 0.1 and 1.5.
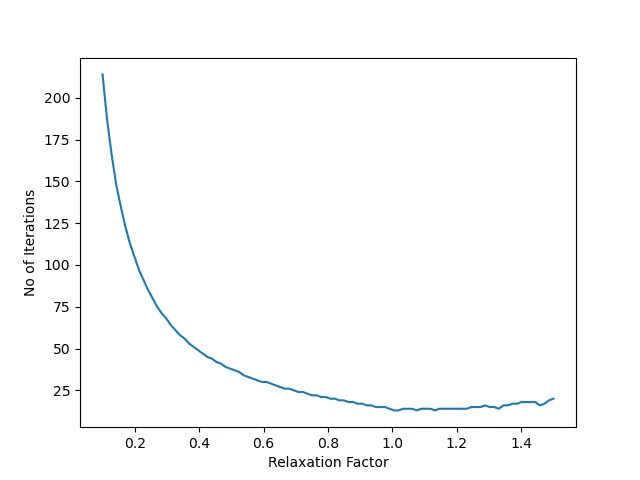
Finally we have tabulated the No of iterations vs Relaxation Factor and we plotted the graph between No of Iterations VS Relaxation factor
RESULT:
EXPLANATION OF RESULT:
From the above plot we have found that minimum iterations is found nearly 1 value of Relaxation Factor along with that all the plots were plotted and tabulated according to the requirement