Bird Strike - Project - 2
Objective - To simulate a situation when a Bird collides with an Aero Engine blade and check stresses developed in the blades.
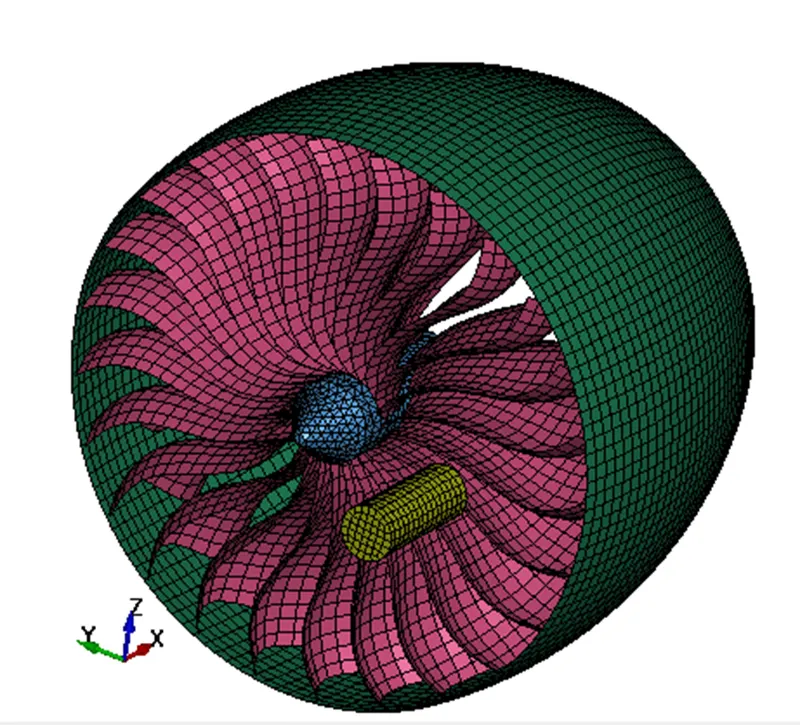
The model considered for analysis –
Bird and Aero Engine Blade Assembly
Inputs -
Unit considered – kg mm ms
Stress is in GPa
Strain is in mm/mm
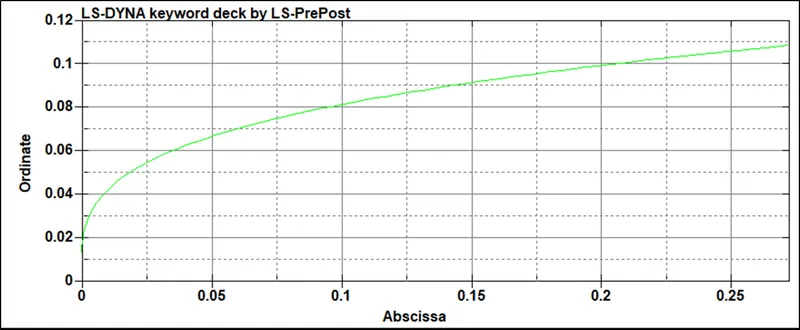
Stress vs Strain curve provided for Aluminum material for Blades
Case Setup -
Numbering Approach –
Part ID –
Bird – 1000
Blade – 2000
Casing – 3000
Hub – 4000
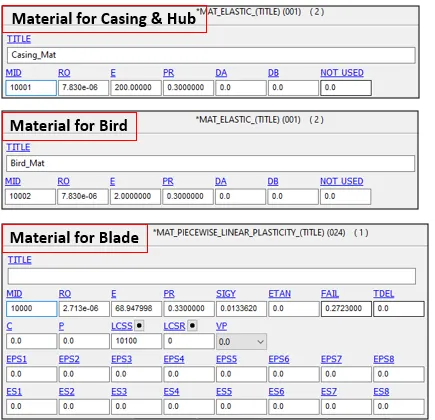
MATID –
Blade – MID - 10000
Casing – MID – 10001
Bird – MID - 10002
Aluminum Blade Material LCID – 10100
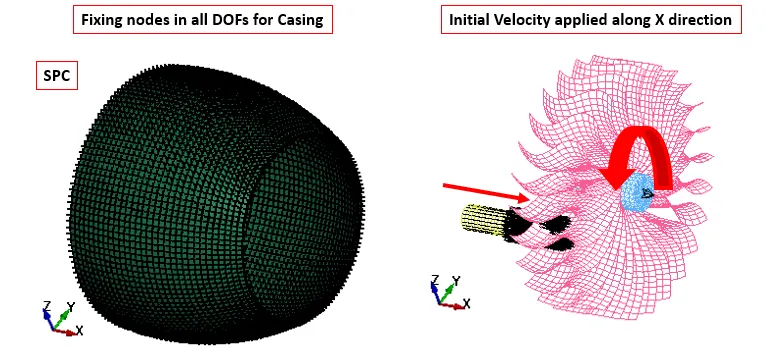
SPC ID –
13000 – NSID – 12200 (All Nodes for Casing)
Contact –
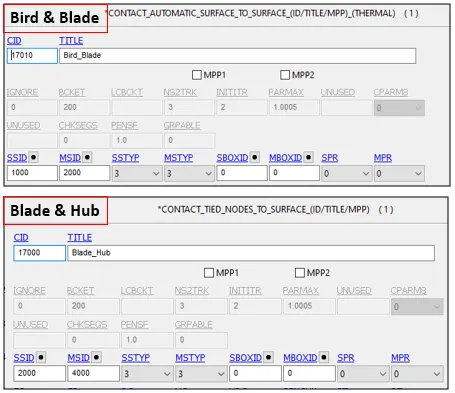
Tied Contact for Blade to Hub – CID – 17000
Surface to Surface for Blades to Bird – 17010
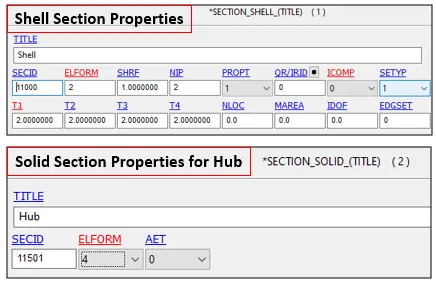
Section ID –
Shell – SECID – 11000 – Bird, Blade, Casing
Solid – SECID – 11501 - Hub
Case Setup -
Units System considered – kg-mm-ms
Elastic material with properties for Casing and
Hub –
RO = 7.83e-06 kg/mm3
PR = 0.3
E = 200 GPa
Elastic material with properties for Bird -
RO = 7.83e-06 kg/mm3
PR = 0.3
E = 2 Gpa
Elastic material with properties for Blade -
RO = 2.713e-06 kg/mm3
PR = 0.33
E = 68.94 Gpa
Case Setup -
Units System considered – kg-mm-ms
Section for Bird, Blades and Casing
Shell Properties with
ELFORM=2
Thickness = 2 mm
Section for Hub –
Shell Properties with
ELFORM = 4 (Since tetrahedral mesh is done and
Rotation is involved)
Contacts -
- Automatic Surface to Surface contact for
Bird and Blade to avoid any penetration after
Collision
- Tied Nodes to Surface Contact between
Hub and Blades,
Boundary Conditions -
Units System considered – Kg-mm-ms
Initial Velocity Generation = 22.352 mm/ms in X Direction – Speed of Bird towards Blade
Initial Velocity Generation = 0.1 rad/ms along X Direction – Rotational Speed of Blade and Hub
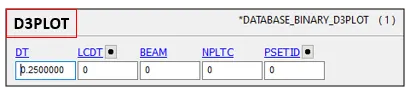
Output Requests -
Control termination – 5 ms
Output Requests –
Database > Binary D3PLOT at DT 0.25 ms
Database > ASCII option – GLSTAT, MATSUM AT DT= 0.25 ms

Energy Plots -
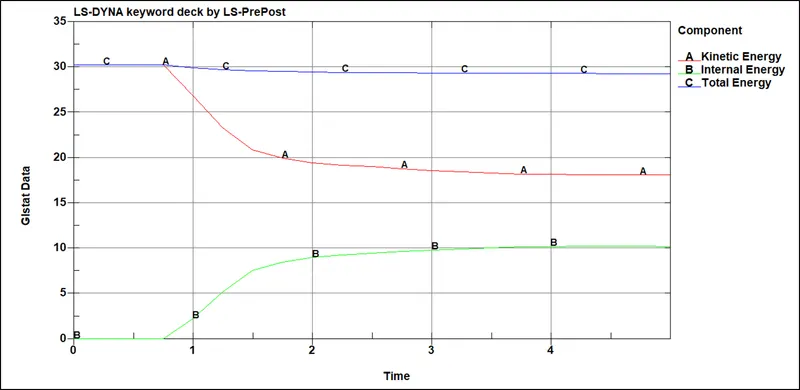
From the graph it is visible that all of Kinetic Energy is being converted to Internal Energy and Total Energy does not show any peaks or fluctuations. Hence results could represent real life scenario.
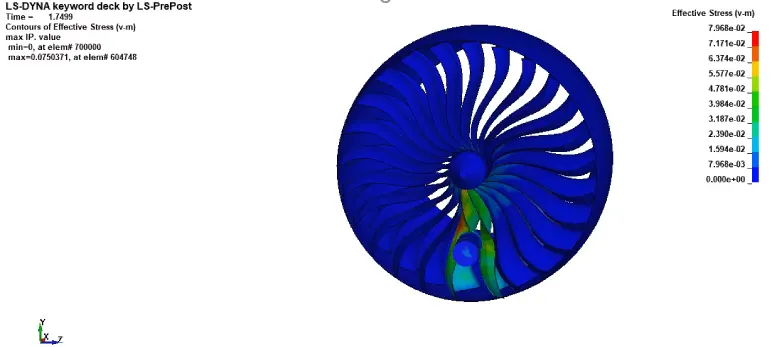
Animations – Von Mises Stress Plot (GPa) -
Max stress = 79.68 MPa
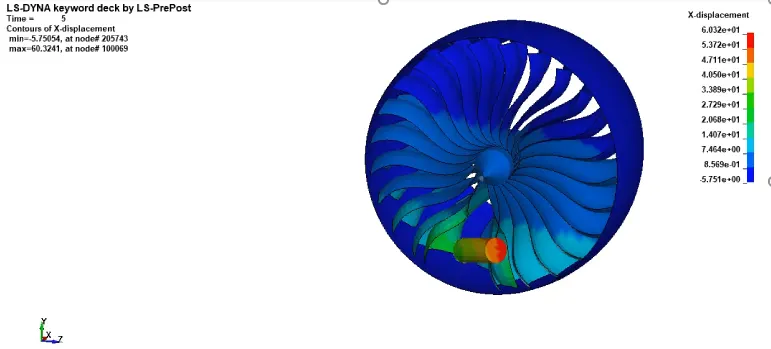
Animations – X Displacement Plot (mm) -
Max Displacement along X Axis = 60.32 mm
Conclusion -
Since yield stress for Blade material is 13 MPa and stresses on blades after collision is more than 79 MPa, the blades would fail.