Basics of ML & AL Week 2 Challenge
1. Calculate all 4 business moments using pen and paper for the below data set?
----> Answer file attached below.
2. What is the significance of expected value when a simple mean (Sum of all observations/number of observations) is already in place
An expected value gives a quick insight into the behavior of a random variable without knowing if it is discrete or
continuous.
Therefore, two random variables with the same expected value can have different probability distributions. Other
descriptive measures like standard deviation also affect the shape of the distribution. The expected value of a
random variable X is denoted as E(X).
Let's say that X is a discrete random variable with possible values x1, X2, X3, ..., Xn. Also, p(xi) denotes P(x = x¡). Therefore,
the expected value of X is:
population mean = E(X) = summation p(x¡) – x¡ ... where the elements are summed over all the values of the random variable X.
If X is a continuous random variable with a probability density function f(x), the expected value of X is:
population mean = E(X) = intergral x.f(x)dx
3. Having skewness in the curve considered to be bad in the analysis?
Skewness refers to distortion or lack of symmetry in a symmetrical bell curve, or normal distribution in a set of data. If
the curve is shifted to the left or right, it is said to be skewed. Skewness can be qualified as a representation of the extent
to which a given distribution varies from a normal distribution. A normal distribution has a skew of zero.
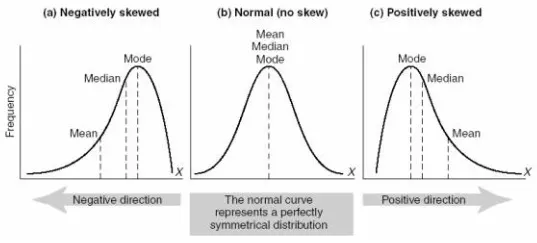
Skewed data can often lead to skewed residuals because "outliers" are strongly associated with skewness, and
outliers tend to remain outliers in the residuals, making residuals skewed. But technically there is
nothing wrong with skewed data. It can often lead to non-skewed residuals if the model is specified correctly.
Mean: Average of the data sets
Median: Central value in the data sets
Mode: Repeating number in the data set
4. Evaluate the probabilities for continuous normal distribution with given mean = 680 and standard deviation = 31
---> Answer file is attached below
5. Explain the curve on the right side
The given curve is the "Normal Distribution curve" for the random variable and the percentage is the
"Standard Deviations" from the mean. The distribution in the curve is perfect without any skewness.
The Normal Distribution is a probability function that describes how the values of a variable are
distributed. It is an asymmetric distribution where most of the observations cluster around the central peak
and the probabilities for values further away from the mean taper off equally in both directions.
1s.d from the mean is around 34.1 on either side of the mean and hence the values lie b/w -34.1% and 34.1% =
68.2% of values fall in the 1 S.D
2s.d from the mean is taken as 34.1+34.1+13.6+13.6= 95.4% approximately the values flase in the 2S.D from the
mean.
3s.d from the mean is taken as 34.1+34.1+13.6+13.6+2.1+2.1 = 99.7% approximately the values fall in the 3S.D from
the mean.