Basics of ML & AL Week 2 Challenge
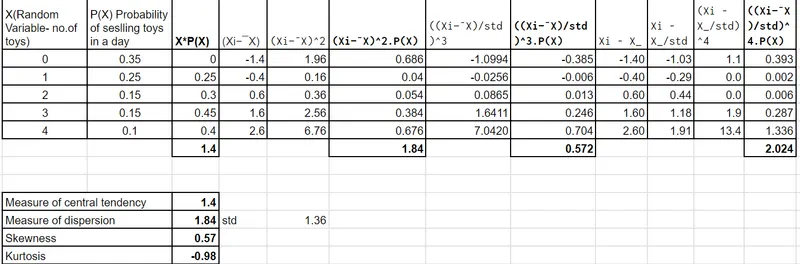
1.Calculate all 4 business moments using pen and paper for the below data set?
2.What is the significance of expected value when simple mean (Sum of all observations/number of observations) is already in place
Mean is the simple average of all the values, Expected value is the average value of a random variable which is probability-weighted.While mean does not take into account probability, expectation considers probability and it is probability-weighted. The very fact that expectation is described as weighted average or mean of all possible values that a random variable can take, expectation becomes quite different than mean which is simply the sum of all values divided by the number of values.
The expected value of a random variable indicates its central or average value. It is an important summary value of the distribution of the variable. An expected value gives a quick insight into the behavior of a random variable.
Example
A local club plans to invest Rs. 10,000 to host a football game. Further, it expects to sell tickets worth Rs. 15,000. However, if it rains on the day of the game, then it won’t sell any tickets and lose all the invested money. According to the weather forecast, there is a 20% possibility of rain on the day of the game. Is this a good investment?
Let’s make a table of probability distribution:
| Outcome | +Rs. 5,000 | -Rs. 10,000 |
| Probability | 0.80 | 0.20 |
Therefore, the expected value is
E(X) = 5000 x 0.8 – 10000 x 0.2 = 4000 – 2000 = Rs. 2,000
Hence, the club can expect a return of Rs. 2,000.
3.Having skewness in the curve considered to be bad in the analysis?
Skewness refers to a distortion or asymmetry that deviates from the symmetrical bell curve, or normal distribution, in a set of data. If the curve is shifted to the left or to the right, it is said to be skewed. Skewness can be quantified as a representation of the extent to which a given distribution varies from a normal distribution. A normal distribution has a skew of zero.
In the curve of a distribution, the data on the right side of the curve may taper differently from the data on the left side. These taperings are known as "tails." Negative skew refers to a longer or fatter tail on the left side of the distribution, while positive skew refers to a longer or fatter tail on the right.
The mean of positively skewed data will be greater than the median. In a distribution that is negatively skewed, the exact opposite is the case: the mean of negatively skewed data will be less than the median. If the data graphs symmetrically, the distribution has zero skewness, regardless of how long or fat the tails are.
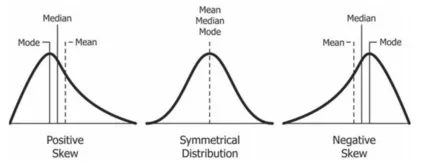
A positive skew could be good or bad, depending on the mean. A positive mean with a positive skew is good, while a negative mean with a positive skew is not good. If a data set has a positive skew, but the mean of the returns is negative, it means that overall performance is negative. A negative skew is generally not good, because it highlights the risk of left tail events. While a consistent and steady track record with a positive mean would be a great thing, if the track record has a negative skew then you should proceed with caution.
Conclusion:
In conclusion, the skewness coefficient of a set of data points helps us determine the overall shape of the distribution curve, whether it’s positive or negative. The coefficient number also helps us determine whether the right tail or the left tail of the distribution is more pronounced. We cannot assess solely based on its skewness, however, in conjunction with other statistics and variables it allows us to have a more in-depth understanding of the consistency and the potential left tail events in the future.
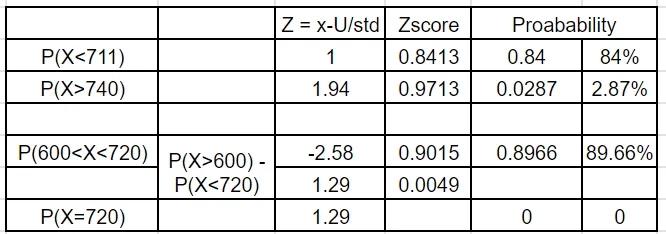
4.Evaluate the probabilities for continuous normal distribution with given mean = 680 and standard deviation = 31
5.Explain the curve on the right side
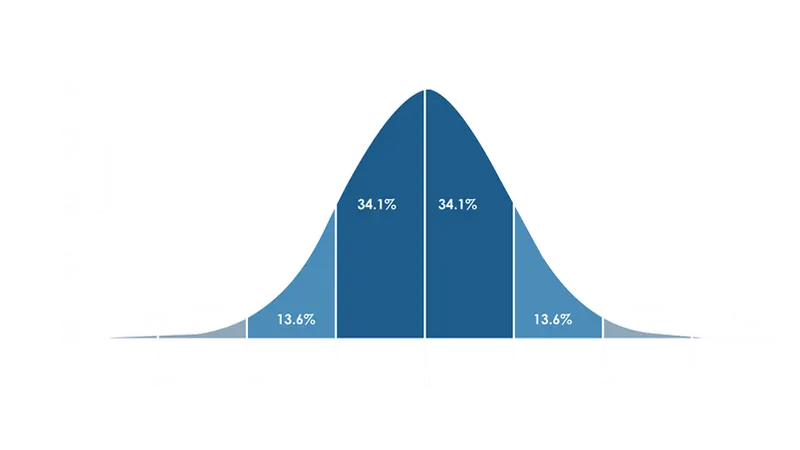
By visually observing graph, it tells us the the percentage of values falling under each deviation from the mean values. In this graph, it states that 68.2%(34.1% values lie between -1 to 0 and 34.1% between 0 to 1) of the data values are within the range of -1 to +1 and 95.4% data values lie within the range of -2 to +2.