Basics of Probability and Statistics Week 1 Challenge
1. Difference between population variance and sample variance:
The main difference between population variance and sample variance relates to calculation of variance. Variance is calculated in five steps. First mean is calculated, then we calculate deviations from the mean, and thirdly the deviations are squared, fourthly the squared deviations are summed up and finally this sum is divided by number of items for which the variance is being calculated. Thus variance= Σ(xi-x-)/n. Where xi = ith. Number, x- = mean and n = number of items..
Now, when the variance is to be calculated from population data, n is equal to the number of items. Thus if variance in blood pressure of all the 1000 people is to be calculated from data on blood pressures of all the 1000 people, then n = 1000. However when the variance is calculated from sample data 1 is to be deducted from n before dividing the sum of the squared deviations. Thus in the above example if sample data have 100 items, the denominator would be 100 – 1 = 99.
Due to this, the value of variance calculated from sample data is higher than the value that could have been found out by using population data. The logic of doing that is to compensate our lack of information about the population data. It is impossible to find out variance of heights in all the trees in forest, for our absolute lack of information about heights of all the trees. Even if we take one moderate example, like population data on heights of all the trees in one forest, it is physically possible, but the cost and time involved in this would defeat the purpose of its calculation. This is the reason sample data are taken for most of the statistical purposes, and this is accompanied by lack of information about majority of data. In order to compensate this, the value of variance and standard deviation, which is squared root of variance are higher in case of sample data than variance from population data.
This acts as an automatic shield for the analysts and decision makers. This helps the stake holder to be on the safe side while taking decision or for other inferences.
Summary: Population variance refers to the value of variance that is calculated from population data, and sample variance is the variance calculated from sample data. Due to this value of denominator in the formula for variance in case of sample data is ‘n-1’, and it is ‘n’ for population data. As a result both variance and standard deviation derived from sample data are more than those found out from population data.
2.Difference between stratified and clustered sampling
Sampling is a process of selecting respondents for your research which represent your target population. The survey will lead to great results if the selected sample represents the target audience very closely. These attributes can be age, occupation, location or any other variable.
Stratified Sampling and Cluster Sampling are both a part of probability sampling in statistical analysis. Probability Sampling is a procedure of selecting samples from a broad population for any kind of market research study.
The theory behind probability sampling is to randomly select a sample for the purpose of survey research.
Stratified Sampling:
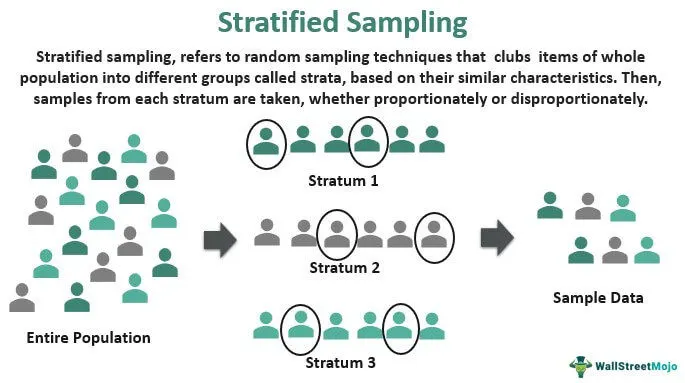
Stratified Sampling is a category under probability sampling which is based on dividing a population into strata, and members for the sample are selected randomly from these strata. In stratified sampling, the strata must be homogenous and also collectively exhaustive, and mutually exclusive as well. The strata must define a part of the population. Moreover, the members of the sample must be distinct, that is, every element must be a part of one and only one strata in the population. This implies that the entire population requires to be a part of the samples.
Charecteristics:
- Members of a sample in stratified sampling are chosen randomly from homogenous and non-overlapping strata.
- Each member of the sample must belong to one and only one strata so that the sample can represent the entire population.
Clustered Sampling:
Cluster sampling is a technique used when homogeneity is external but heterogeneity is internal within clusters/groupings. It is a process of dividing a population into multiple groups/clusters.
There are single-stage, two-stage, or multiple-stage sampling methods in cluster sampling. These methods depend upon the number of steps required to create the desired sample.
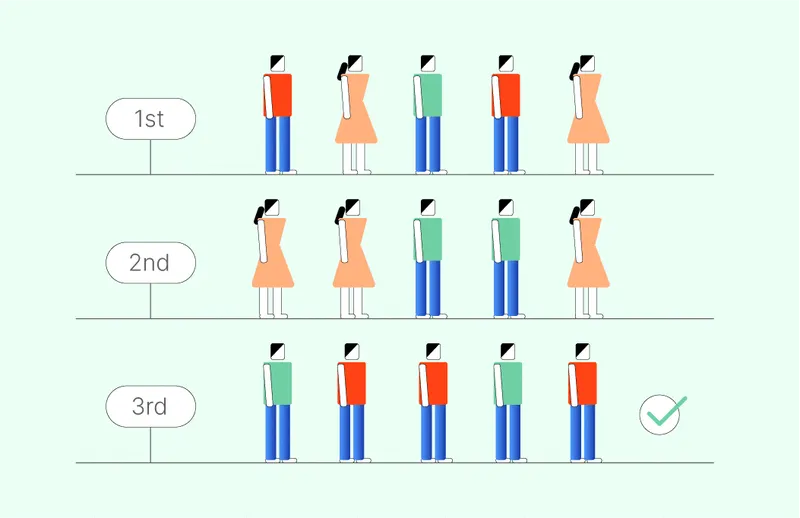
In Cluster Sampling, the total population is divided into clusters. A simple random sample of the cluster is chosen and the elements in each of these clusters are then sampled.
Charecteristics:
- Cluster sampling is cost-effective in contrast to other sampling techniques.
- Surveys on large populations are handled with help of cluster sampling.
- In a cluster sampling, the population should be heterogeneous but there must be homogeneity between clusters/groups
- The clusters must be representative of the total population.
Key Point Difference between Stratified Sampling and Cluster Sampling
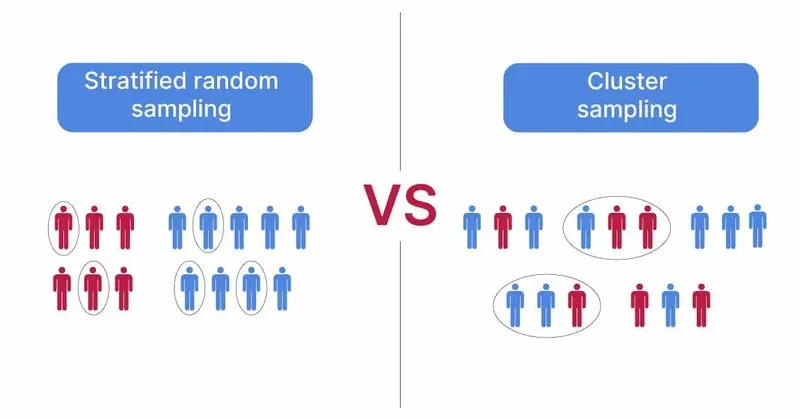
All the above information highlights the difference between the two categories of the Sampling. Underneath are some key difference to clear any lingering doubts
- In Cluster Sampling, the sampling is done on a population of clusters therefore, cluster/group is considered a sampling unit.
- In Stratified Sampling, elements within each stratum are sampled.
- In Cluster Sampling, only selected clusters are sampled.
- In Stratified Sampling, from each stratum, a random sample is selected.
- In Cluster Sampling, the aim is to reduce cost and increase the efficiency of sampling.
- In Stratified Sampling, the motive is to increase precision to reduce error.
3. How many different samples can be created out of population of size n.
It depends on the size of the sample.
An un ordered sample has n! orderings if all are distinct,
For instance the letters aaabbbbccccc have only 10!/3!4!5! arrangements.
In general, the answer is at most N raised to the power n, which is finite.
4.What is the probability of drawing 2 jacks from a pack of card
There are 4 jacks in a deck of 52 cards, Therefore the probability of getting two jacks consectively is 1/221
Probability of getting first card jack is : 4/52 = 1/13
Probability of getting second card jack is 3/51 = 1/17
Probability of getting both the cards jack is (1/13)*(1/17) = 1/221
5.What is the probability that both the numbers on dice are same while rolling 2 dice
Probability of getting two same numbers on dice is 1/6.
Probability for the first roll to turn up as 1 : 1/6
Probability for the second roll also to turn up as 1 : 1/6
Therefore , probability that the first two rolls turn up as 1 is (1/6*1/6) = 1/36
Now the probability that the first two rolls turn up as 2 is (1/6*1/6) = 1/36 . . . . Same applies for 3,4,5,6
So the probability for any number to turn up consecutively twice is (1/36+1/36+1/36+1/36+1/36+1/36) = (6/36) = 1/6
In Another way,there are total of 36(6^2) possible outcomes if two dices are rolled, out of which 6 of them will be of same numbers (1,1),(2,2),(3,3),(4,4),(5,5),(6,6). That is 6 out of 36 = 6/36 = 1/6
(1, 1) (1, 2) (1, 3) (1, 4) (1, 5) (1, 6)
(2, 1) (2, 2) (2, 3) (2, 4) (2, 5) (2, 6)
(3, 1) (3, 2) (3, 3) (3, 4) (3, 5) (3, 6)
(4, 1) (4, 2) (4, 3) (4, 4) (4, 5) (4, 6)
(5, 1) (5, 2) (5, 3) (5, 4) (5, 5) (5, 6)
(6, 1) (6, 2) (6, 3) (6, 4) (6, 5) (6, 6)
6.Why standard deviation when variance can measure the dispersion in data
In Short, Variance is used to measure how far the data values are dispersed from the mean. Whereas the standard deviation is used to calculate the amount of dispersion of the given dataset values.
Variance is expressed in Squared units.Where as, Standard deviation is expressed in the units same as the data values.
In some cases to do further operations/Calculations all the values should be in same units. In such cases standard deviation can be useful.