Basics of ML & AL Week 2 Challenge
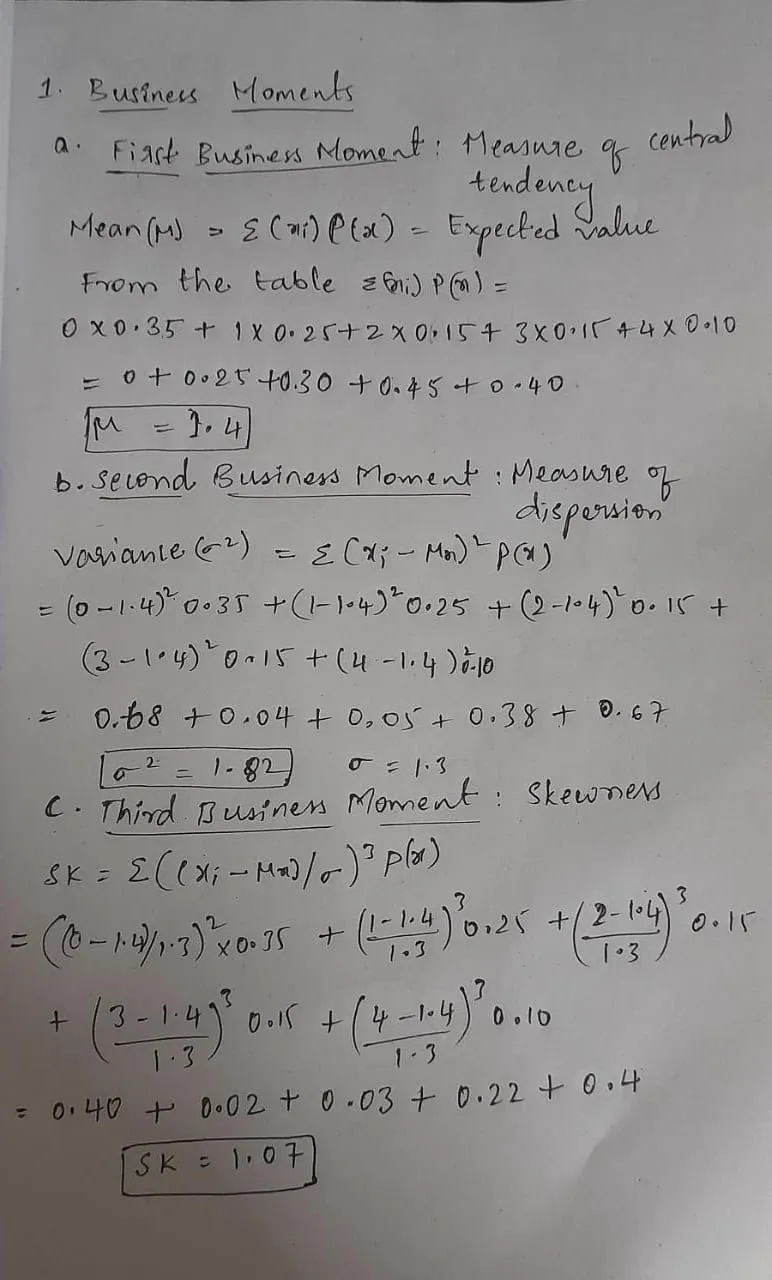
1.
. 
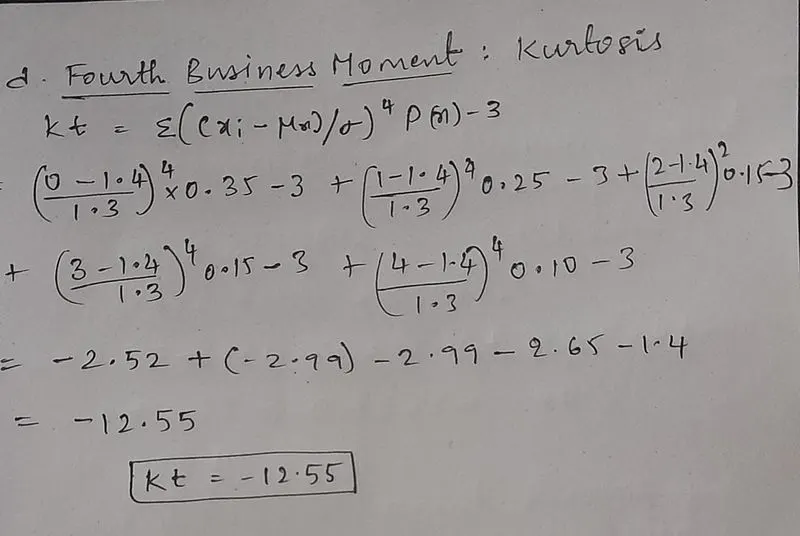
__________________________________________________________________________________________________
2. Expected value is the average value of random variable and it is an important summary value of the distribution of the
variable. The mean value will take the all observations which will suit for small data or population and we cannot take all the observations sometimes,so at that moment the excepted value will give the result for analysis.
__________________________________________________________________________________________________
3. I think "YES" . The reason is the deviation of data from the original distribution.
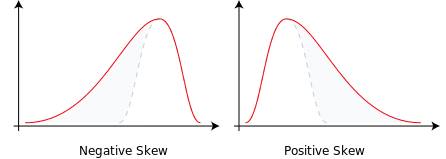
From the above image, because of the skewness we cannot approximate our data into any kind of distribution like normal.
___________________________________________________________________________________________________
4.Given data `mu=680 , sigma = 31`
a)P(X<711):
Z = `(X-mu)/sigma`
= 711-680/31 = 31/31 = 1
From Z-table for the standard score of 1 and the mean of 0 ,
P(X<711) = 0.84134 = 84.31%
b) P(X>740):
We know that total probability of any event is 1.Then
P(X>740) = 1-P(X<740)
Z`=(X-mu)/sigma`
=740-680/31 = 60/31 = 1.93
Z = 1.9
From the Z-table the standard score of 1.9 and mean 0
P(X<740) =1- 0.97128 = 0.0287
P(X<740) = 2.87%
c) P(600 First find probability of X<720 Z = `(X-mu)/sigma` =720-680/31 = 40/31 = 1.29 Z = 1.3 From the Z-table the standard score of 1.3 and mean of 0 is P(X<720) = 0.90320 Next for P(X<600) Z=`(X-mu)/sigma` = 600-680/31 = -80/31 = -2.58 Z = -2.6 From the Z-table the standard score of -2.6 and mean of 0 is P(X<600) = 0.00466 Finally P(600 = 0.90320 - 0.00466 = 0.89851 P(600 d) P(X = 720) = 0 For continuous variable probability at any point is zero 5. The bell curve shown below is the probability distribution function curve for the normal distribution. For any normal distribution.The whole data is Mean centered i.e., 50% of the data will be above the mean and the 50% of data below the mean. If the standard deviation of the data is `sigma`then, 64.2% of the data will lie between `-sigma`to `+sigma` 95.4% of the data will lie between `-2sigma` to `+2sigma` 99.7% of the data will lie between `-3sigma` to `+3sigma`