Assignment 7-Side Pole Crash Simulation Challenge
Project 2 - Side Body Crash Simulation Challenge
Aim : To perform the simulation for Side pole crash analysis of a car with recommended parameters and to plot energy graphs and identify the differences.
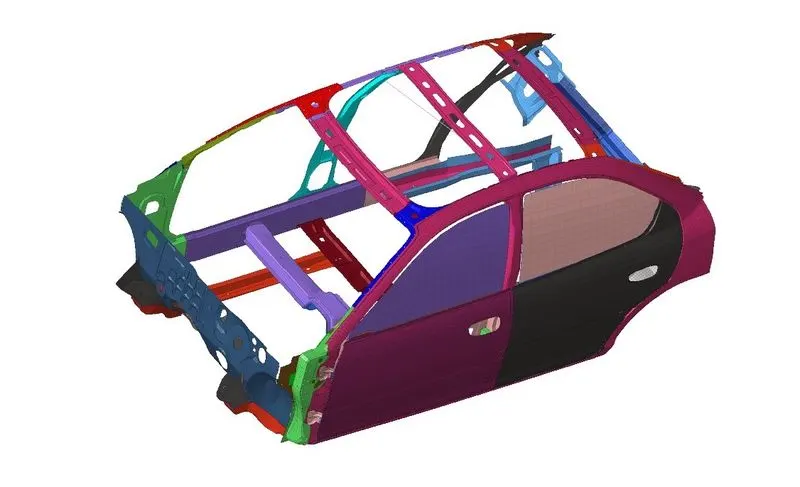
Objectives :
Side Body-BIW
- Checking the unit system and either following [Mg mm s] or [Kg mm ms].
- Creating appropriate interface, friction 0.2 and recommended parameters.
- There should be no penetrations and intersections.
- Creating a rigid pole with friction 0.1.
- Adding masses to reach target weight 700kg while getting CG about the required range.
- Adding Initial velocity 35 mph.
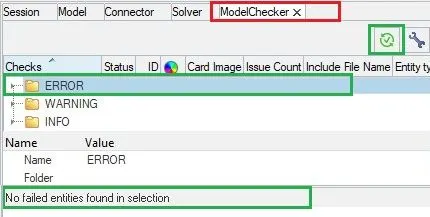
- Running a model checker to ensure good quality.
- Time-step: 0.5 to 0.1 microseconds.
- Running 80 ms.
Output requests:
- Sectional force in the cross member.
- Intrusion at B pillar, hinge pillar and fuel tank region. Providing recommendations on what can help to reduce Fuel tank intrusion.
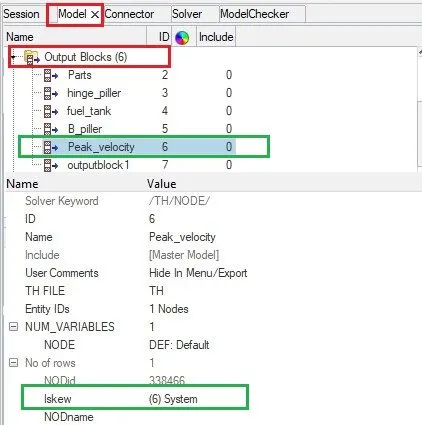
- Peak velocity of inner node of the door.
Abstract : In this project we are about to see the impact of the side body of the car when it hits to the pole, Side body is consist of two side doors with plastic body of arm rest in the windows with electric control panel one for driven and another for passenger, Here we will see that the impact on the side door,hinge, middle pillar,area near to fuel tank, section 1 and section 2 after it hit to the pole.
Objective 1 : Checking the unit system and either following [Mg mm s] or [Kg mm ms].
STEP 1 : Open the starter file neon_side_reduced_000.rad file, go to
Menu bar>file>import>solver desk>select .rad file>import
STEP 2 : Checking unit system of the model
Model browser>cards>begin card
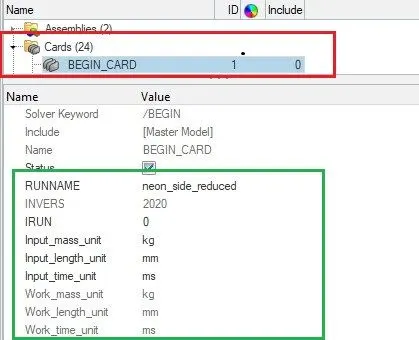
Objective 2 : Creating appropriate interface, friction 0.2 and recommended parameters.
Model browser>groups>create group>
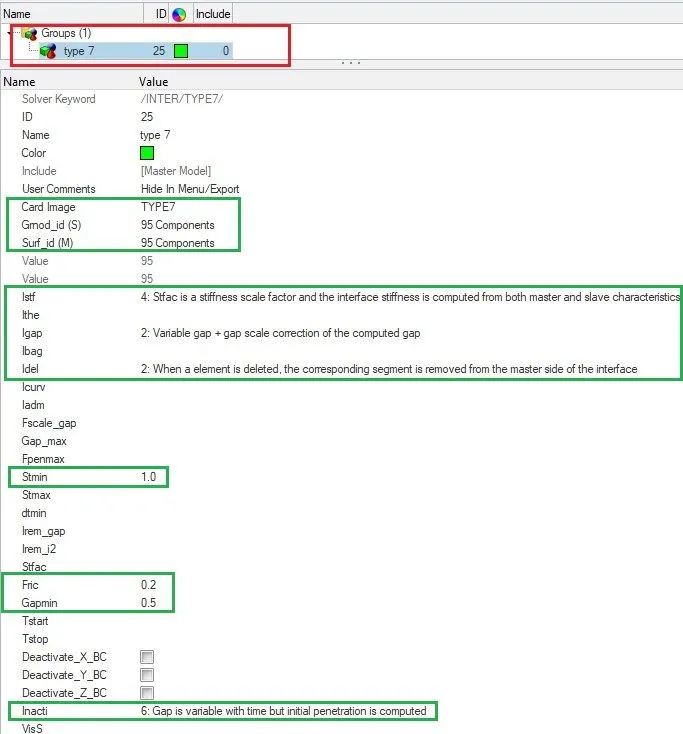
Objective 3 : There should be no penetrations and intersections
Menubar>penetration check>select group>check
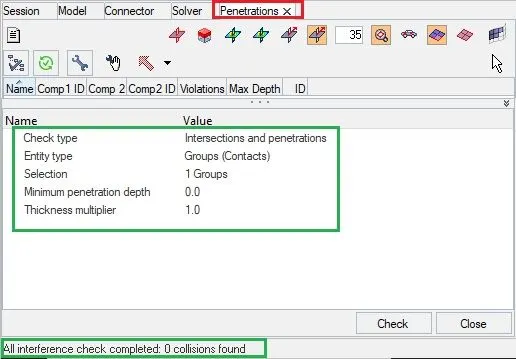
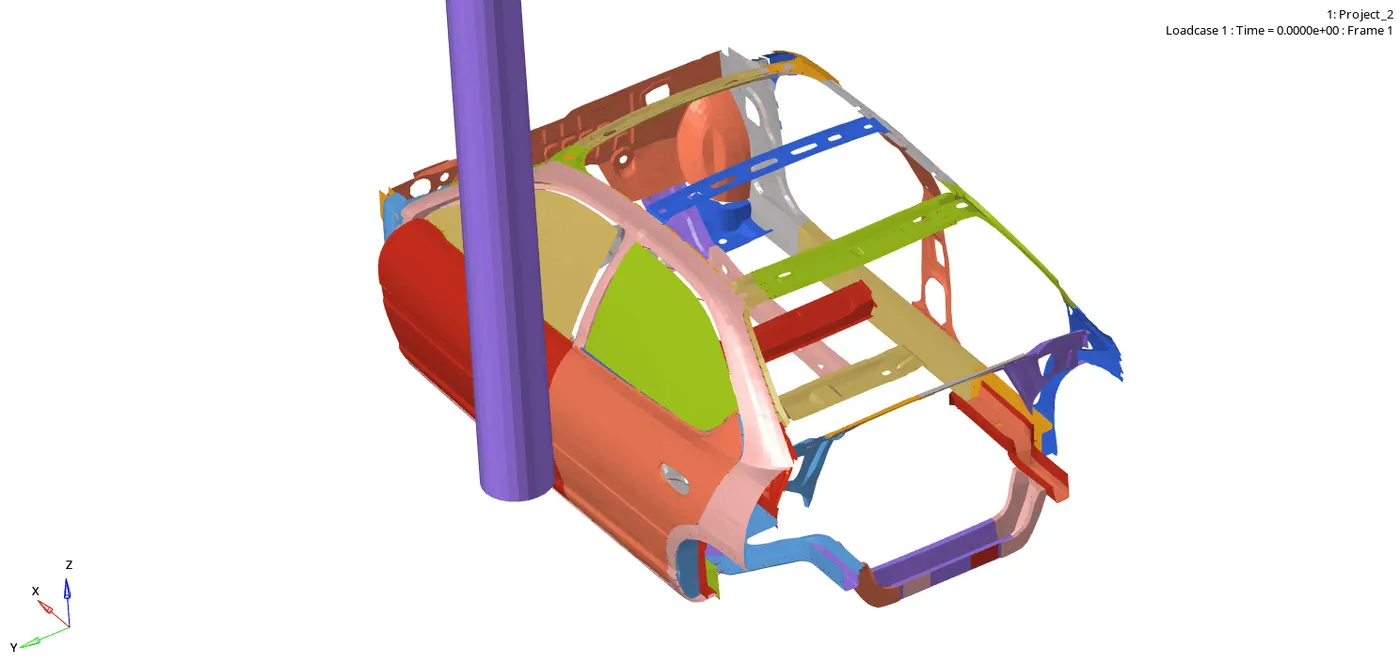
Objective 4 : Creating a rigid Pole with friction 0.1.
STEP 1: creating Rwall go to
solver model>create>rwall>CYL
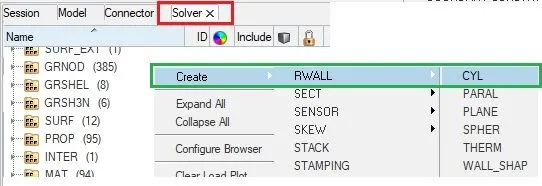
STEP 2 : Rwall CYL parameters and friction
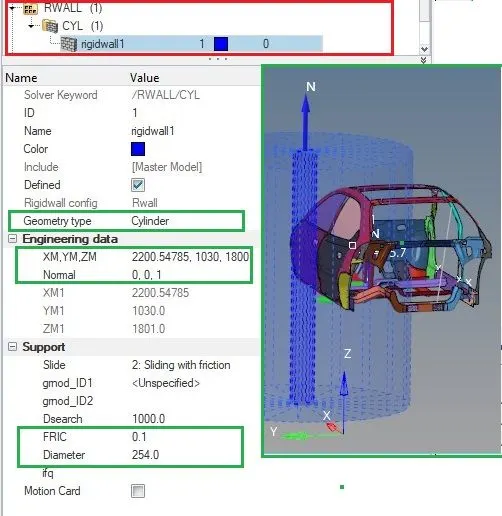
- We can see that the Rwall Collector has formed automatically in the Model Browser with all parameters given by us.
Objective 5 : Adding masses to reach target weight 700kg while getting CG about the required range.
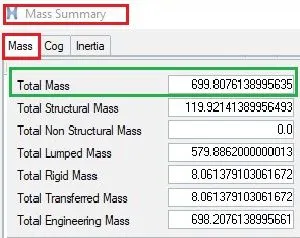
STEP 1 : Opening mass summary
Menu bar>tools>mass details>mass,cog,inertia.
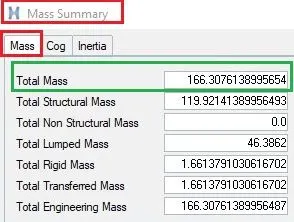
- We can see that the mass is less as it should be around 700 kg.
STEP 2 : Adding mass to increase overall weight of the car
Solver browser>ADMAS>create>extra mass>give GRNODE ID>select nodes>give mass value
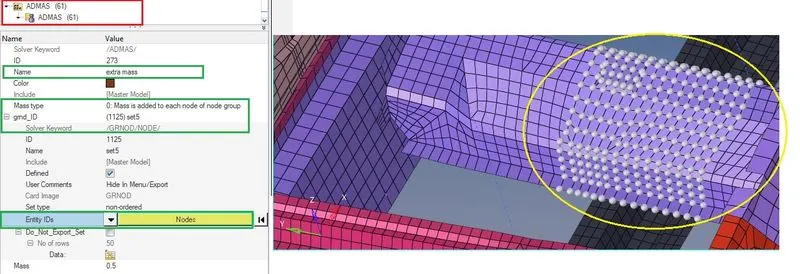
- Now again check the mass summary as shown in step 1 to check if the mass of the car increased or not as per our requirement. If not, again add a few masses at some nodes as done in step 2.
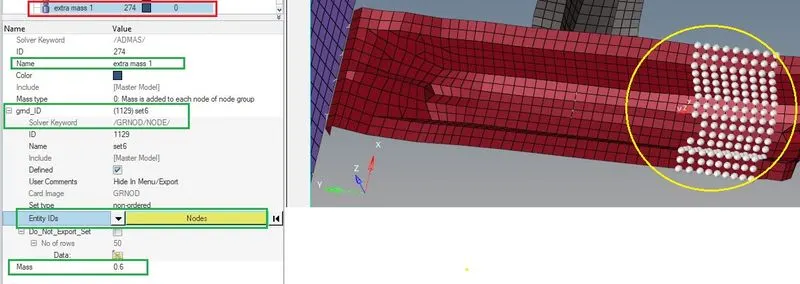
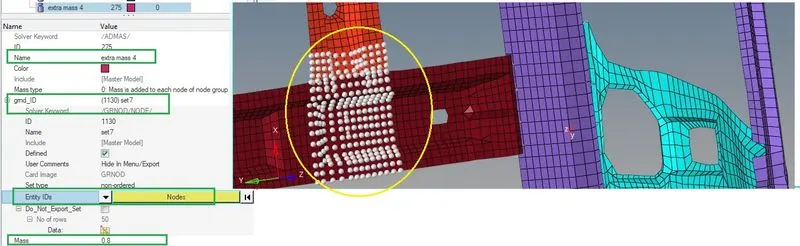
- At final we can see that mass is reached around 700 kg
STEP 5 : Checking CoG
Menu bar>tools>mass details>mass,cog,inertia>cog
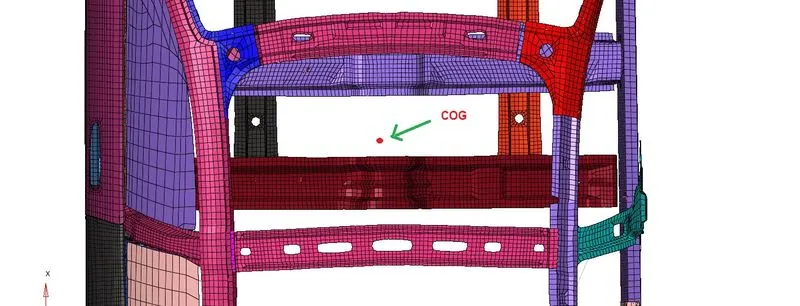
- Initial COG
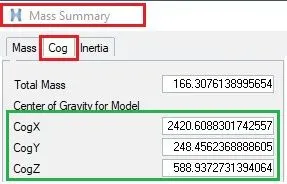
- Final COG after adding mass
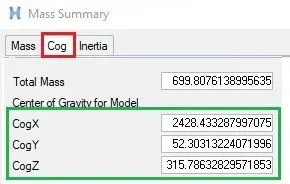
- Here we got the coordinate number where the CoG lies.
Objective 6 : Adding Initial velocity 35 mph.
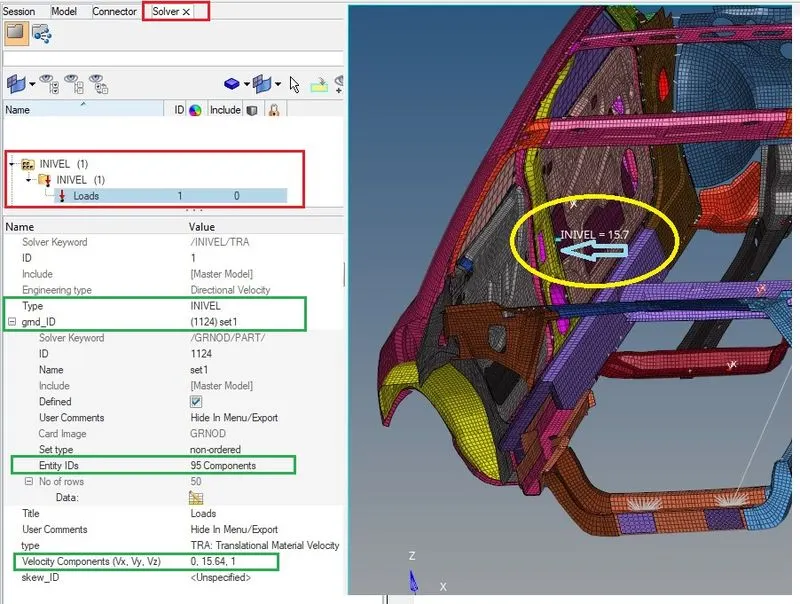
STEP 1 : Creating card
Solver browser>create>boundary condition>INIVEL
STEP 2 : Set GRNODE
Solver browser>GRNODE>create>GRNODE>node>selcect nodes
STEP 3 : Setting up INVEL Parameters
1 mile = 1.609mm
1 hour = 3.6ms
Vo = (35*1.609*10^6) / (3.6*10^6)
Vo = 15.64 mm / ms
- We can see that the INIVEL is added to the model.
Objective 7 : Running a model checker to ensure good quality.

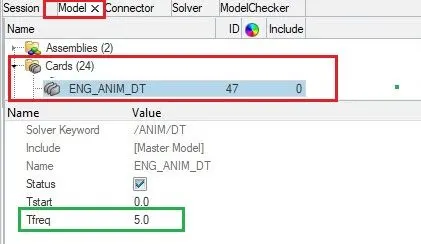
Objective 8 : Time-step: 0.5 to 0.1 microseconds.
Model browser>cards>eng_anim_dt>Tfreq=5.0
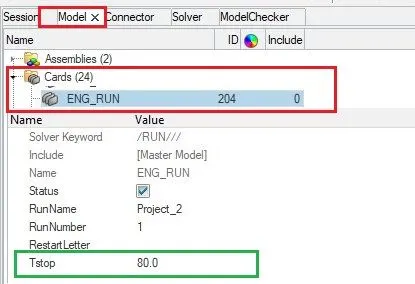
Objective 9 : Running 80 ms.
Model browser>cards>eng_run>Tstop=80.0
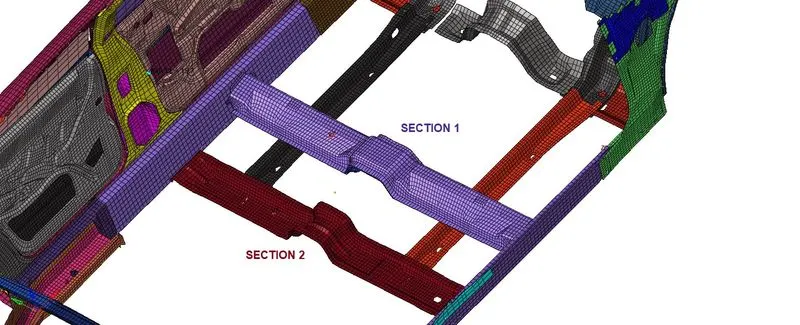
Objective 10 : Sectional force in the cross members.
STEP 1 : Creating FRAME card in solver browser.
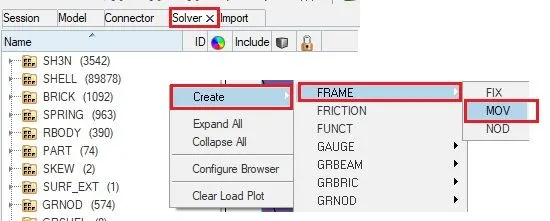
STEP 2 : Giving Parameters to FRAME>MOV
Solver browser>FRAME>MOV>give origin,axis,plane node.

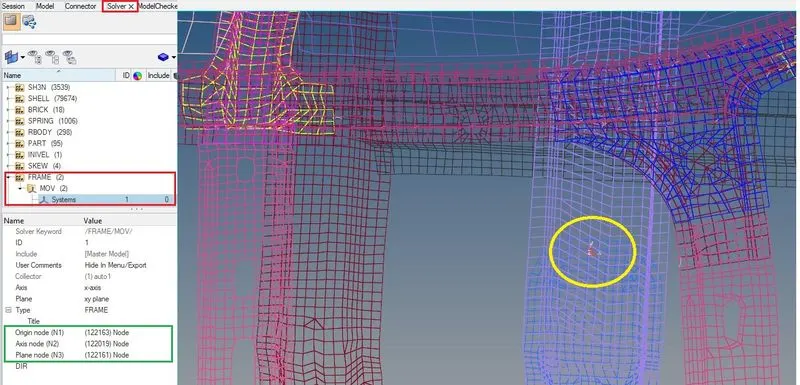
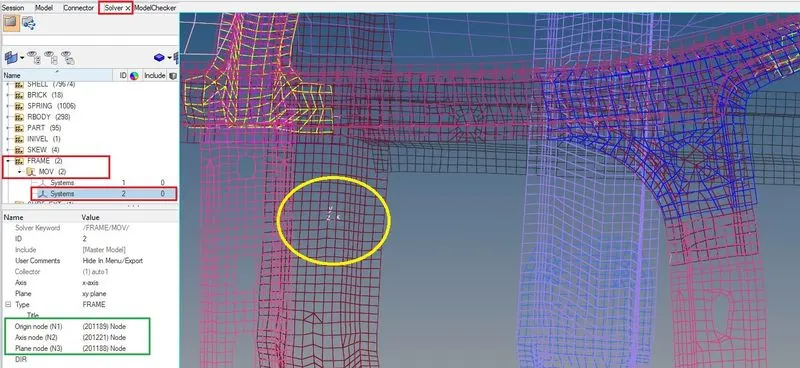
STEP 3 : Creating SECT card in solver browser.
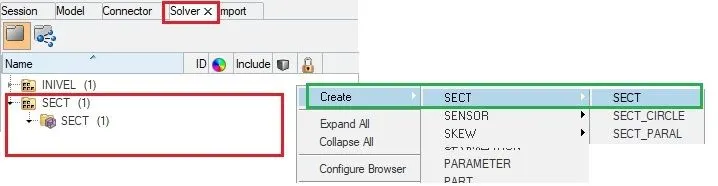
STEP 4 : Giving parameters with GRSHEL elements selections to Components
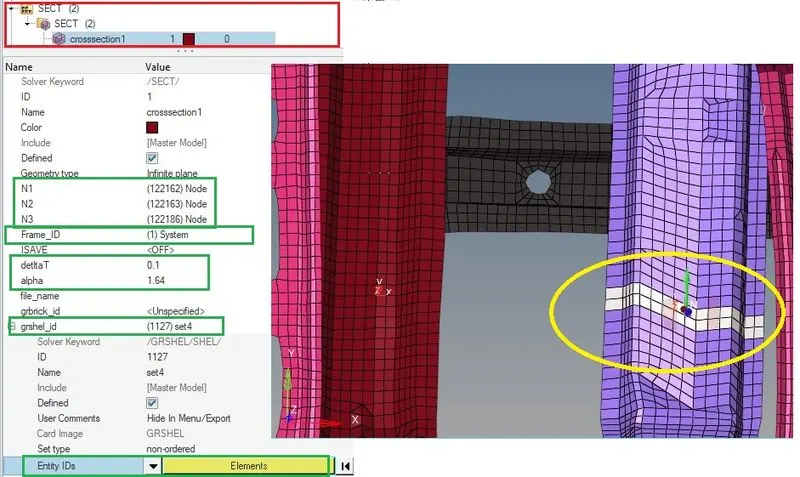
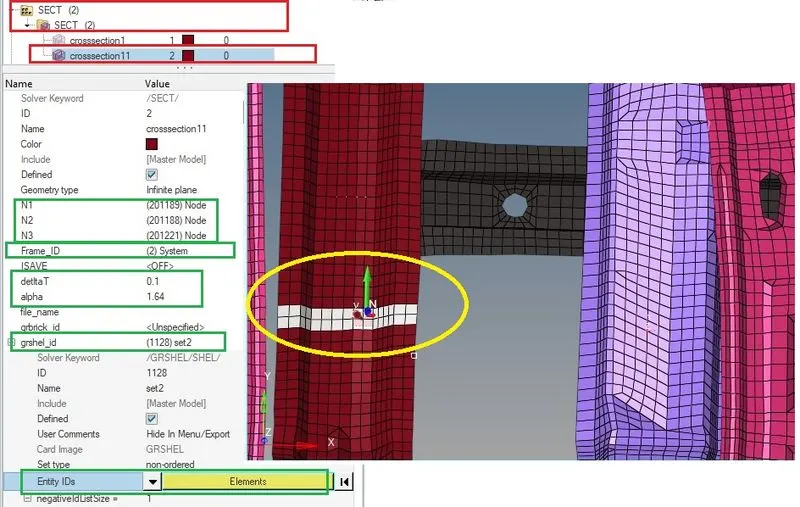
STEP 7 : Giving Output Request in Model Browser.
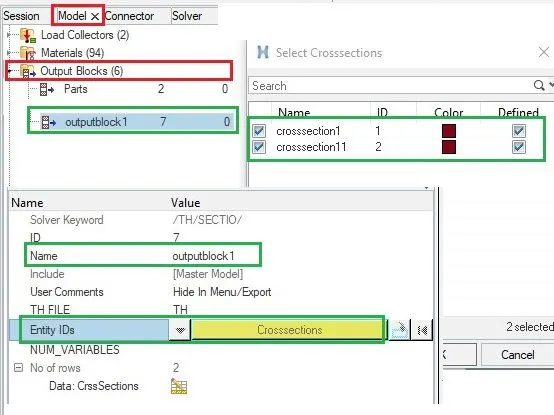
Objective 11 : Intrusion at Fuel tank region, B pillar and Hinge pillar.
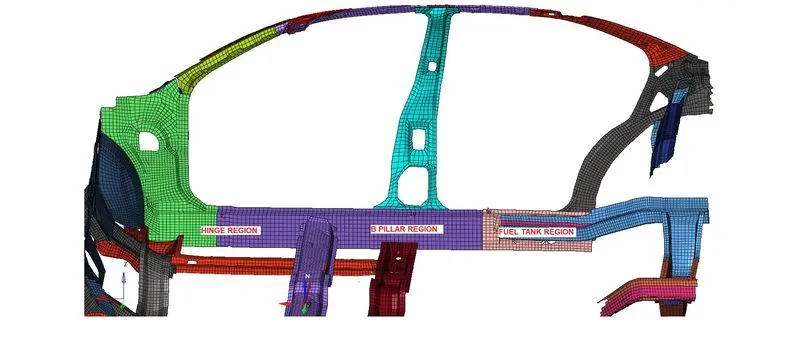
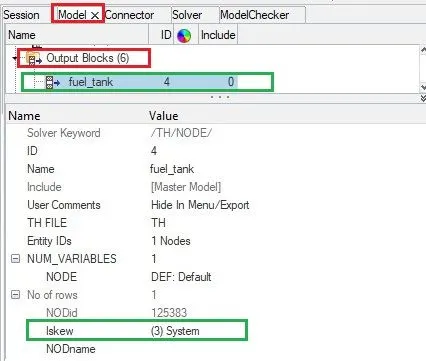
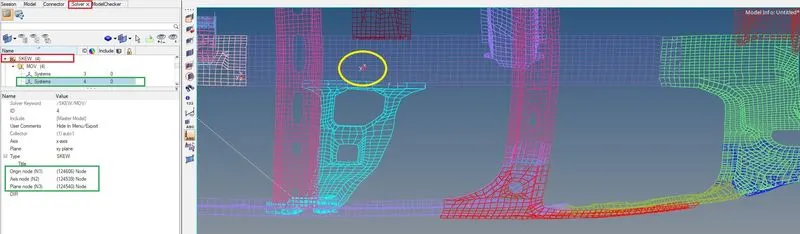
Fuel Tank Region
STEP 1 : Creating a new local coordinate in SKEW collector of solver browser and giving origin,axis and plane nodes.
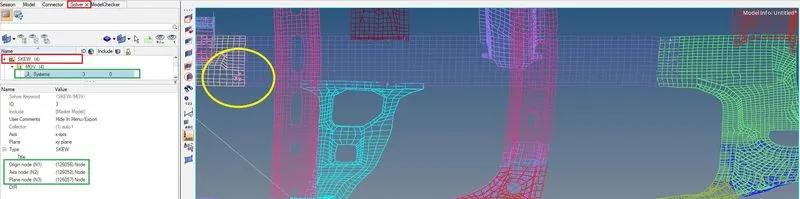
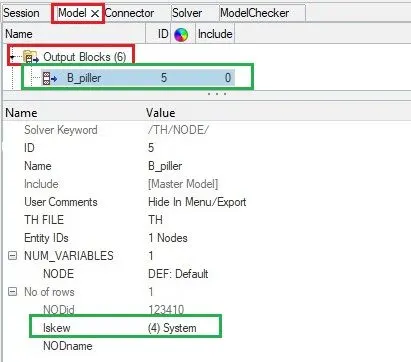
STEP 2 : Giving Output Request in Model Browser.
B Pillar
STEP 3 : Creating a new local coordinate in SKEW collector of solver browser and giving origin,axis and plane nodes.
STEP 4 : Giving Output Request in Model Browser.
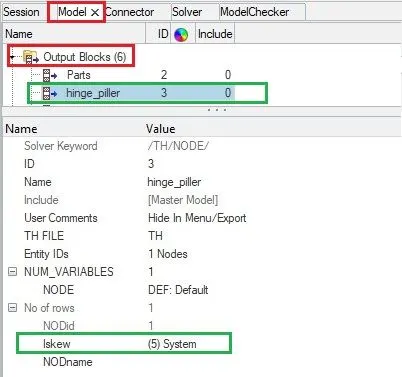
Hinge
STEP 5 : Creating a new local coordinate in SKEW collector of solver browser and giving origin,axis and plane nodes.
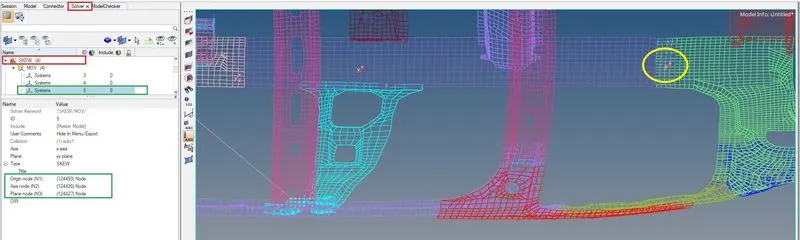
STEP 6 : Giving Output Request in Model Browser.
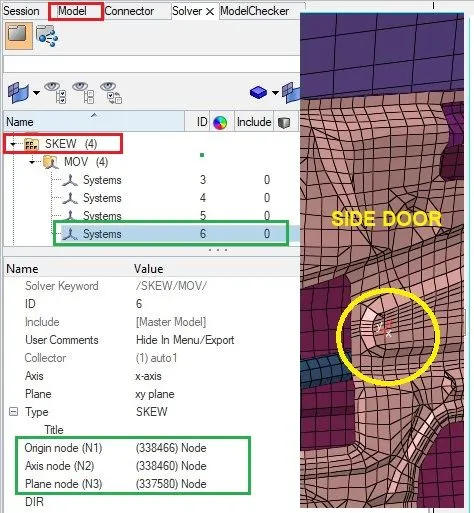
Objective 12 : Peak velocity of inner node of the door.
STEP 1 : Creating a new local coordinate in SKEW collector of solver browser and giving origin,axis and plane nodes.
STEP 2 : Giving Output Request in Model Browser.
SIMULATION OF THE FRONTAL CRASH : Simulating and analysing the car's side portion crash.
STEP 1 : Open Hyperworks in Radioss solver.
STEP 2 : Import Solver desk Project_2_0000.rad file
STEP 3 : Simulating model as it is.
Analysis>Radioss>save as input Project_2_0000.rad file>Checkbox include collectors>Write (-nt 4) in options>Click Radioss
STEP 4 : Switch to Hyper view
STEP 5 : Select local model and result Project_2h3d file
RESULTS AFTER CRASH :
To plot the graph we need to switch to Hypergraph,
Toolbar>select application to Hypergraph 2D>select runnameT01 type file
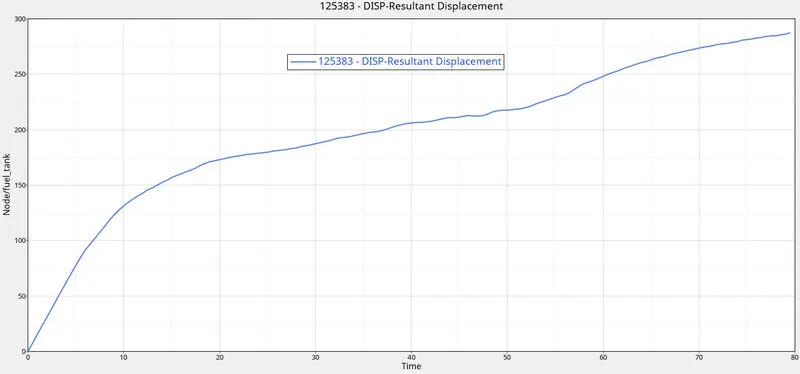
- Fuel Tank
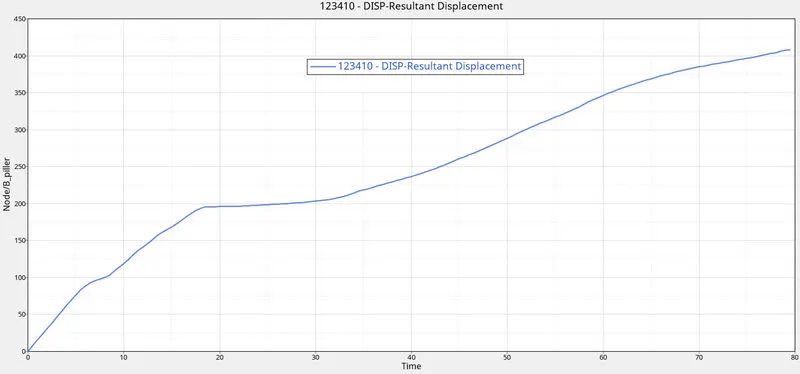
- B Pillar
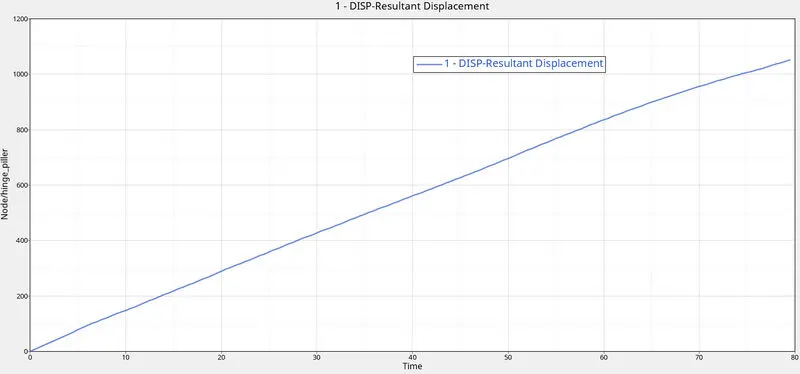
- Hinge
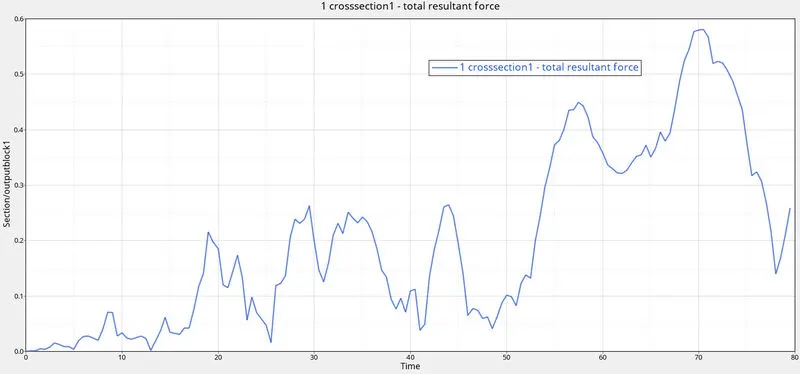
- Cross Section 1
- Cross Section 2
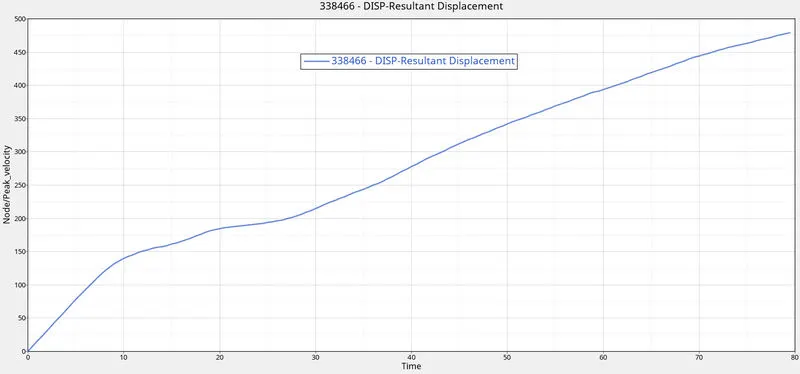
- Peak Velocity in the inner of the door.
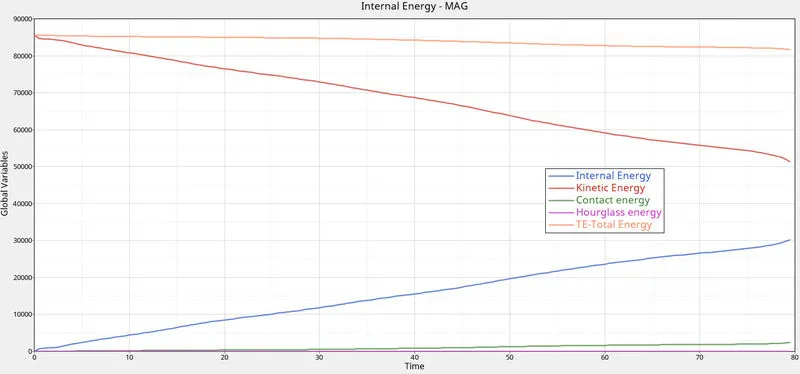
- Energy Graph
- Number of cycles it takes, energy error, mass error and simulation time.
The output file shows us the number of cycle, energy error, mass error
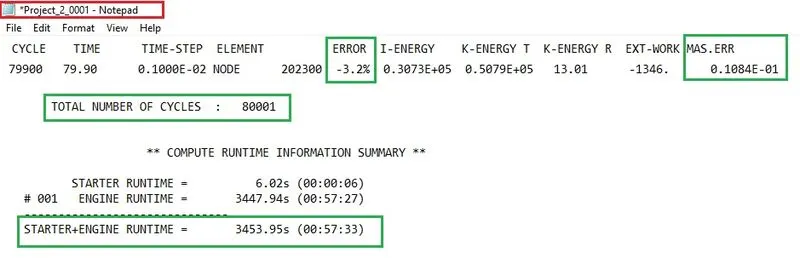
| Number of cycles | 80001 |
| Energy error | -3.2 % |
| Mass error | 1.084 % |
| Simulation time | 3453.95 s (00:57:33) |
OBSERVATIONS AFTER CRASH :
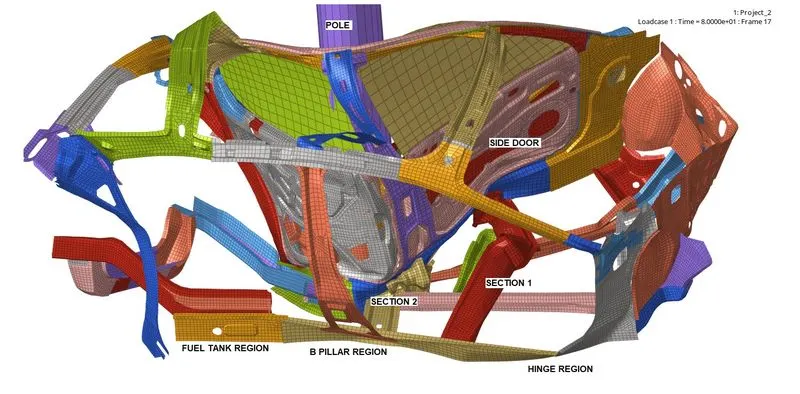
- We saw in the animation that the most deformation took place in the middle pillar area and the stress is then passed to the side of the rest of the components.
- We observed that the impact of the crash is mostly at the middle pillar side door of the car and by looking at this we can say that the seating area of the driver and passenger will be also impacted which can cause severe injury to them.
- The energy graph is shown of Internal energy, Kinetic energy, Contact energy, Hourglass energy and Total energy Vs Time.
- We can see that Internal energy increases with respect to time whereas Internal energy starts falling down from its peak as time increases.
- Contact energy and hourglass energy graphs have values near to zero and Total energy remains almost constant as time increases.
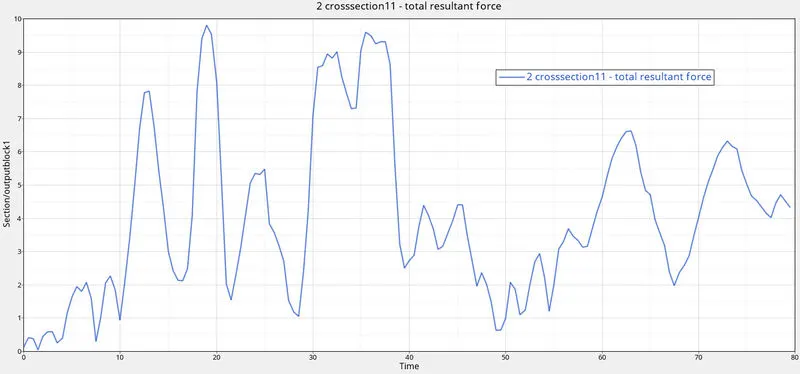
- Graph for section
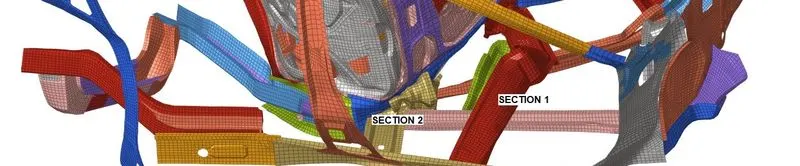
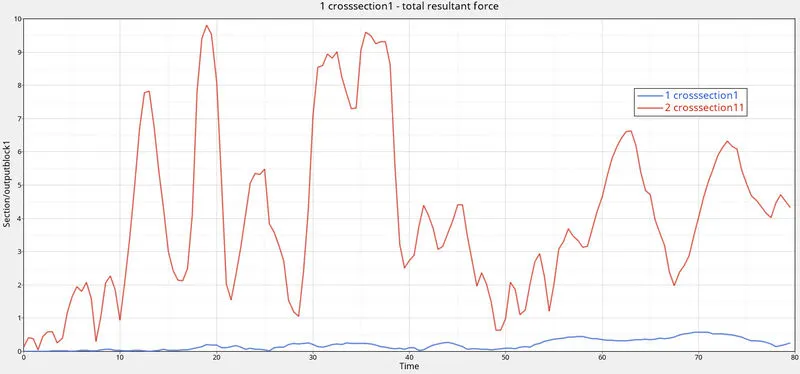
We can see that the total resultant force in the section which was right below the Middle B_Pillar (cross section 2) has gone into more deformation value near to 10 after the side body get hit with pole whereas the section which is far from middle pillar (cross section 1) has gone very less deformation as compare to section 2 with value near near to 0.6
- Intrusion Graph for hinge(1), Fuel tank (125383) and B_Pillar (123410)
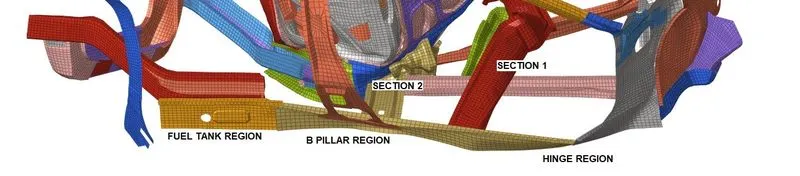
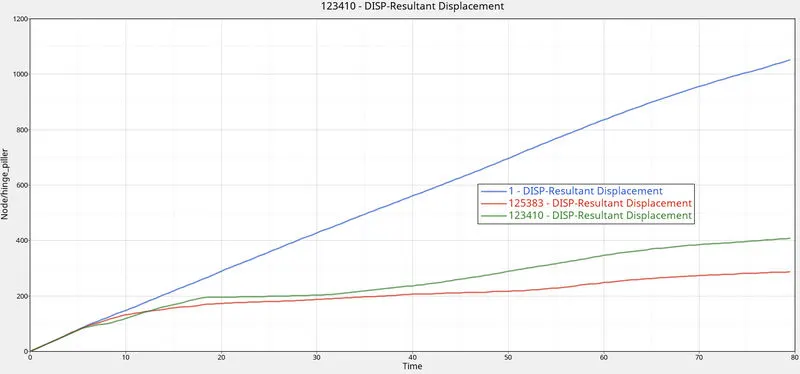
We can see in the figure that hinge region has more deformation as compared to B pillar and fuel tank region that is why resultant displacement of hinge is linearly increasing with respect to time. Then the B pillar has more deformation as compared to the fuel tank region and fuel tank has less resultant displacement.
- Peak Velocity in the inner side door :
The resultant displacement of peak velocity keeps on increasing to value around 475 with respect to time 80 s. It shows that the region at and near to the node placed for peak velocity goes on continuous deformation as the time increases.
Animation files of Simulation :
- To view the simulation animation we need to open .h3d in input specified folder or switch HyperView and open the model.
- Then the contour is applied which makes the model in colours of maximum and minmum stress induced.
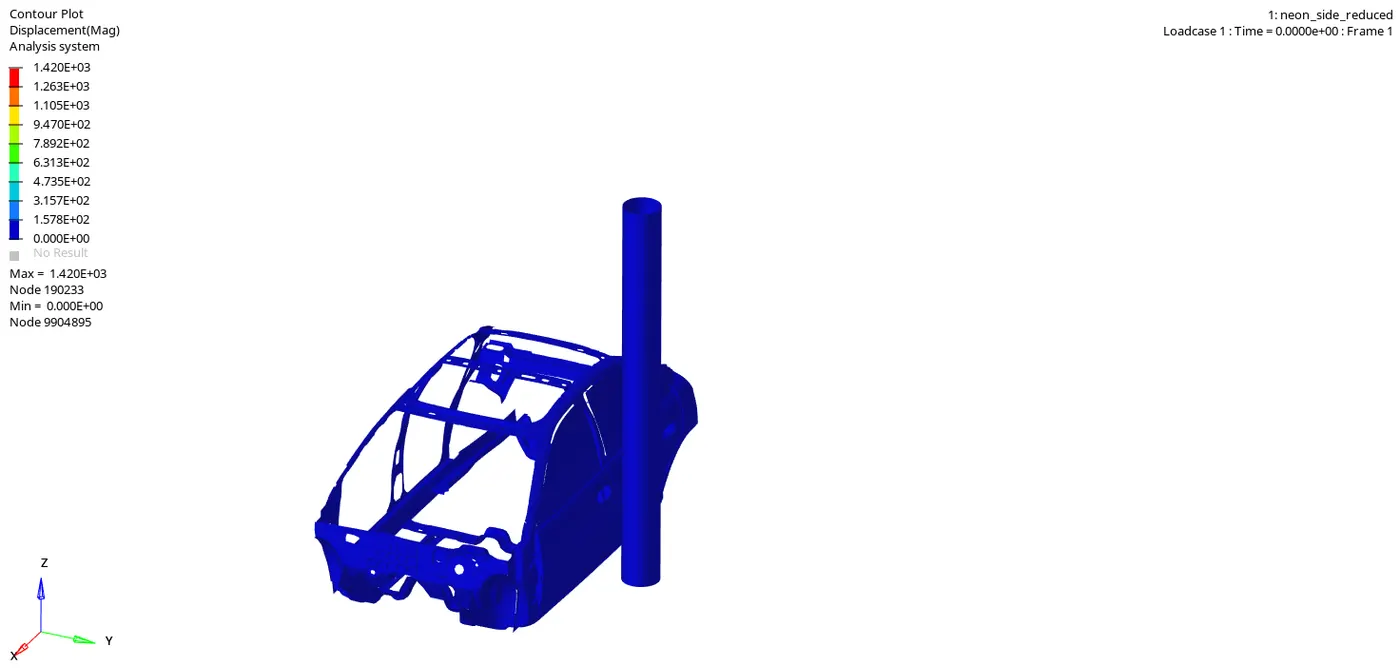
Animation of Displacement:
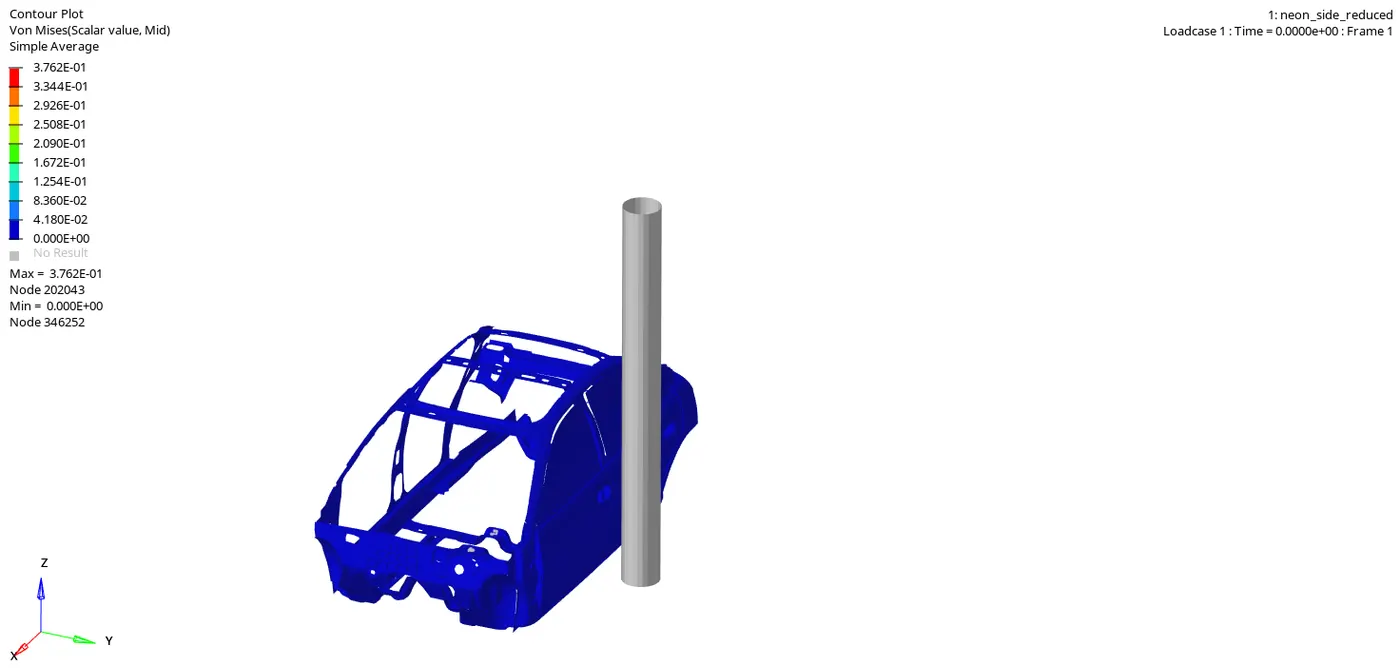
Animation of Von misses stress induced :
- From the animation we can state that initially doorstep starts crushing then the forces are transferred to the B pillar then from there these forces are transferred to outer rail, side imapct beam , cross beam.
- From the von misses plot we can say that the stress distribution is quite good in the vehicle even after the crash. There are very areas where we can see stress concentration.
Generating the Plots :
Graphs for Global variable energies :
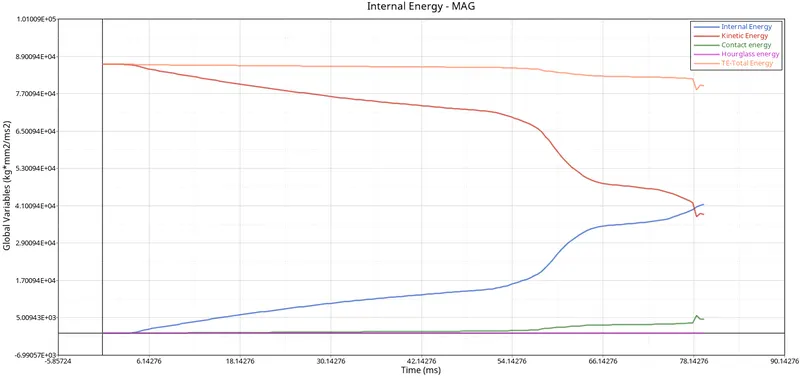
- The changes in kinetic and internal energies occur at the exactly when BIW body comes in contact the rigid wall. At the same time, it absorbs the forces and this results in an increase in internal energies andas a reslut the deformations occur. Thus the total energy in the system is almost constant to 86000J and due to some energy loss we an see in energy error, there is some decrease in total energy.
Conatact energy graph:
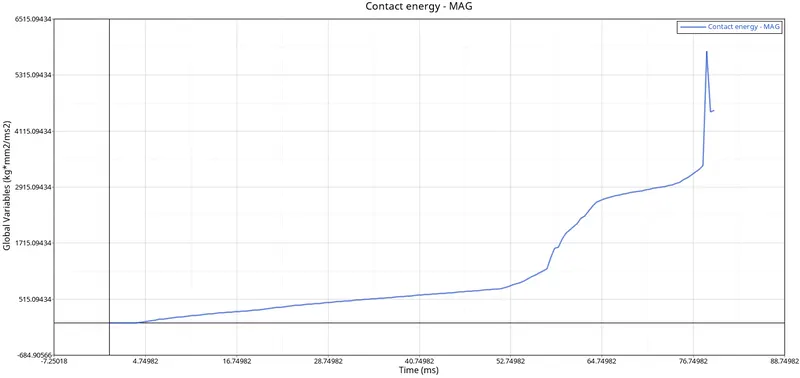
- Contact energy is a type of energy that is formed when one element meets the other or neighboring elements. The opposing force created by this element forms the contact energy.
- The increase in contact energy affects the overall energy of this system, which is why there is a decrease in total energy over the period of simulation.
Output requests :
Sectional forces on cross bars :
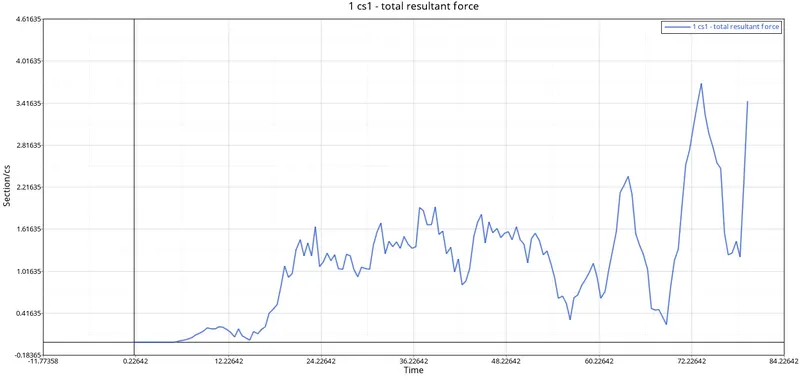
- During the side impact the vehicle is going to impact the cylindrical rigid walls. At the time of impact, this vehicle will have some kinetic energy possessed and the rigid wall will try to oppose direction of kinetic energy. So while impacting the rigid wall the kinetic energy of the vehicle will be reduced in the vehicle component.
Intrusion springs :
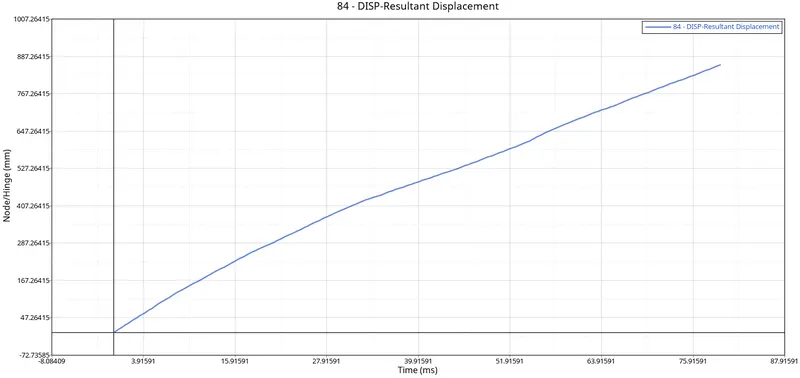
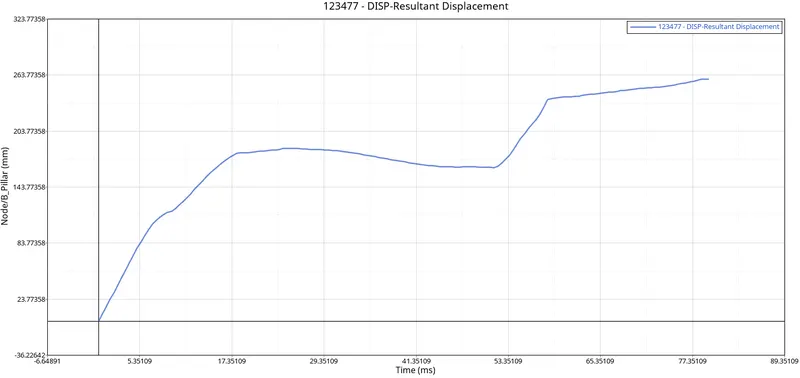
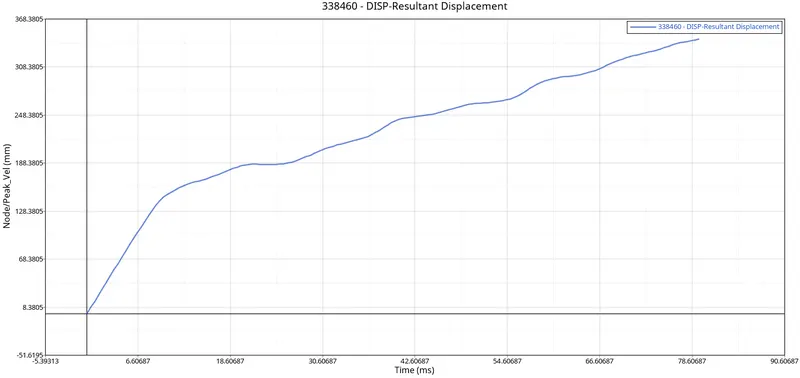
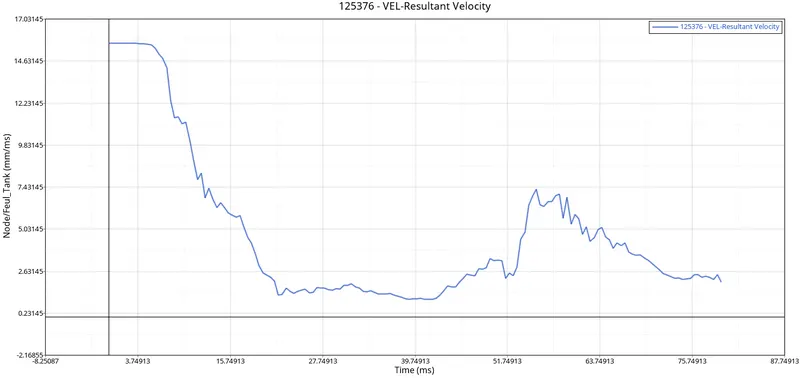
- Here by the above graphs we can see that the intrusion is recorded in the mm/ms at 8.5ms. The form of displacement.
- As there are no other components in the middle section of the vehicle like the absence of engine,radiator, seats and other assemeblies are there with very huge deformation.
- The max displacement recorded in 3 nodes is displayed in the above graphs.
What can help to reduce Fuel tank intrusion ?
- To counterbalance this intrusion we can add the reinforcement structure near the fuel tank inside the door panels.Additionally we can add the cylindrical beam with higher thickness of upto-mm can be provided the additional strength to avoid the fuel tank intrusion.
- From the above graph, the peak velocity of the node on the door is about 15.9mm/ms at 8.5ms.
Learning Outcomes :
- Importane CoG and its recommended region.'
- Usage of interfaces and its values that are recommended for the project.
- Created initial velocity, intrusion, frames , sections and local co-ordiantes.
- Rectified time history cards and output blocks
- Simulation in run, animations are captured.
Conclusion:
- All the required objectives are fullfilled according to the given question.
- Side pole crash analysis was carried out on the gievn half of a BIW model of Dodge neon car as per given requirements.
- The forces are transferred through the most amount of energy.
- The cross section at B pillar is experiencing maximum forces due to the pole is placed near the B pillar.
- The maximum intrusion is at B pillar followed by area near fuel tank.
- The stiffness should be increased of the componenet near fuel tank so there will be less intrusions.