Assignment 6-Frontal Crash Simulation Challenge
AIM: To perform the Frontal crash analysis of the given Body In White (BIW) component and calculate the cross-sectional forces of the A-pillars, shotguns and rails, accelerometer plots for B-pillars and intrusions in the cabin for nodes
PROCEDURE:
- First import the given RADIOSS file as solver deck and the check the unit system. If it is Kg-mm-ms, then no need to change otherwise change the unit system in the BEGIN_CARD.
- Next step is to check if any penetrations taking place. This option is available in Tools-->Penetration check--> select all the components.
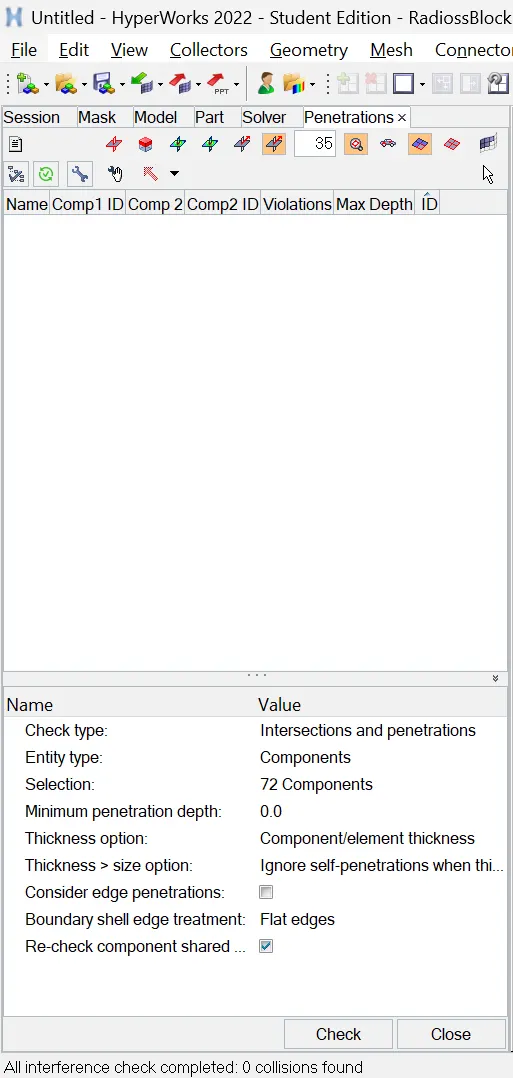
- There are no penetrations in the model.
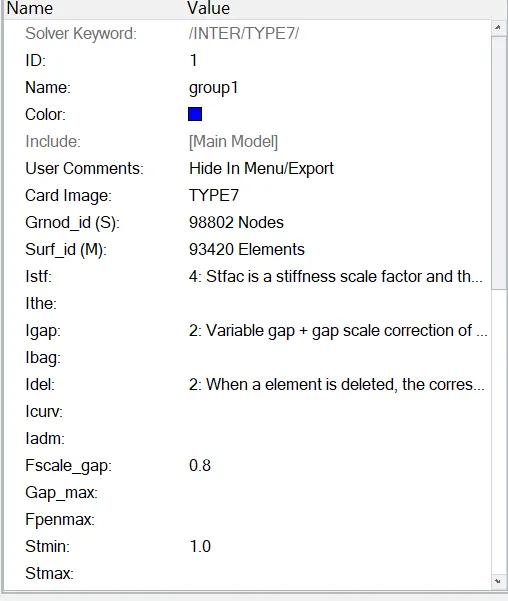
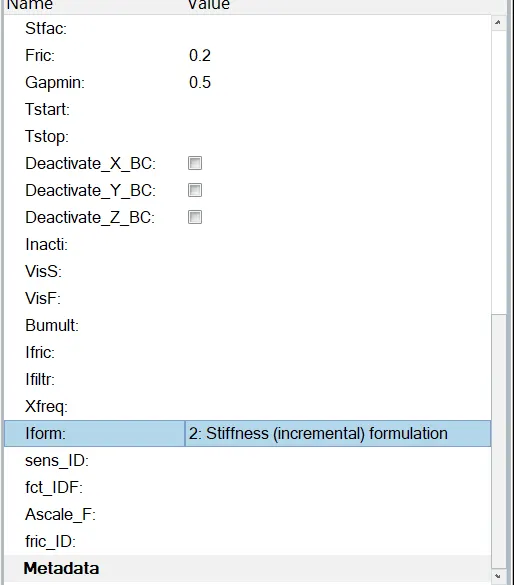
- Now check for any unused interfaces are available, If yes delete them. Later create the interfaces as it is self contacting after the impact, use TYPE 7 contact type in CREATE-->INTER-->TYPE7, Select the slave and master nodes as all the components. The required conditions for TYPE7 are given in the figure.
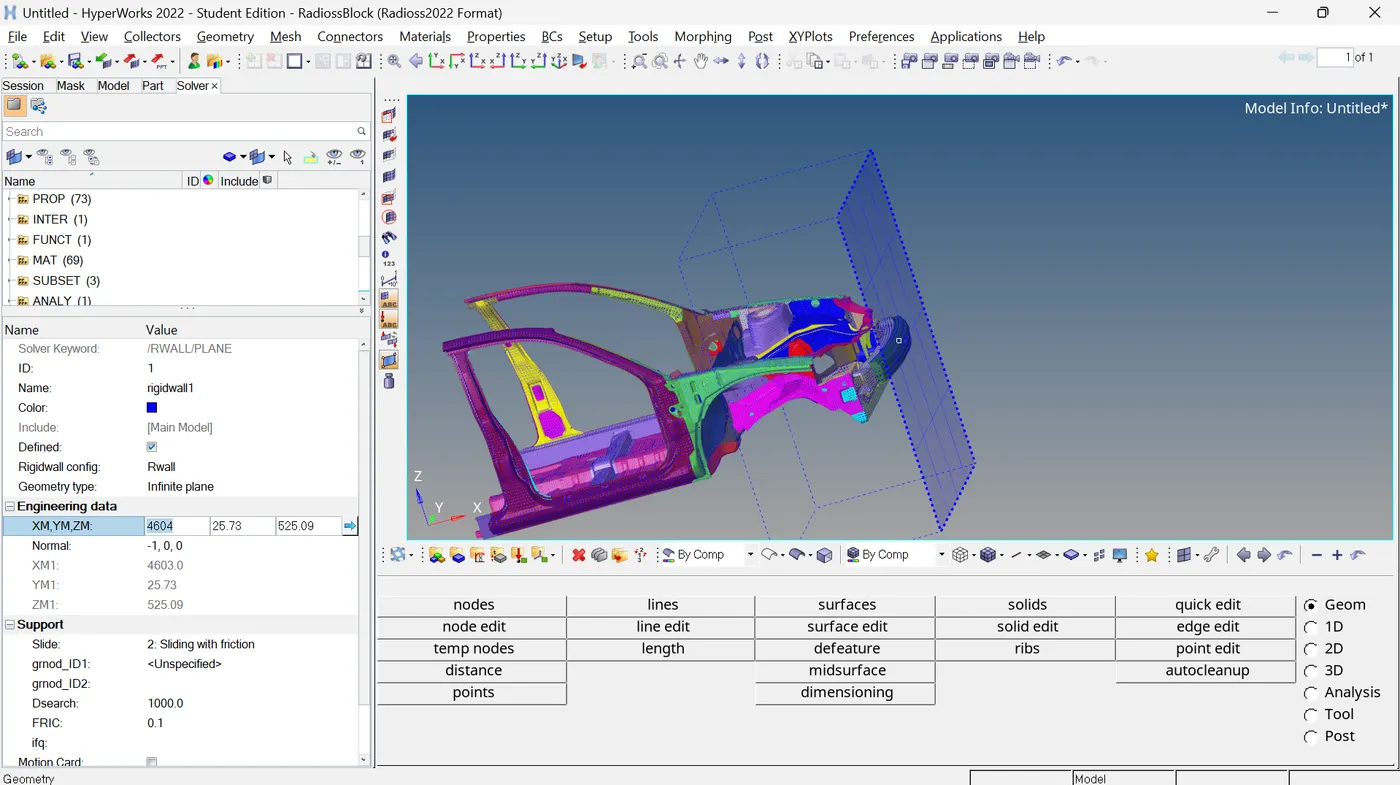
- Create the RIGIDWALL near the BUMPER at a distance of 10mm by using the CREATE-->RIGIDWALL-->PLANE and by using the temp node. The normal direction of the RIGIDWALL should be against the car velocity direction and the coefficient of friction is 0.1. The required conditions are given in the figure below,
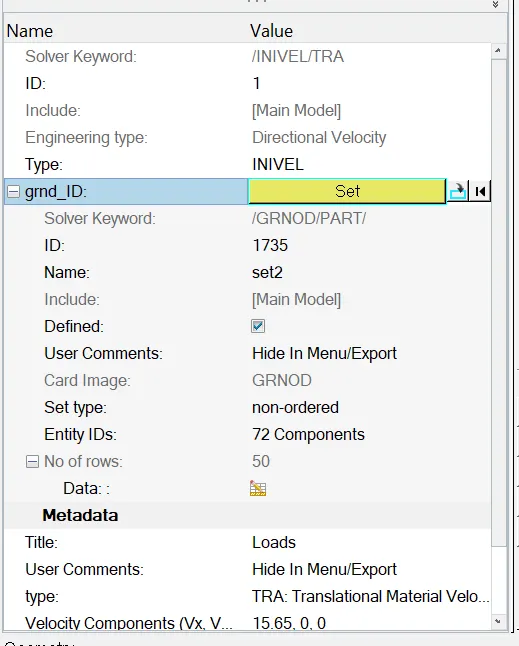
- We need to create the initial velocity as 35mph convert it in mm/ms, which is 15.64. To create the Initial velocity CREATE-->BOUNDARY CONDITIONS-->INIVEL, using the translation material velocity (TRA) in x direction as 15.64mm/ms.
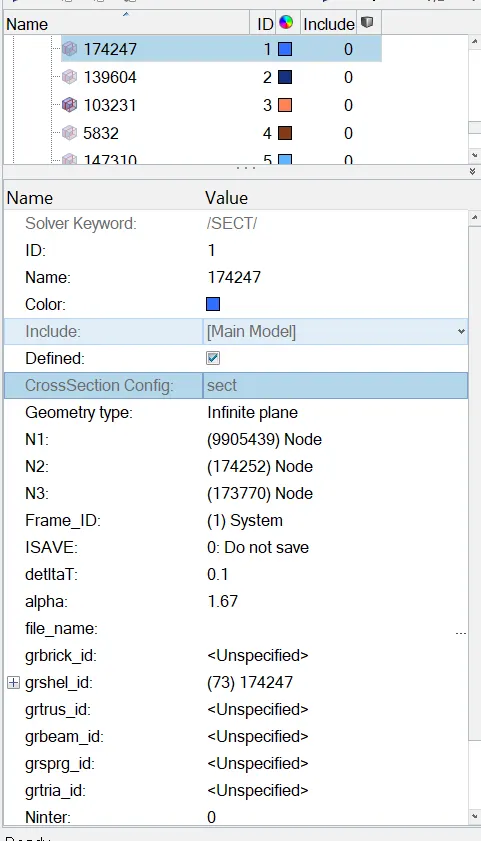
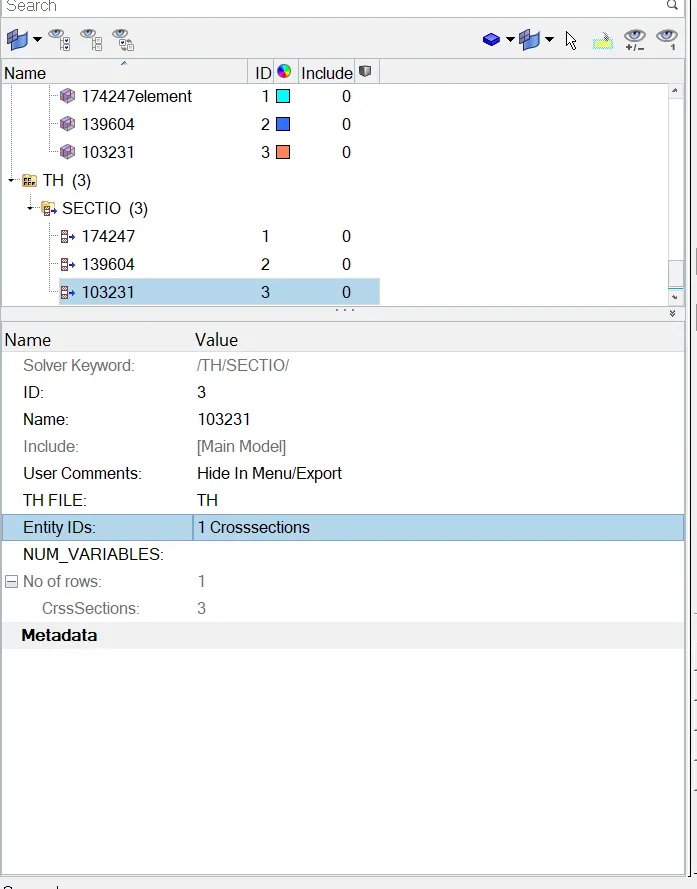
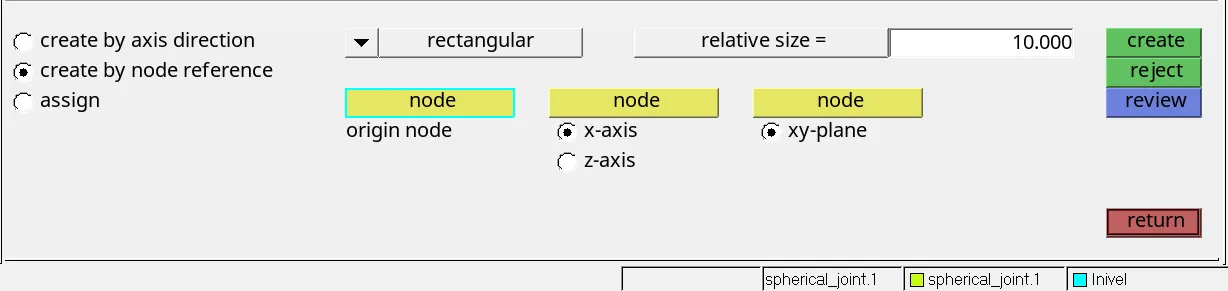
- Then we need to create the output blocks to find out the forces, accelerations, displacements etc., First, near the Rails we need to create the sections at the node 174247. To find out the node Tools--> find-->nodes by id, is selected and check the numbers box. After finding out the nodes create the temporary nodes so that the plane created should be perpendicular to the rail. Then create the frame by using the CREATE-->FRAME-->MOV and select the nodes in such a way that the z direction should be in against the reactive forces. After creating the frame the section is created by CREATE-->SECT-->SECT and give the necessary options like elements, frame, N1,N2,N3, etc., which are shown in the figure. At last create the time history data to store the date by using the CREATE-->TH-->SECT.
- Now the acceleration plots are plotted by creating the temp nodes at B-pillar left and right. To create the acceleration plot navigate to CREATE-->TH-->ACCEL and select the nodes and put the Fcut as 1.67.
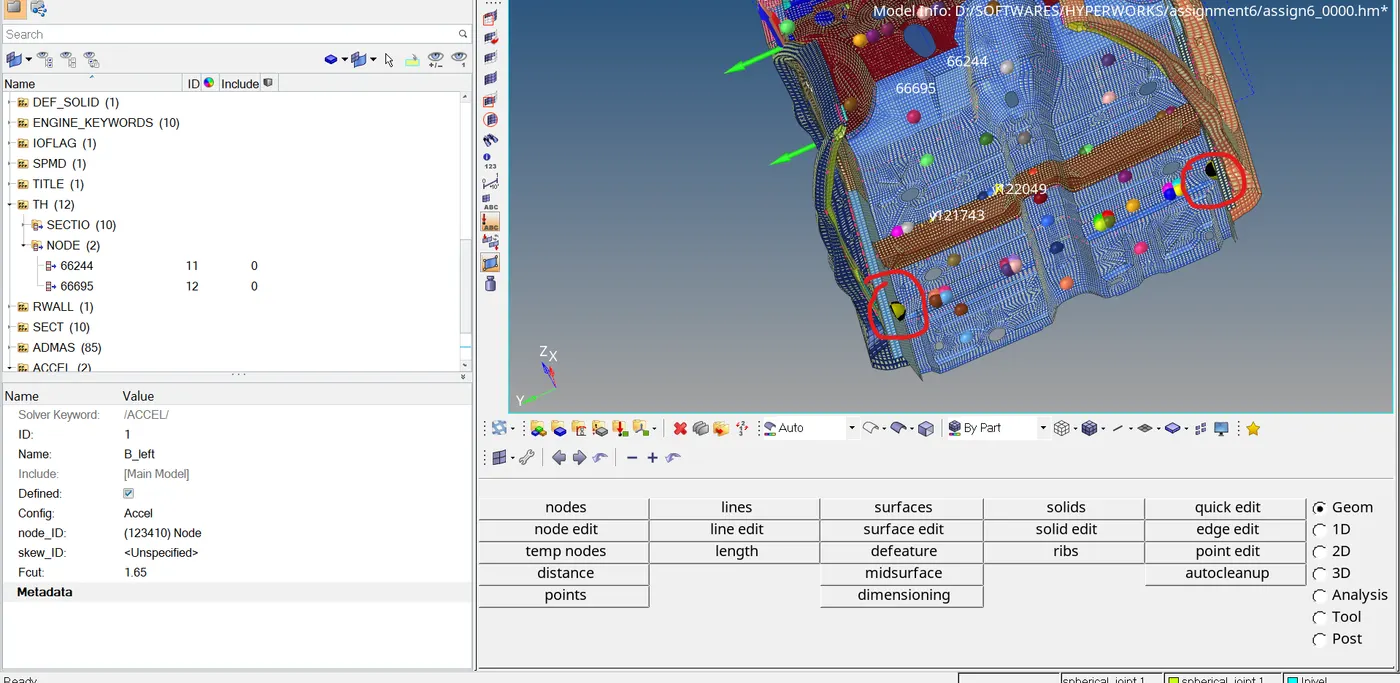
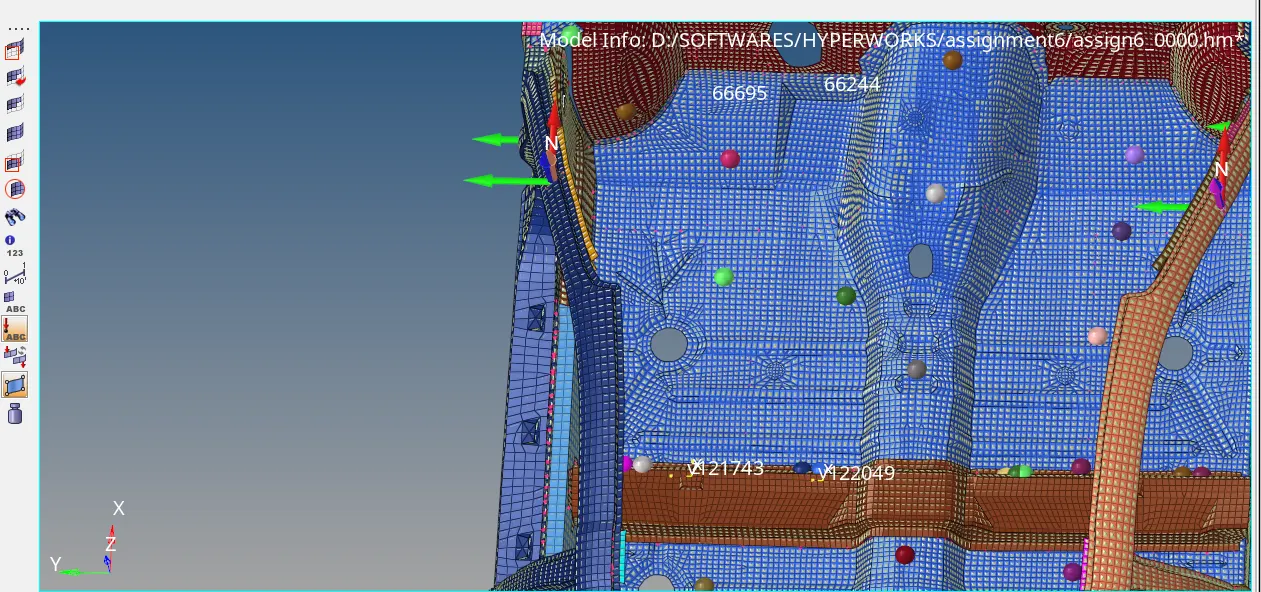
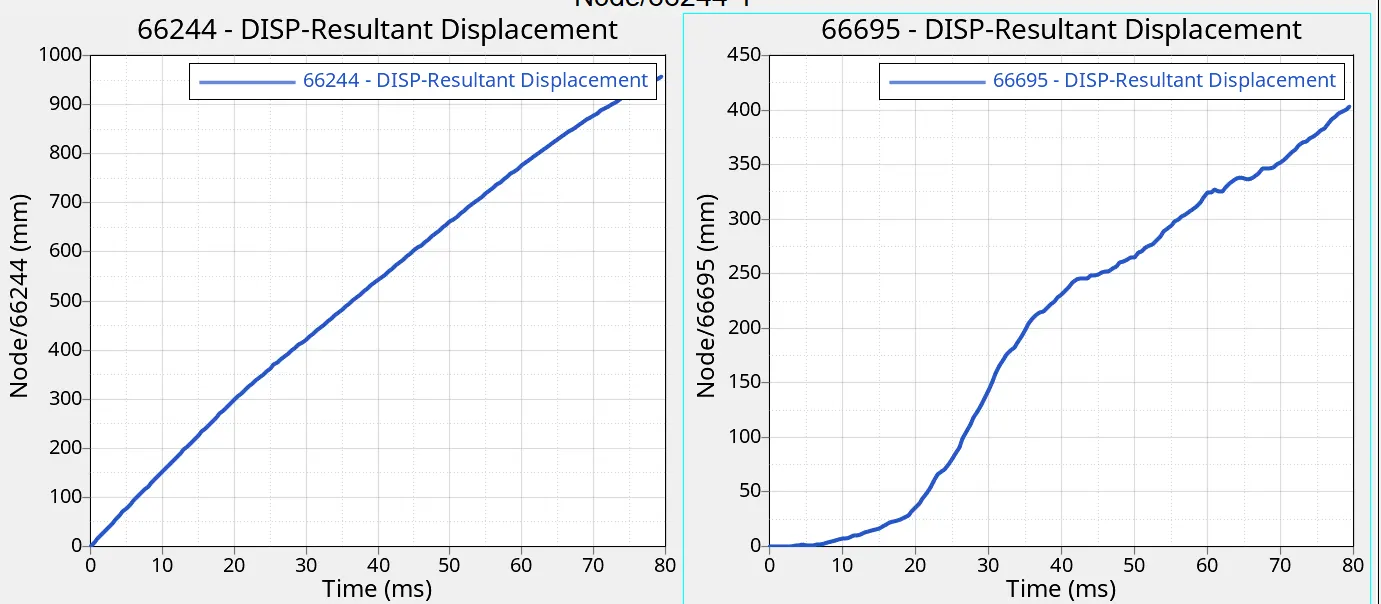
- To calculate the cabin intrusions two frames are created inline with the nodes 66244, 66695. Then give the time history plot to calculate the displacement for all the 4 nodes and calculate the relative displacement.
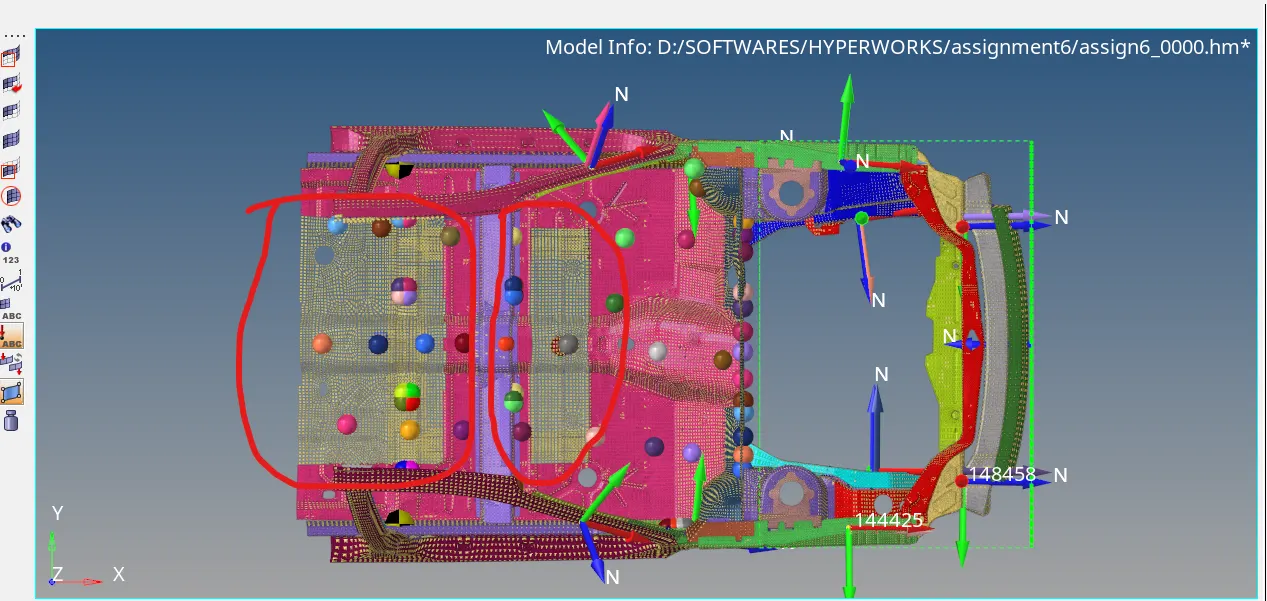
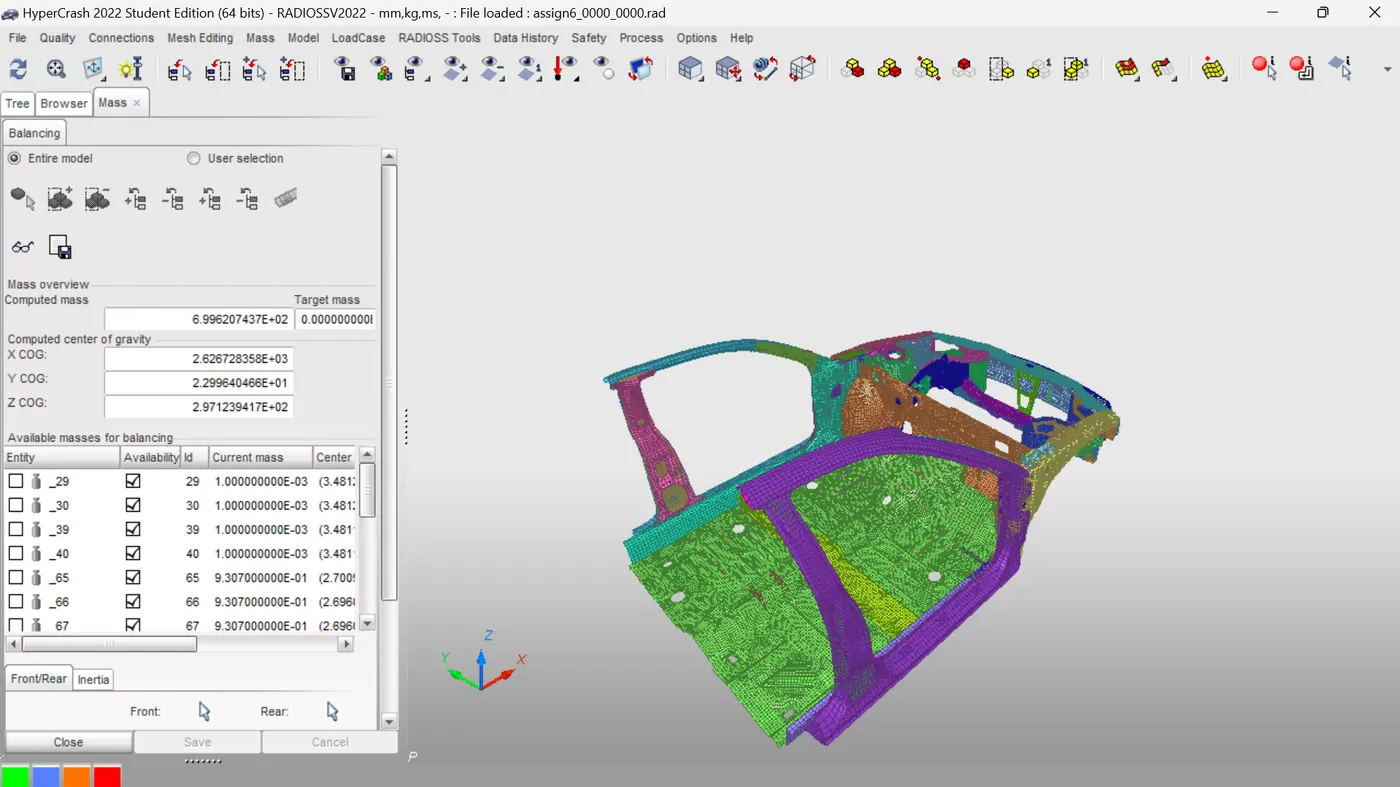
- After creating all the required conditions and time history plots the mass of the given BIW is checked in the HYPERCRASH module (HYPERMESH toolbar Applications-->HYPERCRASH) open HYPERCRASH and set the unit system to Kg-mm-ms. Open Mass menu--> Balancing in the HYPERCRASH then check the mass. The mass of the whole chassis should be 700Kgs, so create the masses at the bottom nodes of chassis as shown in figure and make sure that CG should be as low as possible.
- After doing the mass balancing the total time should be kept as 80ms which is given in the challenge. This time is set in ENG_RUN card select the engine file. Create the ENG_DT for time step to be used as given in the challenge as 0.1 microsecond. After setting all these go to MODEL CHECKER for checking any errors in the file. If any errors are generated then solve those and run the file.
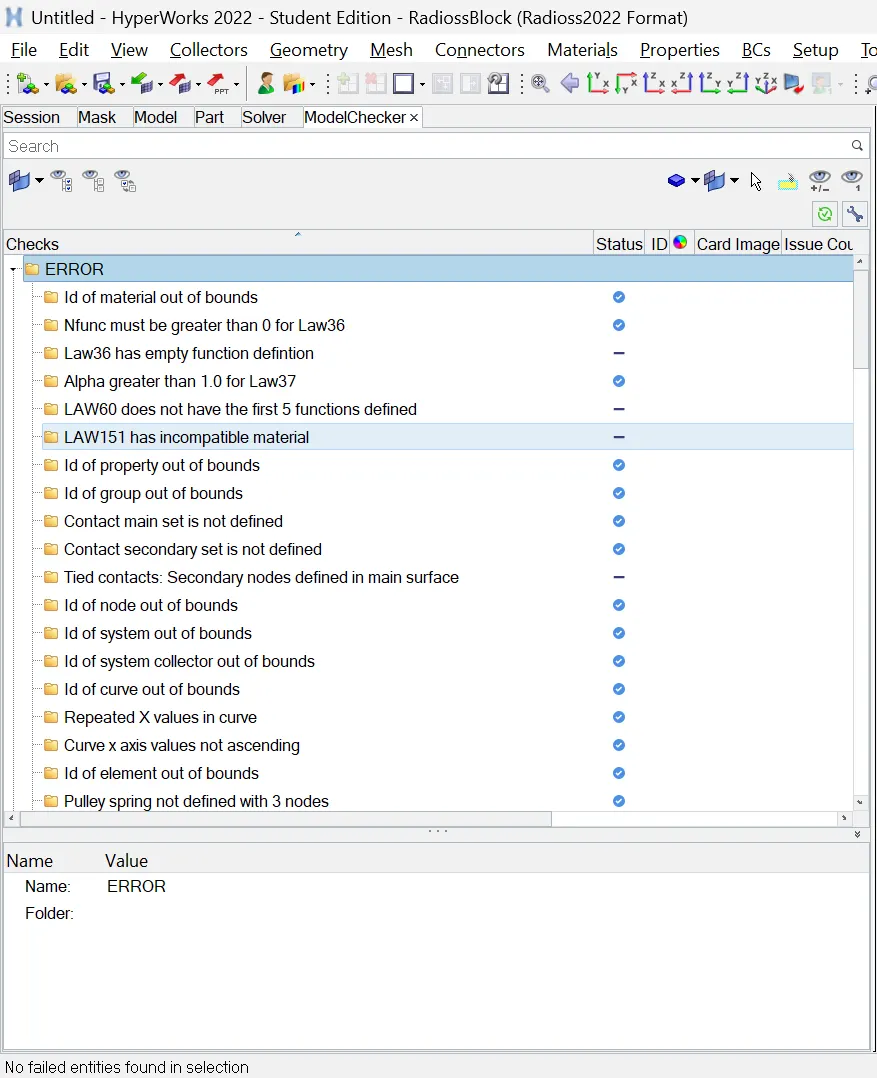
- No errors are found in the file. After model-checking navigate to ANALYSIS-->RADIOSS and select the number of processors as 4 and RUN the file.
RESULTS AND DISCUSSION:
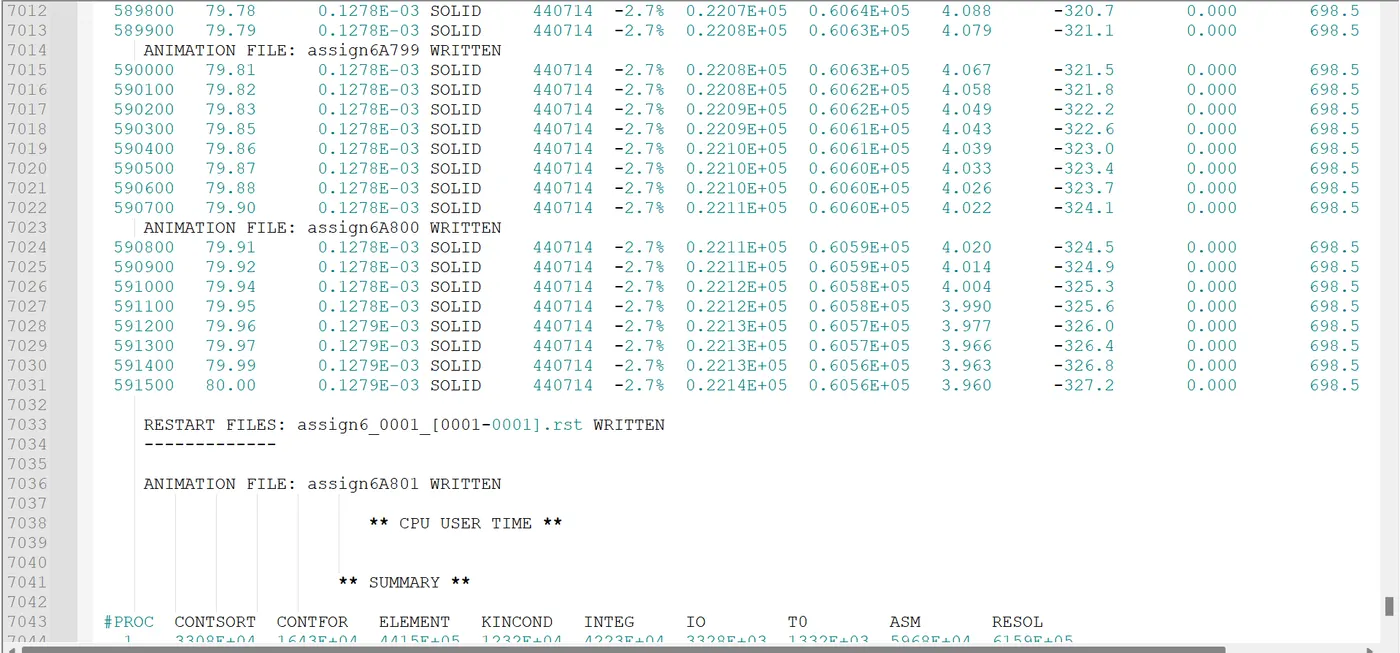
- The total simulation time to complete is 15767seconds with energy errors as -2.7% and mass errors is 0.
- For viewing the simulation the HYPERVIEW is selected and open the h3d file. From the animation file as one can see that the maximum stresses are near the bumper as it is taking the complete load onto the rigid-wall. Also one can observe that as the given component is half model the based on CG after the impact the model is moving up. It is not true for the real scenarios.
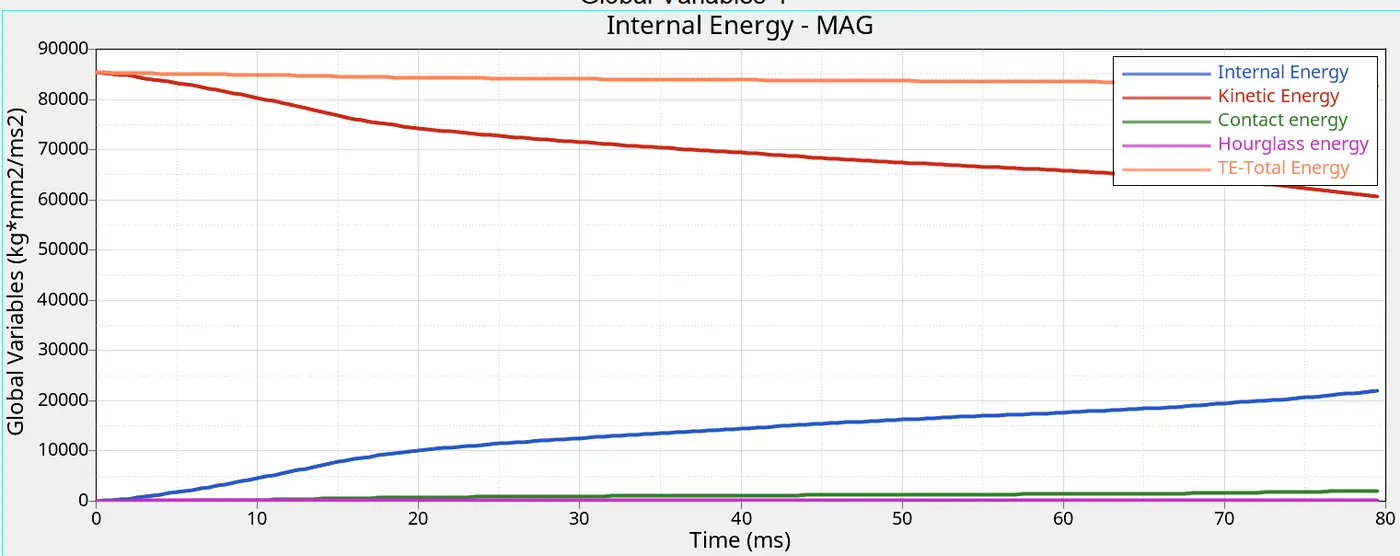
- The different Energy plots are given for the total time 80ms. One can see from the graph that the kinetic energy reduces and the Internal energy increases but the total energy remains almost constant as the energy error is just 2.7%. The contact energy is increased a little because of the friction between the wall and the BIW, the hour glass energy is almost zero.
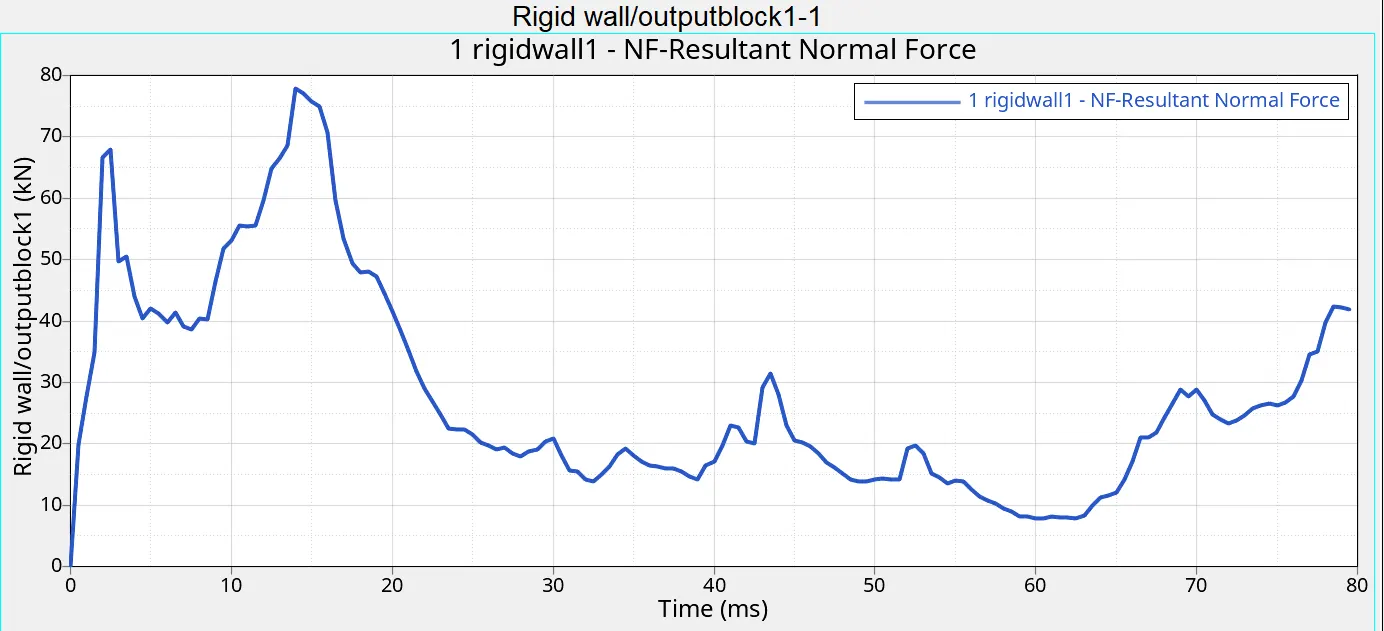
- The rigid-wall forces are plotted against the time and shown in the figure below. The peaks in the plot is due the contact between the bumper and rigid-wall. Gradually the forces reduces after the impact.
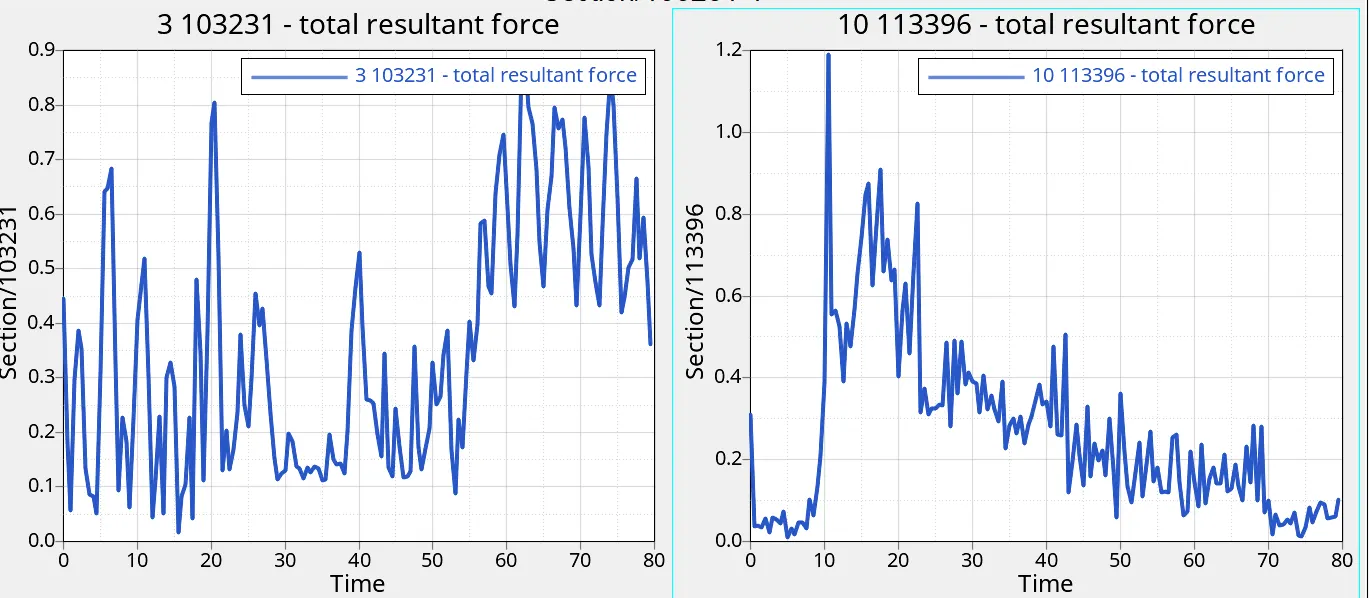
- The cross-sectional forces of A-Pillar is given in the plot for both left and right pillars. As one can observe from the plots that the maximum force on the left A-pillar is 0.9N where as the right is 1.2N, as the force coming from the bumper to rails and to shotguns the forces on A-pillar is very less.
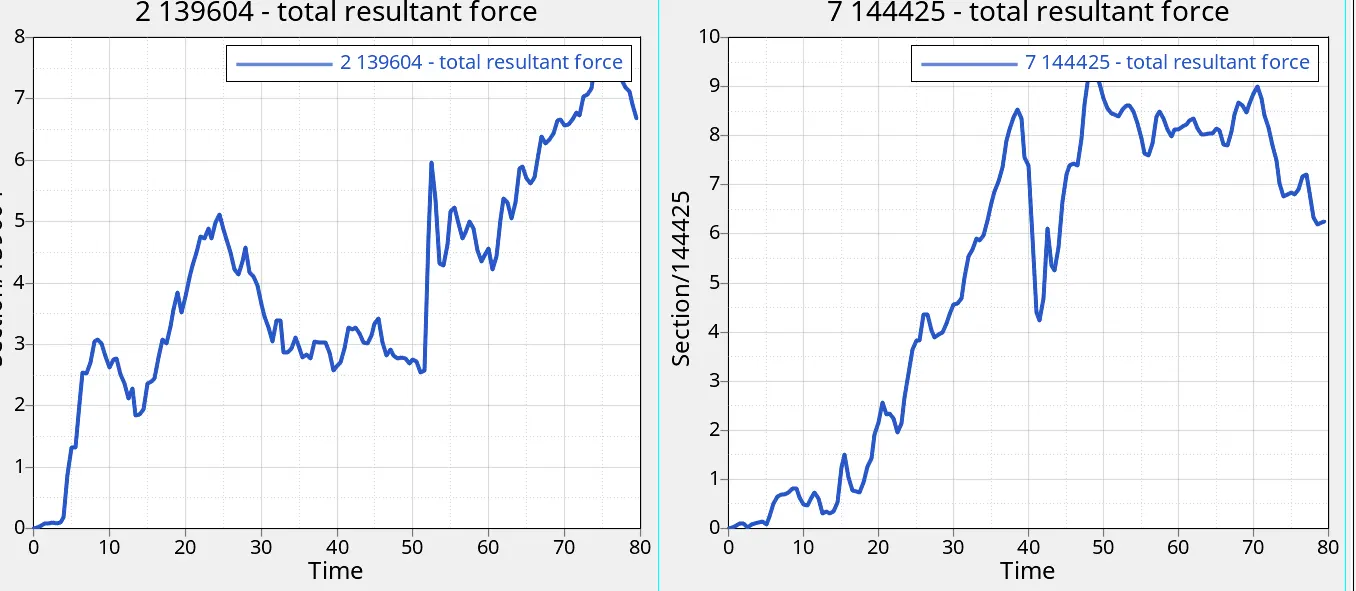
- The shotgun sectional forces are plotted in the figure shown below. At the starting of the impact the shotgun experiences compressive forces and then the forces start to increase as can be seen from the animation that the front portion bends and experiences the tensile forces, so there is a increase in forces on both left and right shotgun. The magnitude is around 10 because the rails are only present infront of shotgun, so it transmit more forces.
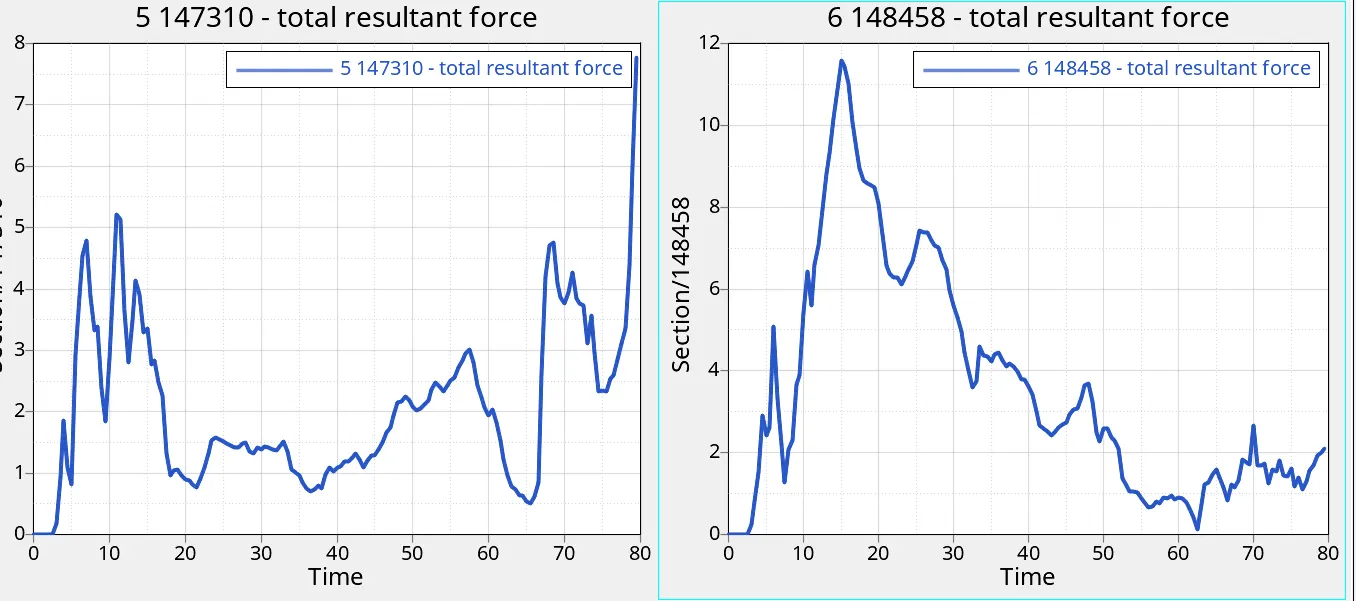
- The forces on bumper rails are depicted in the graph shown below. As one can observe from the graph that the peak forces of magnitude is 12, because most of the forces from the bumper is transmitted directly to the rails near the bumper. The peak is obtained at the time of impact.
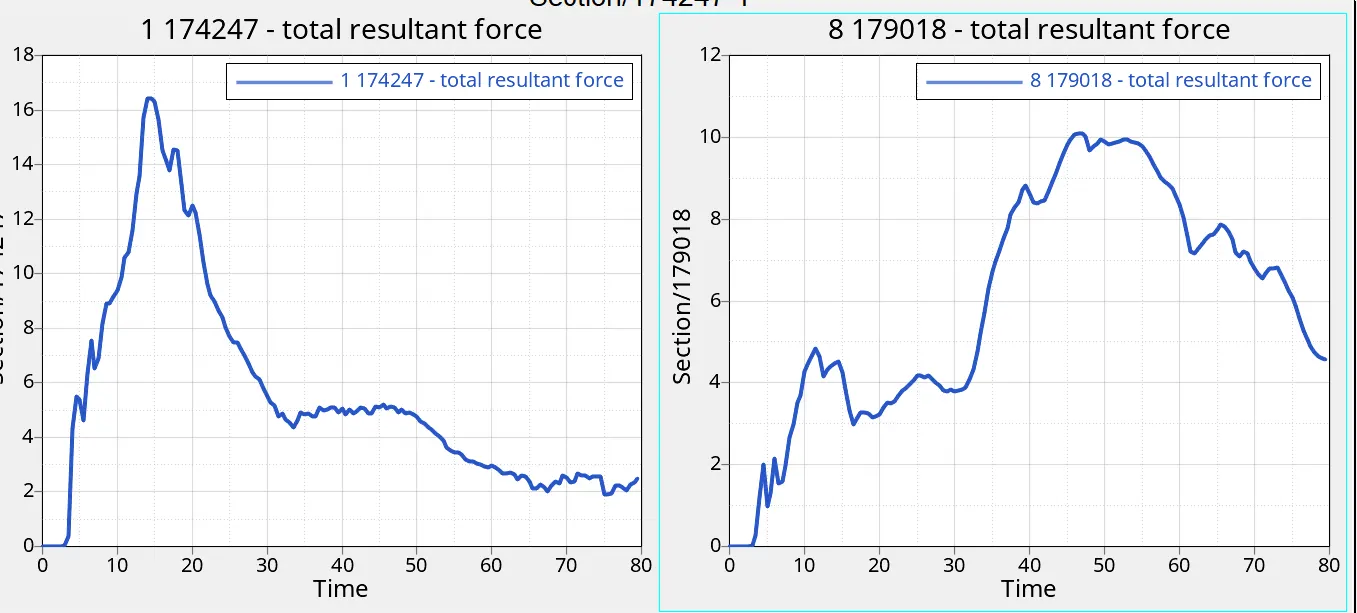
- The Rail forces are plotted in the figure shown below. From the figure the rails are going to take the maximum forces because the rails are going to impact the wall during the crash time. The right rail will impact at 50ms and left rails will impact at 15ms, so the peaks are observed at the time of impact of rails.
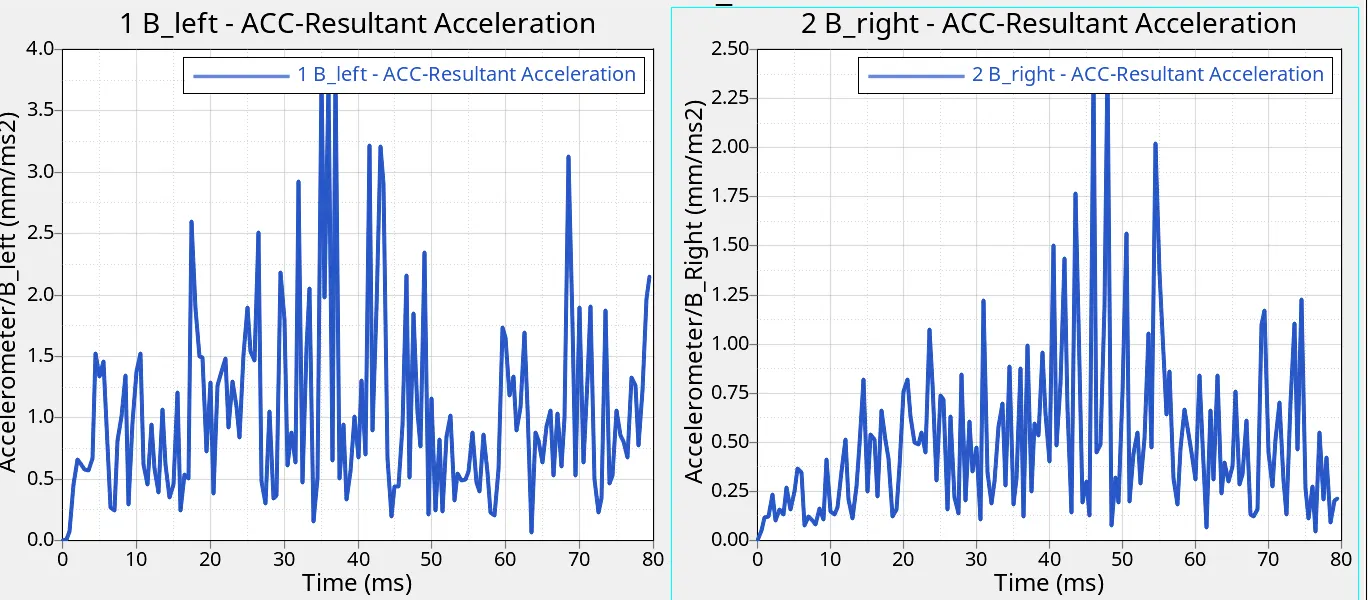
- The acceleration of B-pillars are plotted to see the acceleration of the car during the impact which is shown below. As one can observe from the graph that the acceleration is fluctuating throughout the simulation because the BIW has so many different parts, each will react based on the impact. The peak acceleration is obtained at 35-45ms of time of the simulation.
- To measure the safety of the passengers the cabin intrusions are to evaluated. So at 66244 and 66695 nodes the displacements are calculated and plotted in the graph as shown in the figure below. The maximum displacements near the reference coordinate system is 1150mm and for the node 66244 the displacement is 950mm so the resultant displacement is 200mm, similarly the node 66695 resultant displacement is 750mm.
CONCLUSIONS: The frontal crash simulation is performed for the given BIW. The cross-sectional forces, accelerations and cabin intrusions at the required locations are plotted. As it is half model the deformations are not realistic, where as if we go and do the full model the forces and deformations are realistic, this is to study how the frontal crash analysis is done. This can be easily extended to full model and calculate the required outcomes.