Assignment 6-Frontal Crash Simulation Challenge
Objective : To perform Frontal Crash analysis on the Given Neon model with the given parameters
Frontal crash-BIW
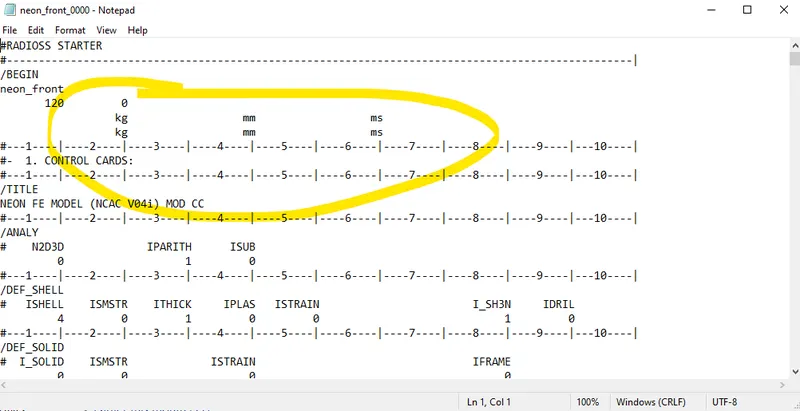
- Check unit system and either follow[Mg mm s] or [Kg mm ms].
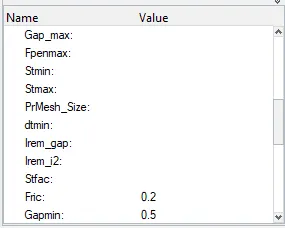
- Create appropriate interface ,friction 0.2 and recommended parameters.
- Make sure of no penetrations and intersection.
- Correct rigid bodies if any issues.
- Create rigid wall with friction 0.1.
- Compare the model weight with the full scale 300k nodes model and use added masses to reach target weight 700kg while getting CG about the required range.
- Initial velocity 35 mph.
- Use model checker to ensure good quality.
- Time-step :0.5 to 0.1 microseconds.
- Run 80 ms.
Output requests:
- Sectional force in the rails at location of indicated node 174247.
- Axial force received on the rails from bumper.
- Shotgun cross sectional forces.
- A pillar cross section.
- Acceleration curve received on the accelerometer at base of B pillar (on B pillar rocker).
- Intrusions on the dash wall 66695,66244.
Procedure:
1. The unit system for the model was checked from the starter file as the unit sytem was in [Kg mm ms] so no need to change the unit system
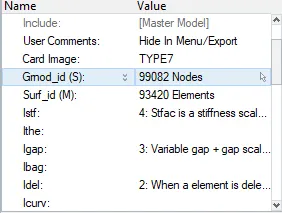
2. Then further the interface parameters were edited with friction 0.2 and other properties,the Idel,Isf and several other parameters were edited
The type 7 interface :Solid contact impact at all speeds
The type 7 card was created using Inter tab in the solver browser and all the nodes and elements were selected
After applying the type 7 property to the model the model was looking as below
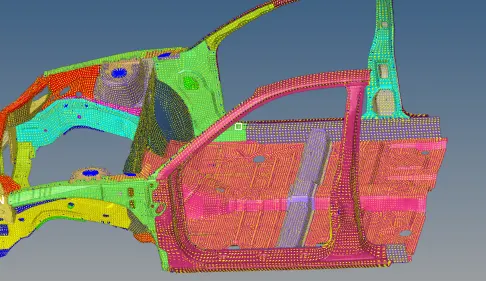
Fig: Type 7 Interface
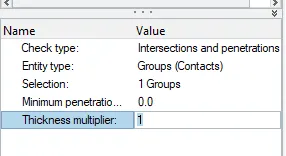
3.After this the model was checked for penetrations and intersections as there was no pentration and intersection .the model was good to go for further simulation
For checking penetration
Tools--> Penetration check
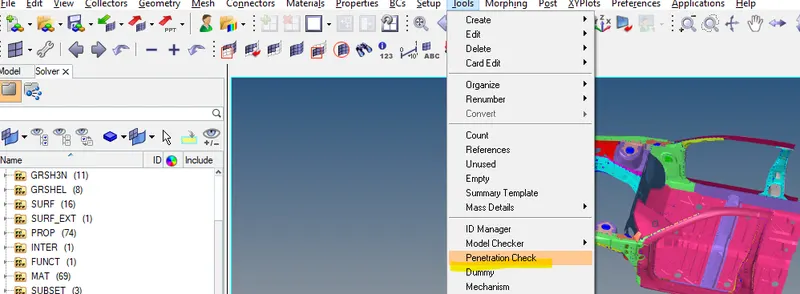
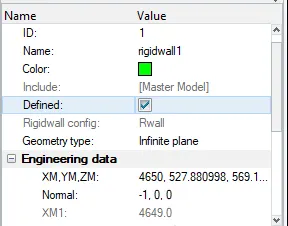
4.The rigid wall was created using the solver browser the Plane was defined using the frontal section of the bumper
The XY,YM,ZM cordinates were used to ddefine the vector of the wall and the direction of the normal vector was given towards the vehicle and friction value was given as 0.1
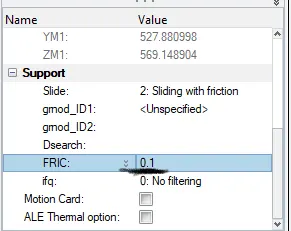
After assigning the values and defining the coordinates the wall was looking like an image shownn below in the graphical window
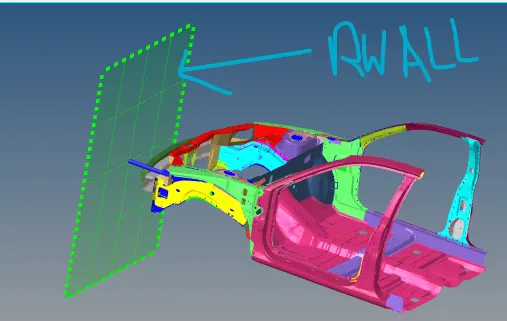
Fig: Rigid wall
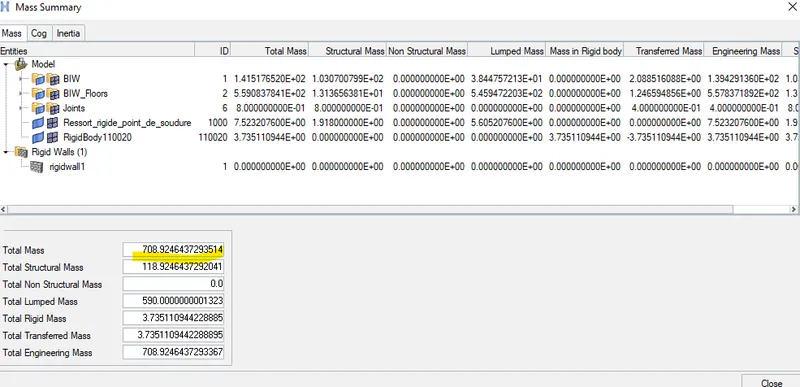
5. The model was having a weight of 188 kg and it was to be desired as 700 kg for the adjustment of COG
for this the hypercrash application
In the component browser right clicking will give ADMAS and after this mass was added to ground component and which resulted in the Movement of COG 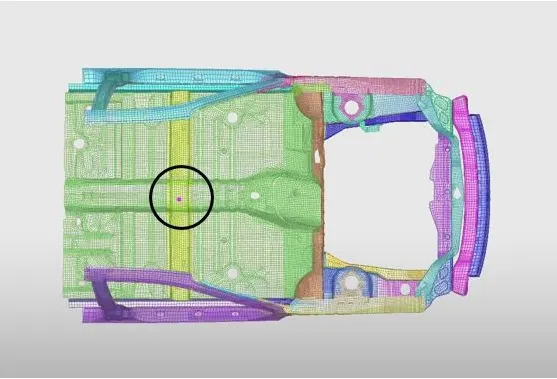
Fig : COG Of the Frontal BIW
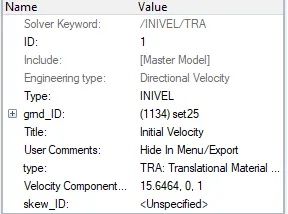
5. For any model for being ready for the simulation BC's are neccessary to be defined and for this Initial velocity was assigned to the model along the X-Axis facing rigid wall
The value of initial vleocity was to be 35 Kmph as the Unit system is in kg mm ms so the vleocity is 15.66 mm/ms
For creating INIVEL Solver-->BC's-->Inivel
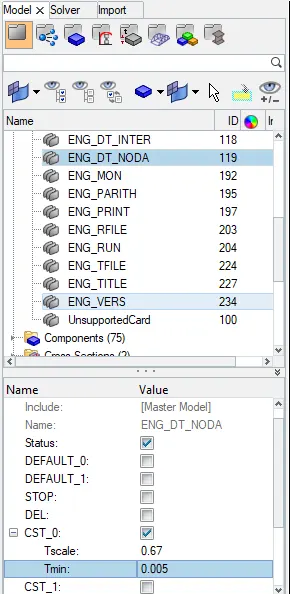
6. The Time step was to be assigned as 0.005 ms hence from the model browser-->Cards-->ENGDTNODA-->Tmin
The time step was changed to 0.005 ms with time scale factor of 0.67
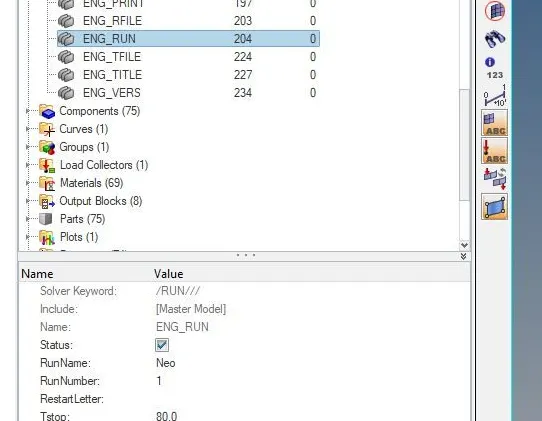
7.The runtime was to be assigned 80 ms hence from the model browser--> cards-->ENGRUN-->Tstop=80
and run number was 1 hence the run number was selcted as 1
8. For getting cross sectional 8 frames and 8 sections were created and similarly output blocks were created for them to get desired results
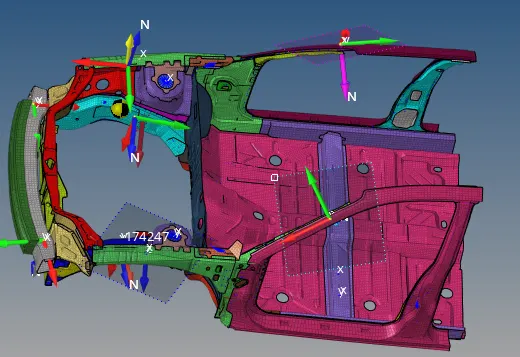
Fig : Cross section and Frames
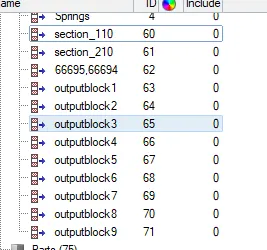
Fig : output blocks
9. In the output request the the vehicle has to be analyzed for accelaration at the base pillar b hence and acceleartion was created using solver tab-->Create--> ACCEL and a node was selected on the B pillar and further output was created for the same
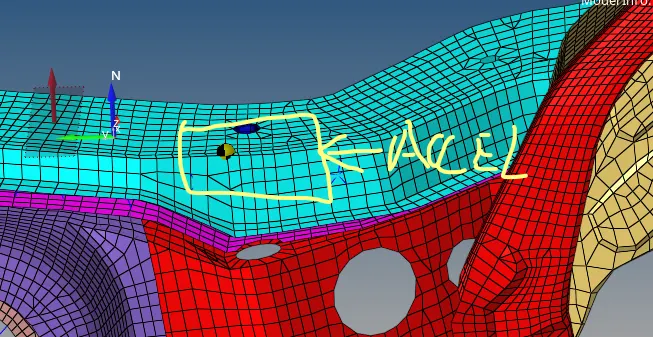
10. After this intrusion was to be determined along the nodes 66695,and 66694 for this skew was created in line with this nodes similarly an output block was created for the same
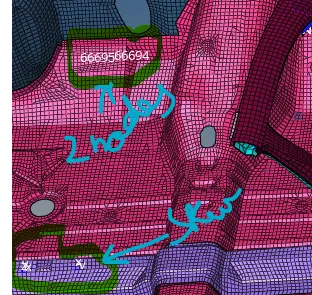
Fig: Intrusion along 66695&94
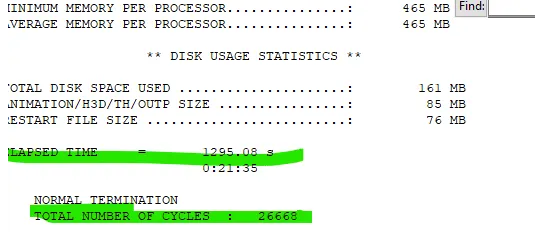
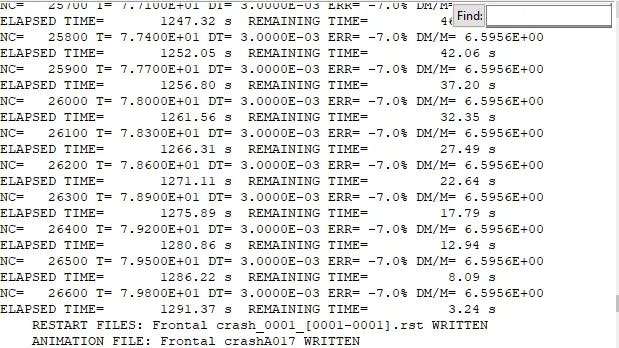
11. Finally the simulation was run through the Analysis-->Radios and solver took aroung 1295 s and energy error was -7.1 % which is accepatable and mass erro 6.569
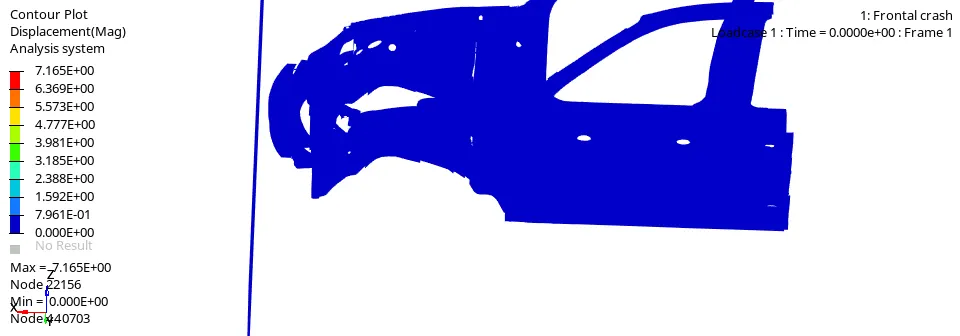
12. The countour plot off displacement helps us about understanding the displacement and max stress encountered during the simulation.
Max stress developed : 716.5 Mpa
13. The 2-D graphs of internal energy and Kinetic energy are plotted as shown in fig
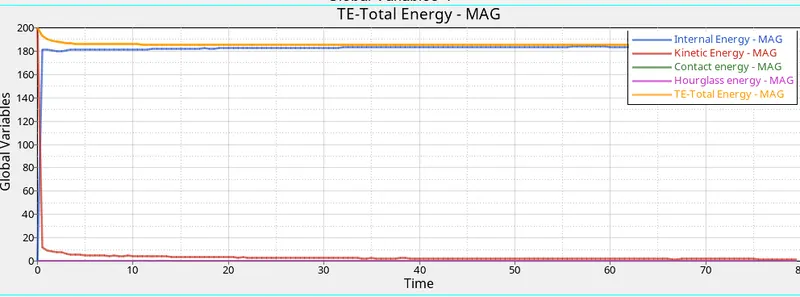
The Kinetic energy,total energy and internal energy remains constant during time and after the crash kinetic energy of the vehicle gets transfered to internal energy resulting in to deformation of the elements and Contact energy and hourglass energy are negligible
Cross sectional forces along the shotgun
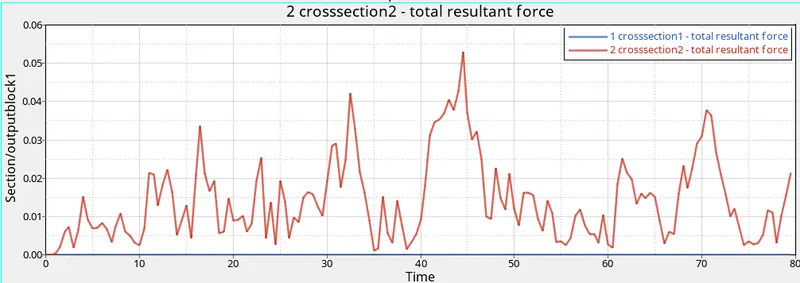
The forces are negligible on the C/S 1 and at the C/S 2 the forces are varying with respect to time and peak force of 0.055 is acheived at 44ms
Cross sectional forces on right and left pillar
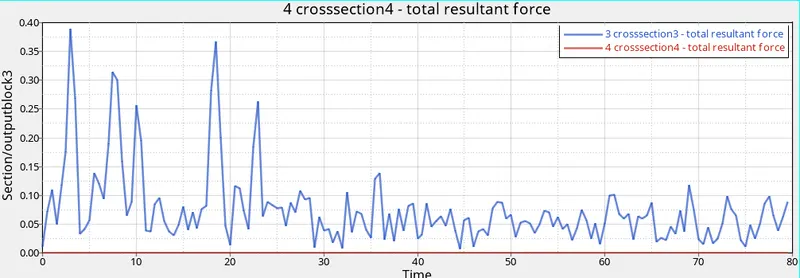
Cross sectional force along the pillars are varrying wrt time and decrease gradually at end of the simulation because of element deformation
with peak force of 0.37 at 4 ms
Cross sectional Forces along the Bumper Rail
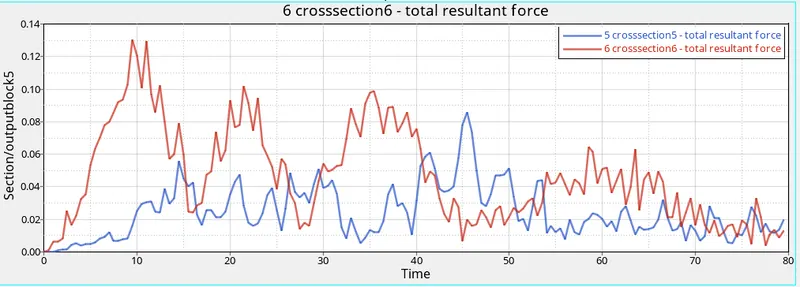
Cross sectional along the bumper are varrying along with the time and max force is attained on the C/s 6 that is the left side of the bumper rail(0.13)Mpa
The forces are more at simulation on the both sides and on later stage the forces remain constant as the forces are distributed equally on the component
Cross sectional forces on the A and B pillar
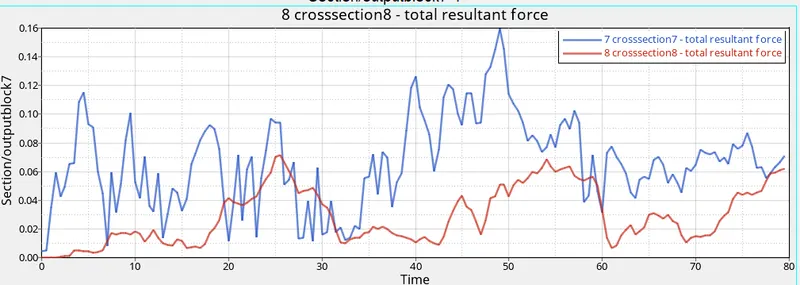
The Cross sectional forces are Varrying wrt time and decrease gradually at the end of simulation
Node Intrusion
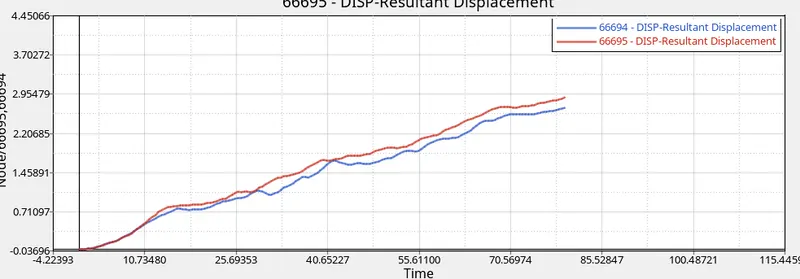
The plot above shows the max forces on the nodes 6685 and94 ad which increase wrt time and max displacement is acheived at end of the simulation which means forces takes time to travel to the occupant space which is a good sign of simulation and passenger safety
Acceleration curve received on the accelerometer at base of B pillar (on B pillar rocker).
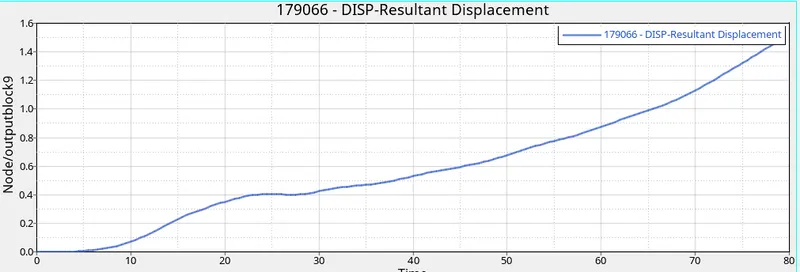
The plot above shows the displacemnt of the node due to acceleration which increase gradually with respect to time
Conclusion: Hence all the pre processing activities were peerformed and after that simulation was run,following the graphs which helps in understanding the C/s forces which determine the forces along the section as we can see that forces are more at frontal region near the bumper rail and less at the inner compartment that is the occupant space
Leaerning Outcomes: Learned how to perform preproccesing and calculate the results throught the output received