Assignment 6-Frontal Crash Simulation Challenge
Assignment 6 Frontal crash simulation challenge
1. Introduction:
A frontal crash is one of the standard tests conducted to assess the safety of a passenger car in the event of a crash or road accident. based on the test results, the car is awarded a certain rating by agencies like NCAP and EURO NCAP. This rating works as a guideline to the customers while choosing a car. Engineers consider three factors to determine how a vehicle rates in a crash test: structural performance, injury measures and dummy movement.
Structure/safety cage: To assess a vehicle's structural performance, engineers measure the amount of intrusion into the occupant compartment at key locations in the interior and exterior of the vehicle after the crash. The amount and pattern of intrusion show how well the front-end crush zone managed the crash energy and how well the safety cage held up.
Injury measures: Sensors in the dummy — or dummies, in the case of passenger-side small overlap — are used to determine the likelihood that a driver or passenger would sustain various types of injuries in a similar real-world crash. Measures recorded by sensors in the head, neck, chest, legs and feet of the dummy indicate the level of stress or strain on that part of the body — in other words, the risk of injury.
Restraints/dummy movement: Even if injury measures are low, it's important to consider the movement of the dummy or dummies during the crash, since not all occupants are the same size as the dummies or seated exactly the same way. A close call for a dummy could be an actual injury for a person.
Before each crash test, technicians put greasepaint on the dummy's head, knees and lower legs. After the test, the paint shows what parts of the vehicle came into contact with those parts of the dummy. The paint, combined with high-speed film footage of the crash, allows engineers to evaluate the movement of the dummy or dummies.
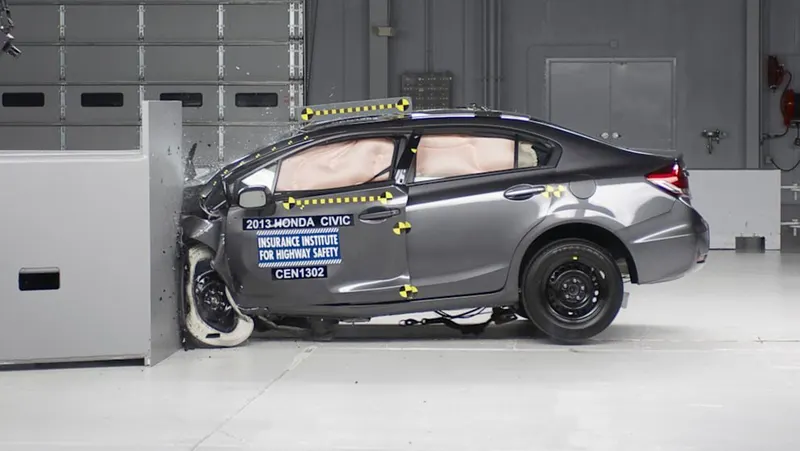
Fig 1.1: A passenger car after frontal impact in a crash test
In a global NCAP test, the car is driven at a speed of 64 kmph, however, the speed may vary according to local regulations.
The car manufacturers perform FE modelling and simulation of the full vehicle model at the design stage itself to assess the crash performance of the design and achieve the intended ratings.
In this project, a simplified BIW of the NEON car model was used to simulate a frontal crash test using Hyperworks Radioss solver. The crash of a vehicle is a very dynamic process happening within 100 milliseconds. This phenomenon involves lots of non-linearity in FE modelling like plastic deformation in the parts leading to a material model with all the plasticity details.
The modelling details and results are discussed in the following sections.
2. FE Modelling and Radioss deck preparation
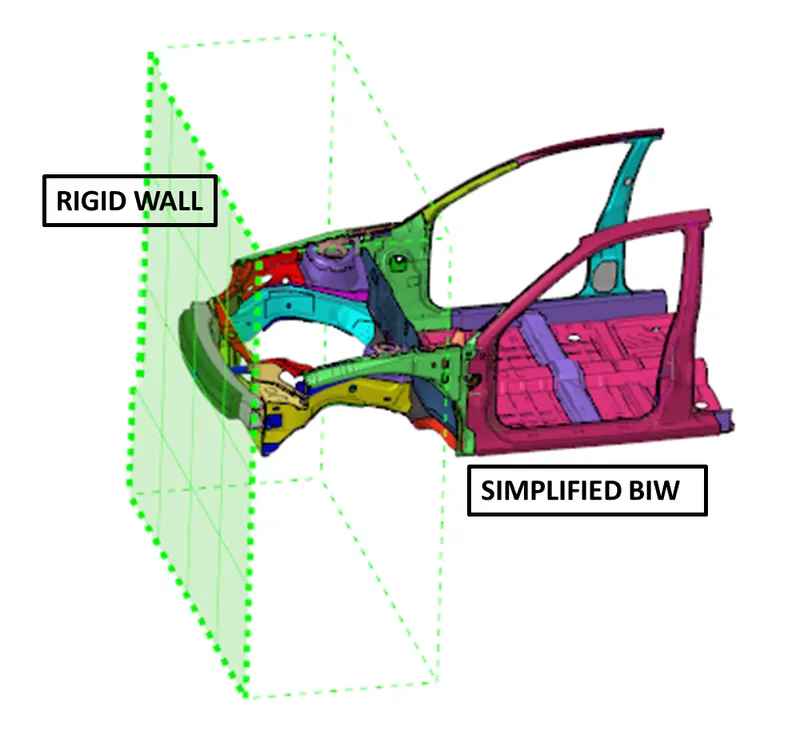
Fig 2.1: The FE model used in the project
- A simplified BIW model was provided as a part of the instructions for the project. The first objective was to achieve a total mass of 700 kg. The simplified model's total mass was 119 kg and additional mass was assigned to the mid portion of the cross member. It was done using ADMASS keyword in the Hypermesh and the mass was added to each nodes on the NODESET made for adding the additional masses. The achieved mass of the model was 700 kg.
- A type 7 (node to surface) contact was assigned to all the components wherein, the master and slave components were assigned as all the components to facilitate a self contact among the entities during deformation. This ensures the components do not penetrate into each other.
- The penetration was checked for all the components to ensure there is no initial penetration in the model. Initial penetration affects the working of contact, a contact working on penalty formulation works using a virtual spring assigned between the master and slave entities. Whenever the specified minimum gap is violated, a reaction force governed by the stiffness of the virtual spring is applied to the slave entity to avoid penetration.
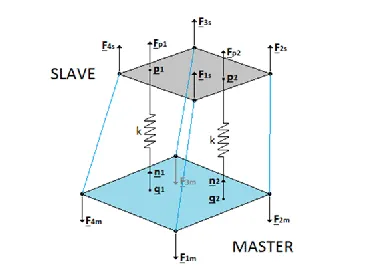
Fig 2.2: The depiction of a penalty formulation contact
- The next step was to model a rigid wall in the front to crash the vehicle against. This was done using the create>> rigid wall option available in the Hypermesh. The rigid wall was placed at a distance of 10 mm from the front bumper. The DSEARCH option available in the modelling window of the rigid wall was used and a value of 1000 mm was assigned to enable contact between the rigid wall and the entities coming in proximity. This saves us from entities penetrating into the rigid wall. It was ensured that the normal points towards the model.
- After that, a velocity of 35 kmph was assigned to all the components using the INIVEL keyword in the solver browser of Hypermesh. Since the kg-mm-ms unit system was followed, a value of 9.722mm/ms was assigned in the +X direction.
- The following output requests were made using the TH cards as explained in the below section:
- Intrusions on the dash wall 66695,66244
A local skew was created for each of the nodes on the cross member, and TH keyword was used to create an output request for each of the requested nodes.
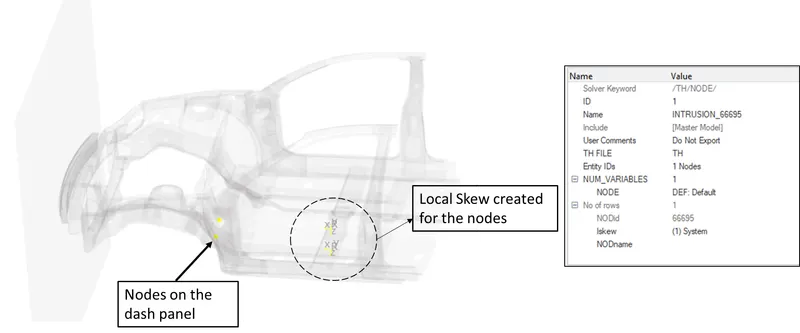
Fig 2.3: Nodes chosen to record the intrusion of dash panel into the compartment.
2. Sectional force in the rails at the location of indicated node 174247, A-pillar and shotgun cross sections:
Section keyword
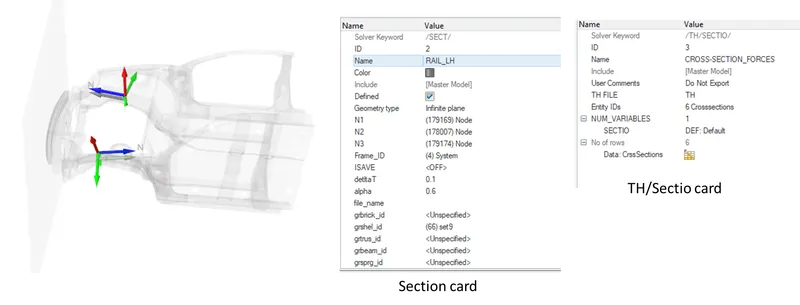
Fig 2.4: the sections created for recording section forces in the rails.
Then a TH card SECTIO was used to request the forces in the time history file. A similar procedure was used for each of the requested locations.
3. Accelerometer at B pillar Rocker
It was asked to model an accelerometer to get an idea of the acceleration in the model during the crash.
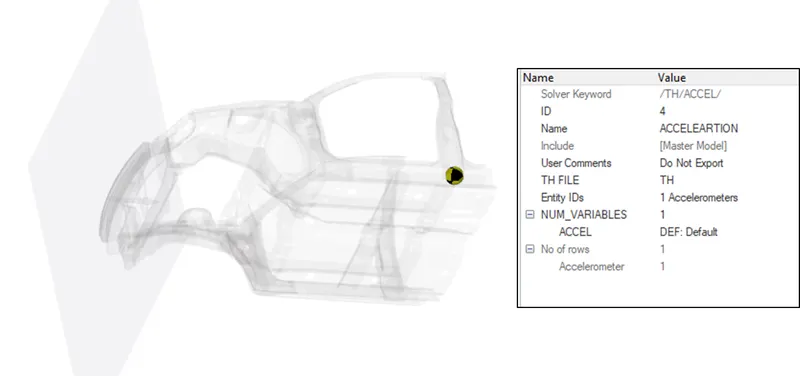
Fig 2.5: the accelerometer created at the rocker of the B pillar.
4. Axial force received on the rails from the bumper
It was achieved using contact between the bumper and headlight bracket (type 7 contact) and requesting the contact forces for it.
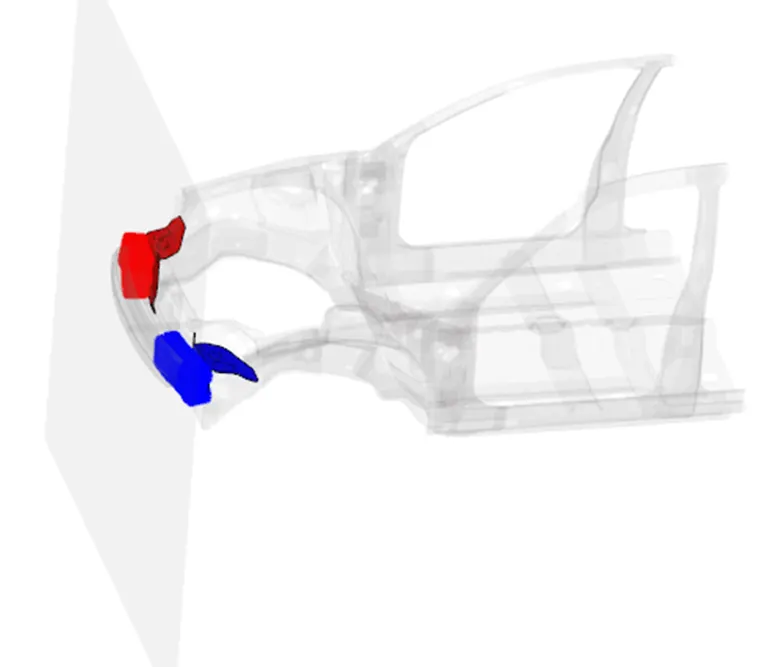
Fig 2.6: Type 7 contacts created between the bumper and headlight bracket
2.1 Engine keywords used in the model
- DT/NODA: It is used to control the timestep during solution. A solver basically computes the timestep size based on elements, nodes and contacts. DT cards can be used to specify each type of the timestep as required in the model.
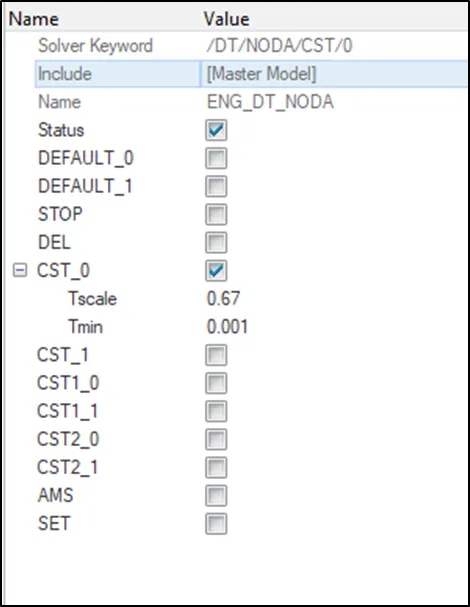
Fig 2.1.1: The DT/NODA card used in the model
The CST option in it activates mass scaling based on the minimum timestep size of 0.001 ms and a scaling factor of 0.67. We need to monitor the mass error (DM/M) in the message file to see if the mass scaling is adding excessive virtual mass in the model affecting the K.E and other parameters. A good practice is to keep the mass error below 5-7%.
- DT/ANIM: It is used to request the animation file.
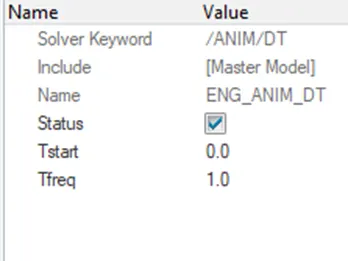
Fig 2.1.2: the ANIM/DT Card used in the deck
A total of 80 frames for 80 ms of the runtime is going to be written with a frequency of 1.0 ms.
- ENG_RUN: controls the simulation run time with the TSTOP parameter. A value of 80 ms was assigned.
- ENG_TFILE: Controls the frequency with which time-history data needs to be recorded.
- ENG_ANIM: This card is used to request various animations based on EPSP, Vonmises stress etc.
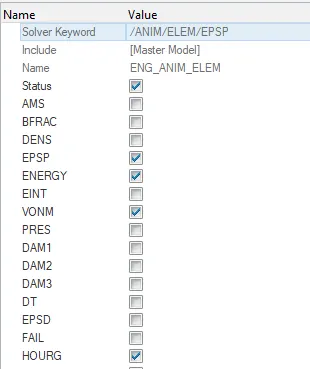
Fig: The ANIM card used in the solver deck
3. Results and discussion:
The simulation was run in the Radioss solver and the results are presented one by one in the following sections.
- Animation:
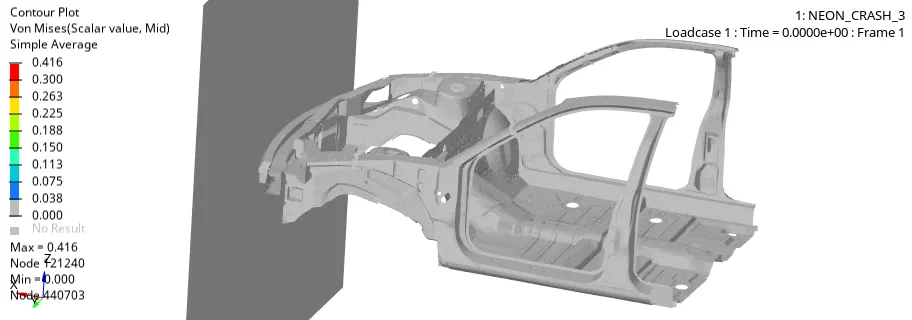
Animation: The animation based on Von Mises stress
The animation clearly shows the contacts worked properly and the mid portion of the cross member is deforming excessively. This can be attributed to the fact that, most of the body mass was concentrated there and this portion has the highest inertia during forward travel. A maximum value of 416 MPa can be observed from the animation.
- Energy plots:
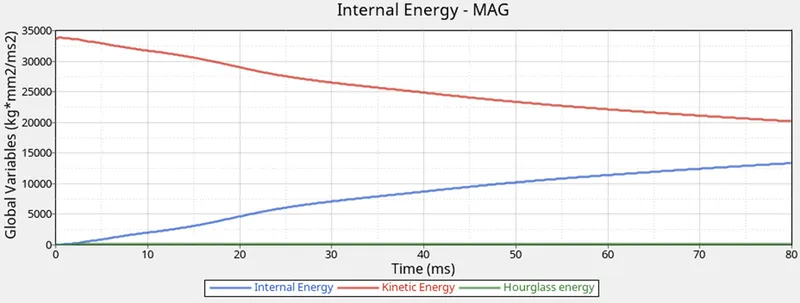
Fig 3.1: The energy plots from the simulation
All the energy plots resemble plot for a crash simulation. The KE keeps on decreasing while IE goes on increasing as the body deforms. Also, the Hourglass energy is very low in the plots. thus, we can accept the results for the purpose of this project.
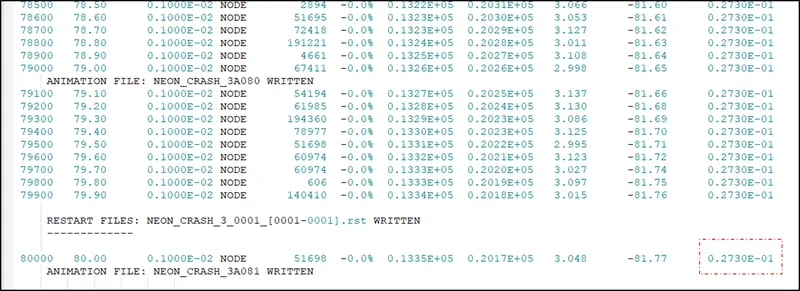
Fig 3.2: The snapshot from the message output
The total mass error in the model due to mass scaling was 2.7% which is acceptable.
- Requested Outputs:
1. Intrusion
Since there is no any apparent rotation in the model as clear from the animation, we will accept the x displacement of the nodes on the dash panel to be the intrusion.
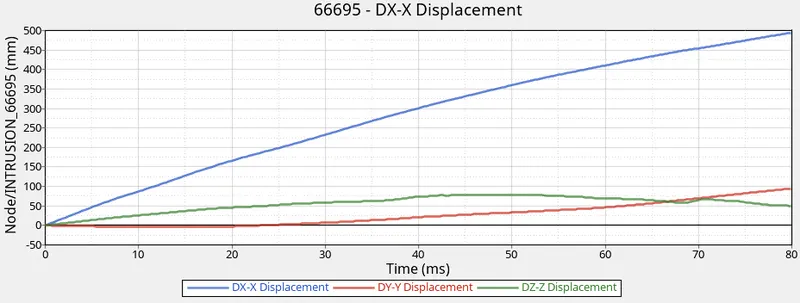
Fig 3.3: The intrusion as recorded for the node number 66695
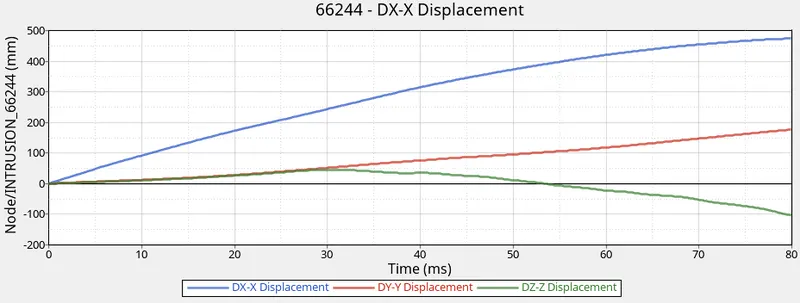
Fig 3.4: The intrusion as recorded for node number 66244
As clear from the plot, the maximum intrusion was around 500 mm which is an unrealistic value. Actually, there will be much more stiffness to resist the frontal crushing in the actual car model with all the components and this value will be very low.
- Section forces:
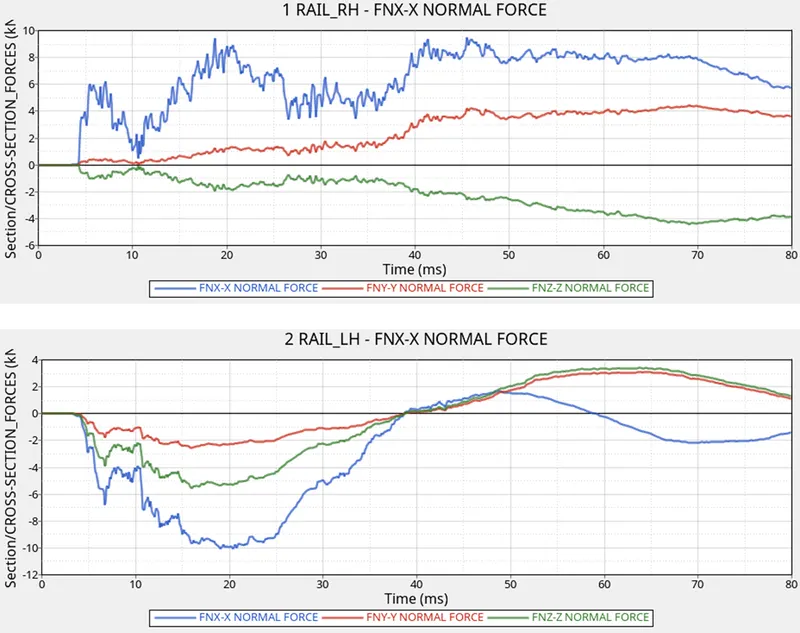
Fig 3.5: The section forces received on the rails.
A maximum value of about, 10 kN is observed in both sections. Note: Differences in signs indicate opposite direction normals for the two sections.
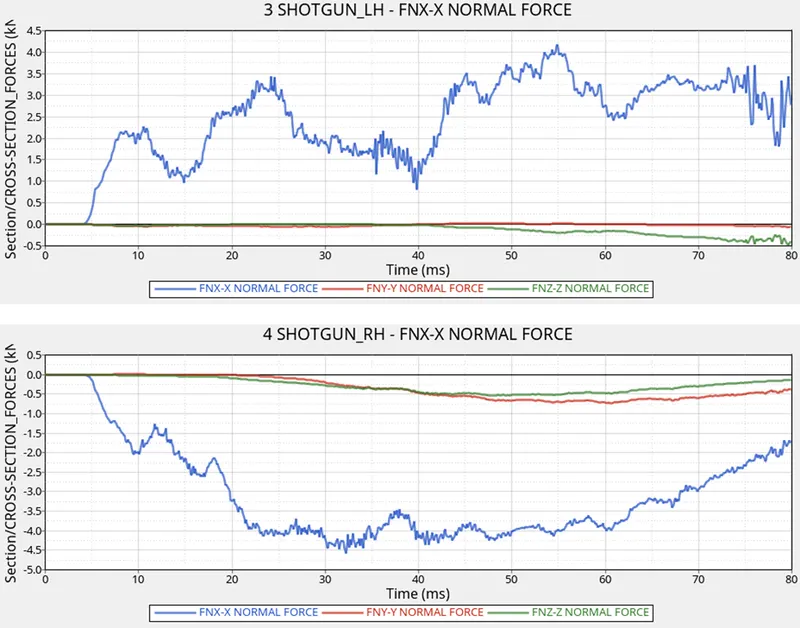
Fig 3.6: The section forces received on the shotgun cross-sections
A maximum value of around 4.5 kN is observed in the plots. This signifies that the rails bear more forces than the shotgun in a frontal crash.
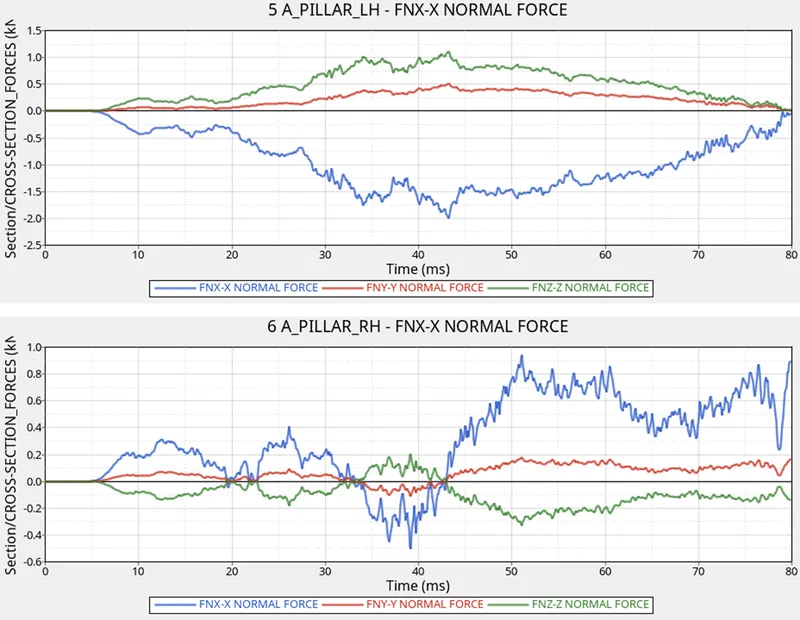
Fig 3.7: The cross-section forces received on the A pillar
A max value of around 2 kN is observed in the LH side.
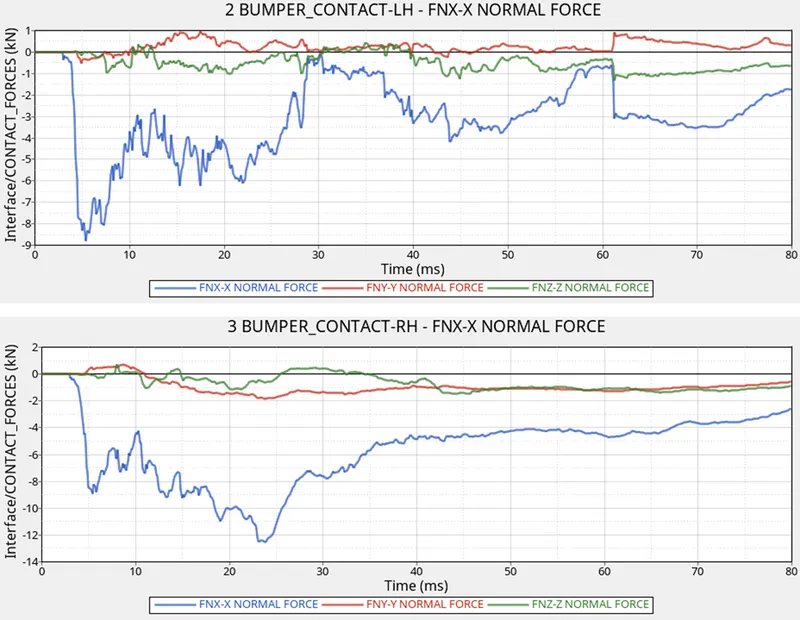
Fig 3.8: The contact forces received on the rails from the bumper
A maximum value of around 14 kN can be observed. This data can be correlated with the section forces received on the rail sections. The max value obtained was around 10 kN which is logically correct as the deformation of components before rails need to dissipate some of the energy.
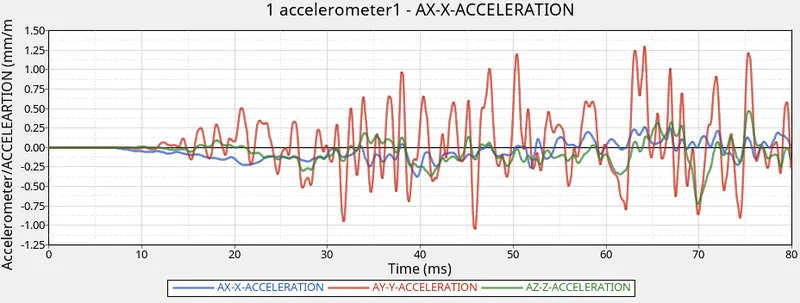
Fig 3.9: The acceleration data plotted for the model
A max value of around 1.25mm/ms2 was obtained as clear from the plot.