Front car crash simulation
OBJECTIVE - To perform a Front crash impact analysis of neon car to study how the impact forces are distributed throughout the structure to prevent damage to the occupants and Study of the forces or energy generated and displacement on the various cross-sections of the BIW and study of the various energy plots after running the simulation.
- Check the unit system and either follow[Mg mm s] or [Kg mm ms].
- Create an appropriate interface, friction 0.2, and recommended parameters.
- Make sure of no penetrations and intersections.
- Correct rigid bodies if any issues.
- Create a rigid wall with friction 0.1.
- Compare the model weight with the full-scale 300k nodes model and use added masses to reach the target weight of 700kg while getting CG about the required range.
- Initial velocity 35 mph.
- Use a model checker to ensure good quality.
- Time-step :0.5 to 0.1 microseconds.
- Run 80 ms
PROCEDURE -
1. Unit system - By opening the file neon_front_0000.rad (starter input deck), It is check that unit system was set to (kg), (mm), (ms) or you can see the unit system by open the begin card which is under the control card as shown in fig.

Fig. unit in engine rad file
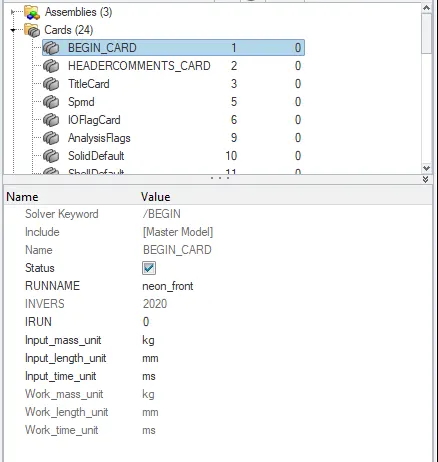
Fig. unit in opening of model
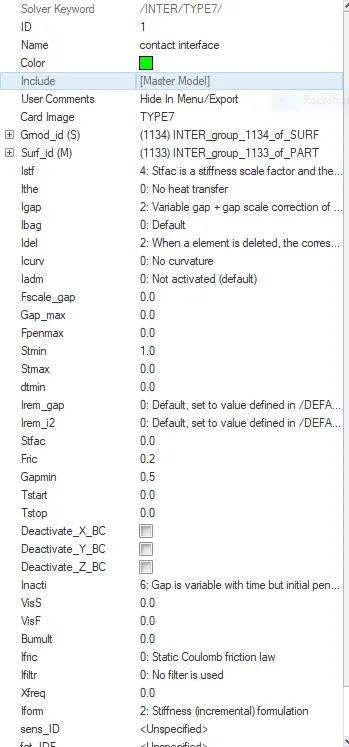
2. Set Contact interface - Create a Type 7 interface with friction value 0.2 and recommended parameter, Already a contact interface is defined in the model we have to delete that interface and to create new appropriate interface with recommended parameters.
The interface Type 7 is a multipurpose interface . it is node to surface contact interface using the penalty method. The node set is slave and surface is in master segment. This interface is using the penalty method with variable stiffness and it is defined with the contact gap and stiffness. Type 7 interface allows sliding between contact surfaces. General-purpose interface and can simulate all types of impact between the set of nodes and the master surface. A slave can belong to the master surface and auto impact possible. The contact gap can be constant or variable.
Important Recommended parameter for contact interface are as follow -
- Igap - 2 (Determines how the size of the gap is calculated).
- Gapmin - 0.5 (Minimum gap for activation of the interface).
- Inacti - 6 (Action to take if initial penetrations exist).
- Istf - 4 (Affects how the stiffness of the interface is calculated).
- Iform - 2 (Friction formulation).
- Stmin - 1 (Minimum stiffness to be used in the interface).
- Idel - 2 (what to do with the slave nodes and the master segments if the elements that they are attached to fails).
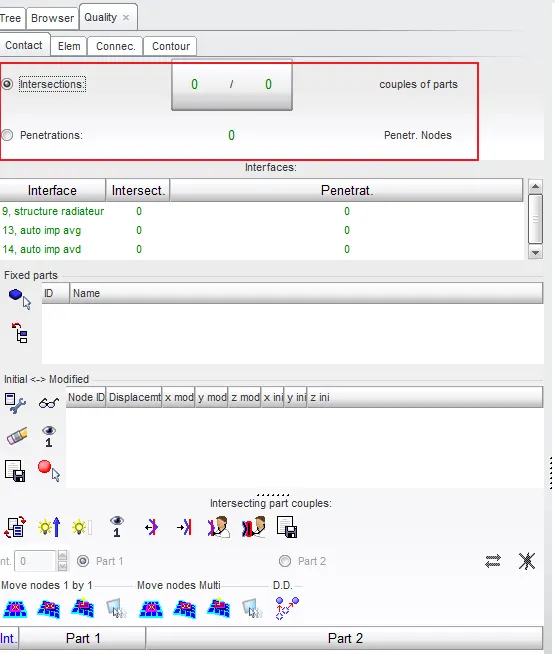
3. Penetration and intersection check - To perform the penetration check in hypermesh go to tools menu bar and select a option of check penetration and select all the component in order to check penetration in the model. the result shows there is no penetration in the model.
4. Correct Rigid body issues - A rigid body is an idealization of a solid body in which deformation is neglected . In other word the distance between any two given point of a rigid body remains constant in time regardless of the external forces exerted on it.
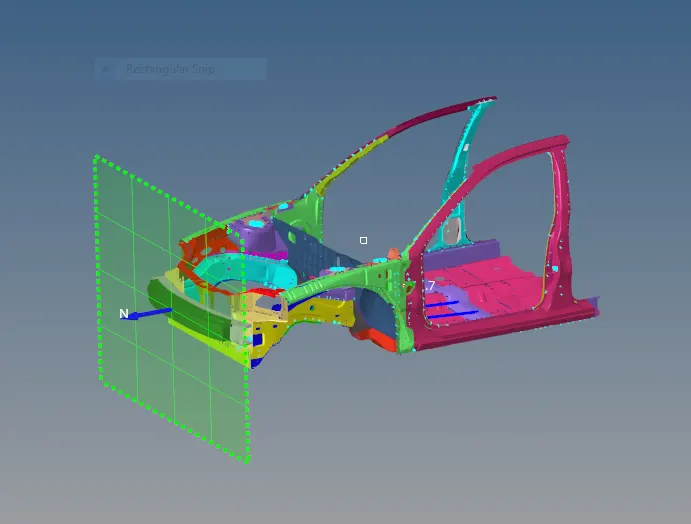
5. Rigid wall creation - The rigid wall can be defined as - an infinite plane, a sphere, an infinite cylinder, or a parallelogram . In order to avoid issue related to initial contact between surfaces , the rigid wall was created a few milimeter away from the front bumper based on the node displayed.
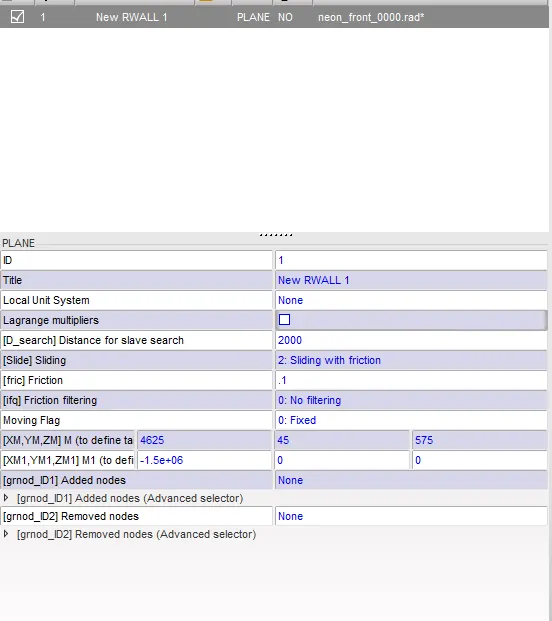
A rigid wall is a nodal constraint applied to a set of slave nodes to avoid the node penetration to the wall. if contact is detected then the slave node acceleration and velocity are modified. mainly to constrain movement of a moving body after impact , we will be using a rectangular wall. An infinityrectangular wall is make.
6. mass balancing and COG adjustment - In hypermesh ,It was determined that the mass of the front part of the car was 188.125 kg and its COG cordinates are as shown in fig. But in this particular case ,the target weight is 700 kg. This mean that a concentrated mass of 511.875kg should be placed in a model so that the centre of gravity of whole model maintain its original position.
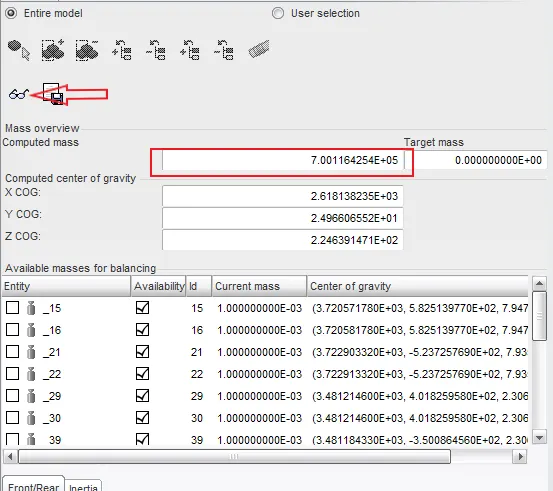
fig. target weigth achieved
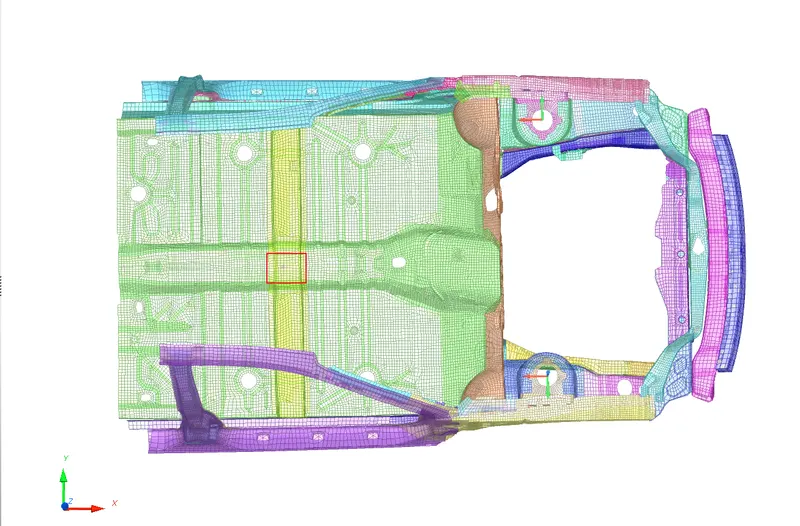
Fig. COG at rail
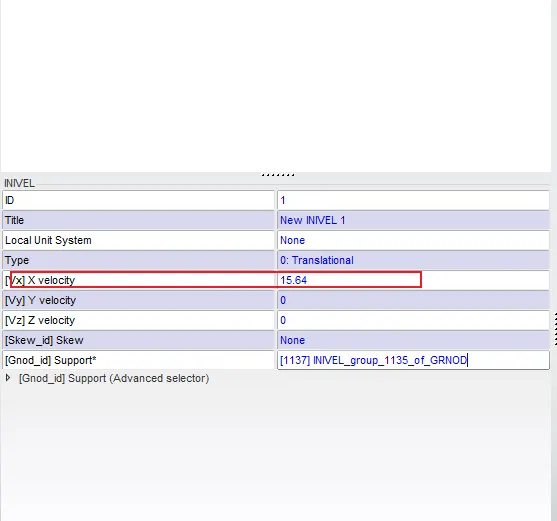
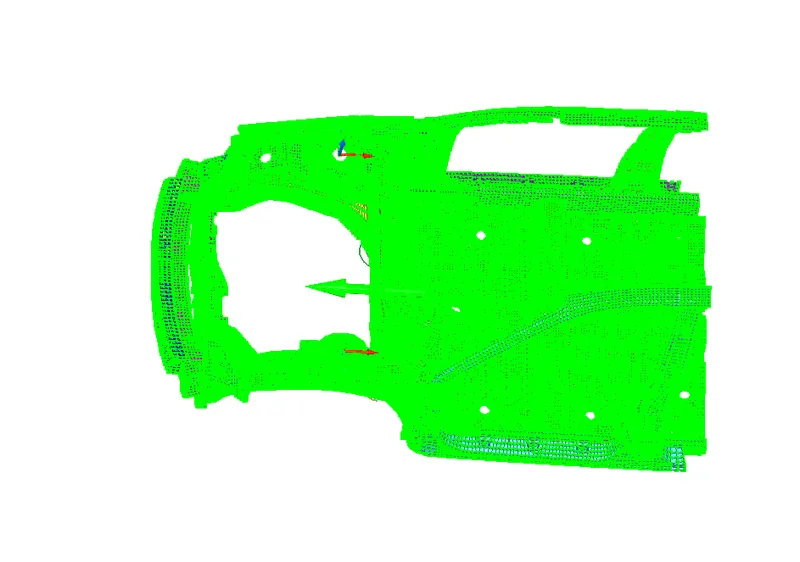
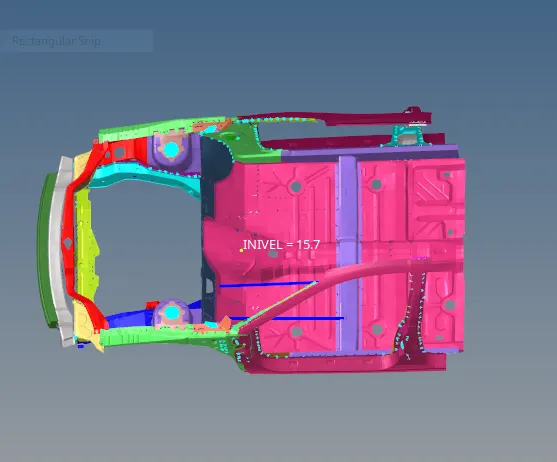
7. Initial velocity - The initial velocity of 35mph (15.64mm/ms) was applied to all the nodes in x direction . This initial velocity provide motion to the car to crash with rigid wall.
8. Setup sectional force point - These section have set up to check the results at that points location of sectional forces is mention below:
- The axial force recieved on the rail from the bumper.
- shotgun cross-sectional forces.
- A pillar cross-section forces.
- intrusion on dash wall on node 66695, 66244.
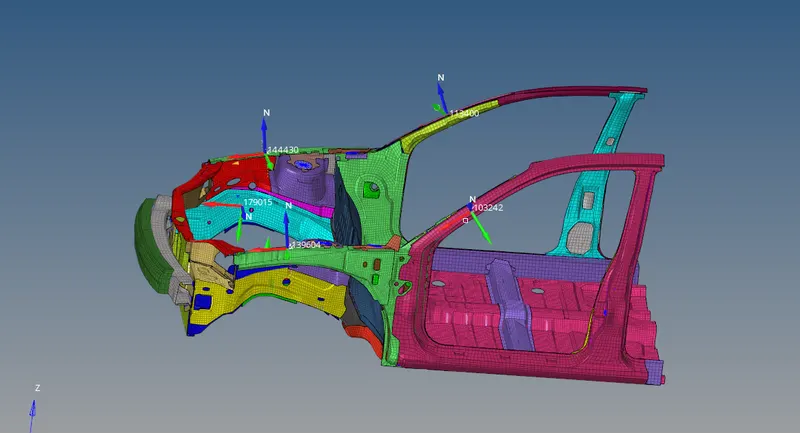
Fig. section force on shotgun, Apillar
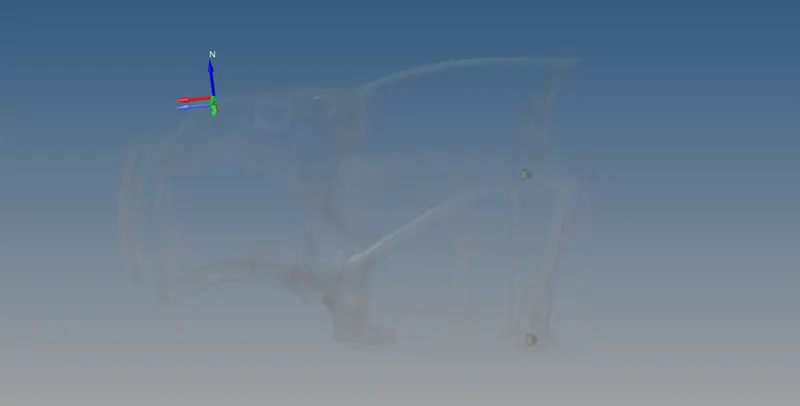
fig. section force
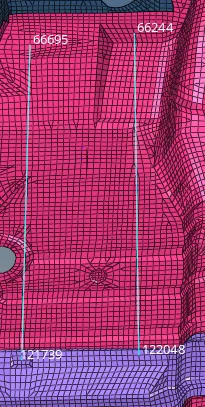
fig. intrusion on dash wall
9. Providing timestep and mention run time - The simulation and run time set to 80ms and element time step set to 0.0005ms.
Element time step control is computed at the same time as the internal forces. The characteristic length and the speed of sound are computed for each element in every cycle. The computed time step is compared to a minimum time step value and a scale factor is applied to ensure a conservative bound.
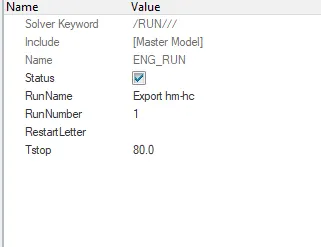
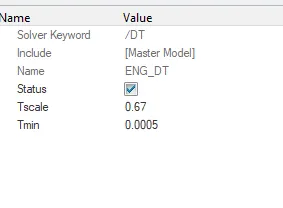
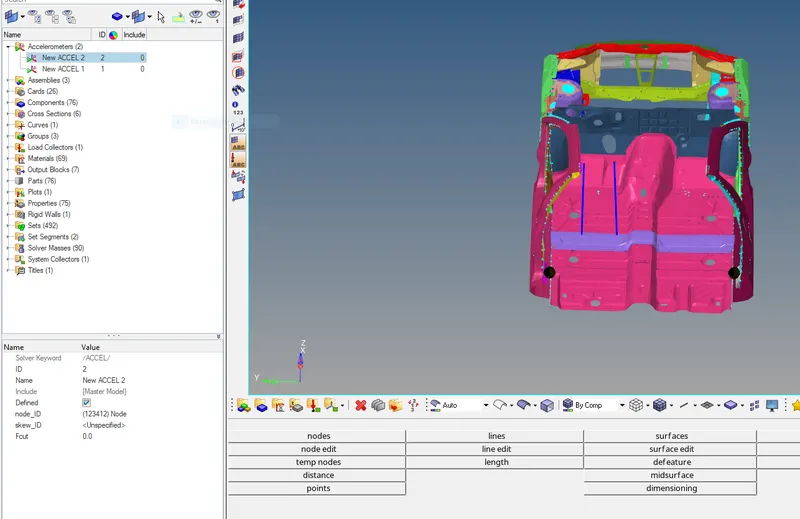
10. Setup two accelerometer - We have set the two accelerometer to measure the post processing result of deacceleration.
RESULT -
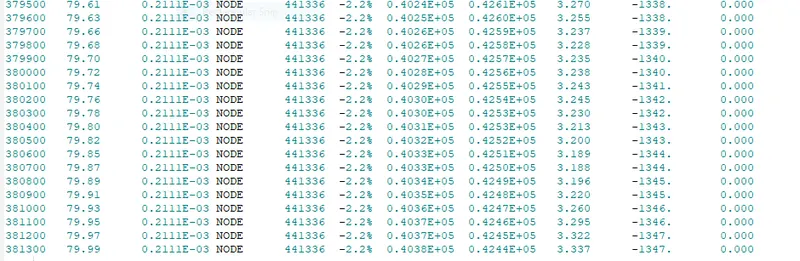
Energy error and mass error - From the below image we can seen that the maximum energy error comes -2.2% and mass error is zero which comes in acceptable range.
Displacement -
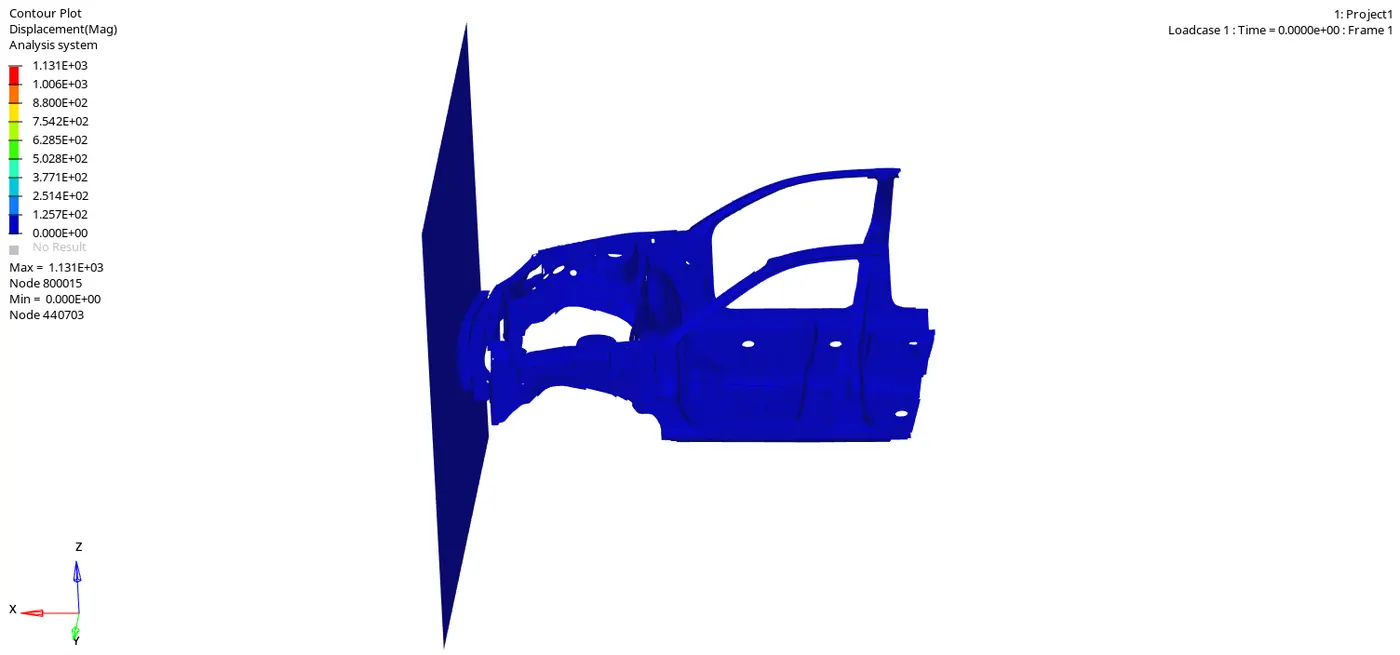
During the front impact, the vehicle is going to impact the rigid wall. At the time of impact, this vehicle will have some kinetic energy possessed and the rigid wall will try to oppose this kinetic energy and itself will apply the force from the opposite direction as shown above. So while impacting the rigid wall the kinetic energy of the vehicle will be reduced continuously and at the same instance, the wall will apply force to the vehicle components due to the transfer of energy. From the above graph of displacement , we can say that rail component LH is getting more deformed than rail component RH and maximum displacement occured is 1131mm.
vonmises -
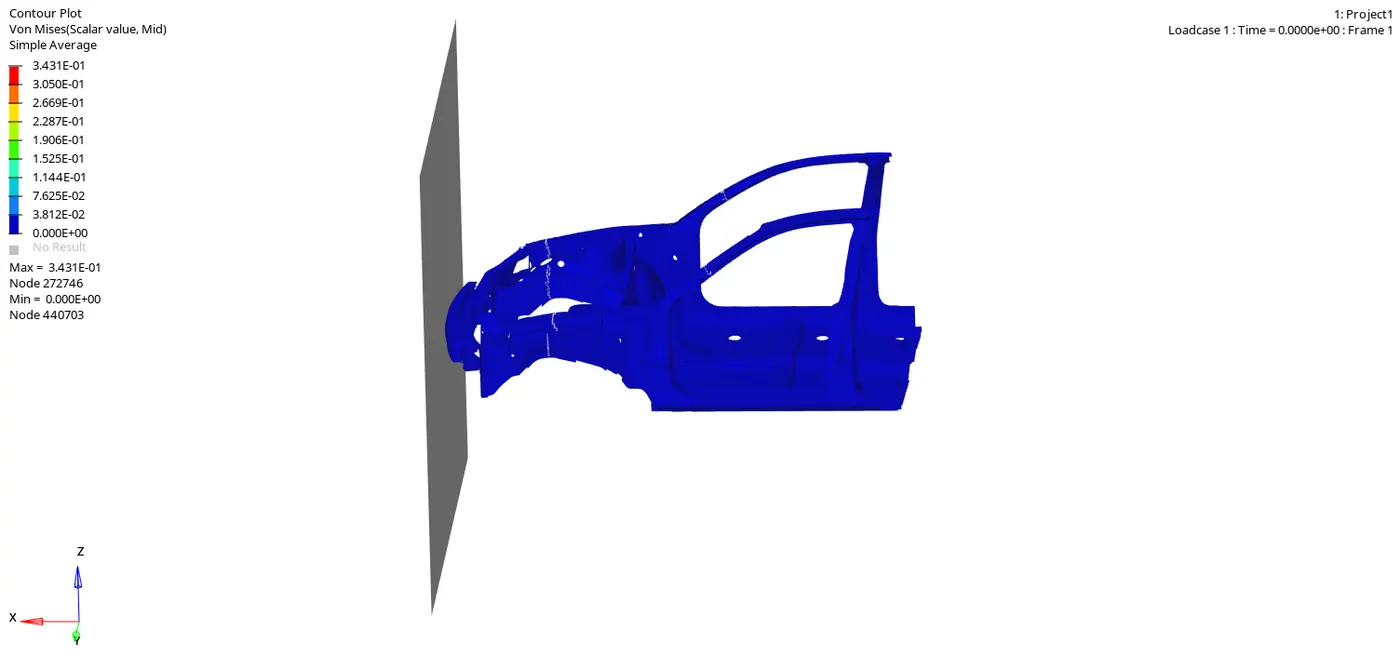
Maximum Von Mises Stress occured is 0.35Gpa .From the above animation we can see that once the car hits the Rigid wall,the maximum stress is flowing from the bumper region to the Rail or shotgun.
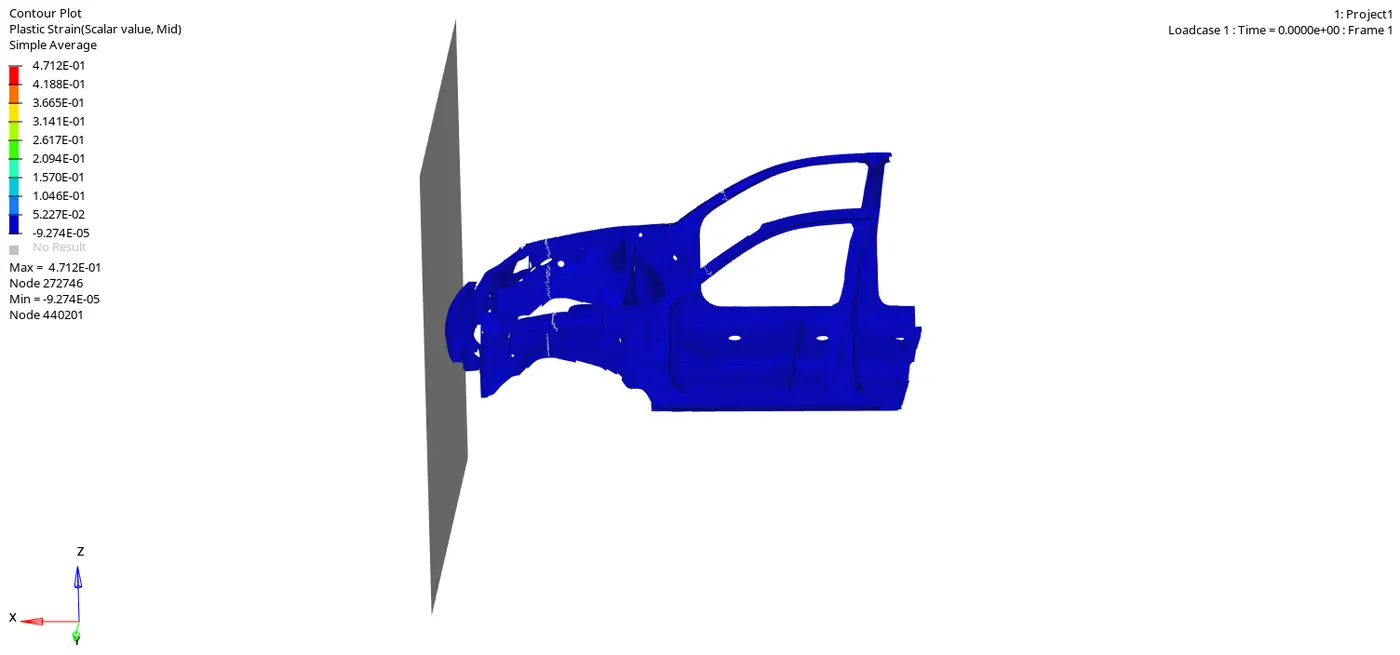
Plastic strain -
Energy plot -
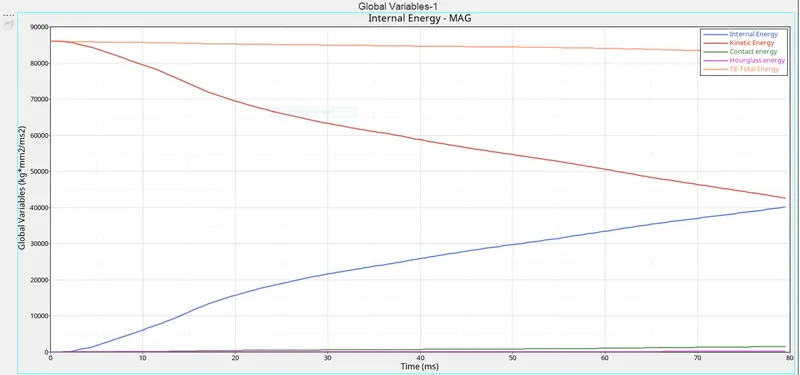
Internal energy is nothing but the Heat of the System.When the Kinetic Energy is Decreases,the Energy absorbed by the system increases . Once the Vehicle is moving with certain velocity (Say 15.646mmm/ms for the Model),initial kinetic Energy will be High(Refer Above Graph).Once the car is hit to the rigid wall,the vehicle starts deforming results in absorbing the Surrounding Energy and Stored in it.Thus the internal Energy starts increasing.At the Maximum deformation, Velocity become Zero and thus the kinetics Energy also be droping down to zero resulting there is no energy to absorb in the system.Thus the Internal Energy Remains Constant thereafter.
Once after the simulation,The maximun kinetic Energy is found at almost 85000kN/mm at t=0 and the maximun internal Energy is at 41000kN/mm at t=79.5ms.
In above graph we can see that the Hourglass energy is almost zero since we have to used Improved integrated element formulation(QEPH).So ,the hourglass energy is negligible and constant throughout the simulation.
Axial force recieved on the rail of bumper -
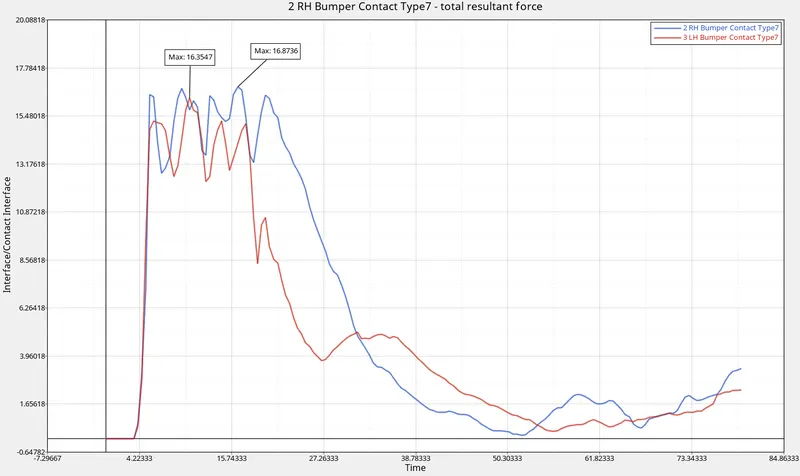
The bumper of the vehicle is the most frontal part of any vehicle. For any automotive vehcile, the bumper is known to be a vital role-playing component. The bumper should absorb as much as a force during the crash so that the other components may not get so much deform and remains safe. From the above graph, we can see that the force transfer between the bumper to the rail is nearly approx 17 KN. This value is initially high at the start of the crash but as soon as the intensity of the crash decreasing the value of the force is also found to be decreasing. Before 20 sec the force experienced by the rail is higher compared to the force experienced after 20 sec.
Shotgun cross-sectional forces -
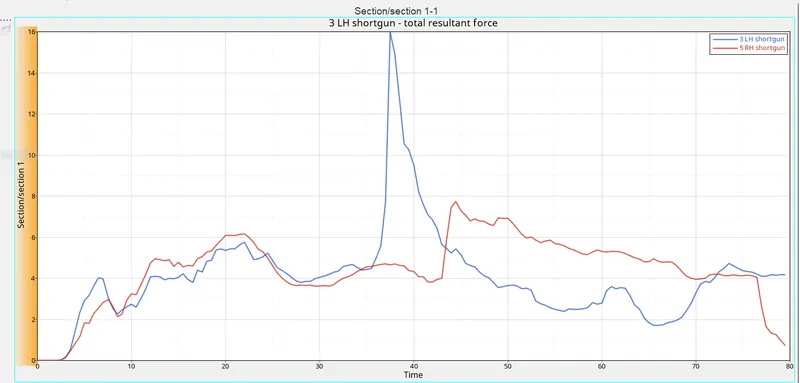
The maximum cross sectional force at Left Shotgun is 16kN/mm at t=38ms where as maximum cross sectional force at Right Shotgun is almost 8 kN/mm at t=44ms.The Force occured at the shortgun are the force transmited from the rail section.The force propogation is not same at both the rails and hence the amount of deformation at both the shotgun sections are differnt.Once the Compressive force reaches its maximum value it starts to deform rapidly.Therefore the Compressive force is decreasing as refered from the graph.As the crash contintinues,the shotgun will come into contact with Rigidwall as found in Animation,the rigid wall also exert the force directly on to the shorguns and hence there is a increase in the Sectional force as seen in graph.
A-pillar cross section -
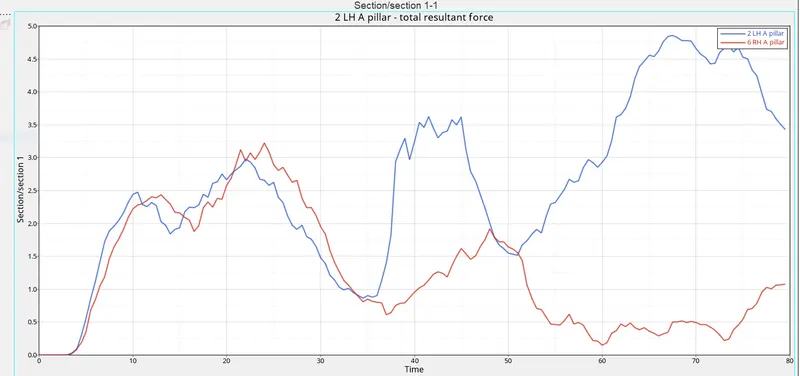
The maximum cross sectional force at Left A Pillar is 4.80kN/mm at t= 65ms whwere as maximum cross sectional force at Right A Pillar is 3.40kN/mm at t=24ms.The Force occured at the A Pillar are the force transmited from the Shotgun section.The force propogation is not same at both the Lh and Rh and hence the amount of deformation at both the A Pillar sections are differnt.Once the car bumper hits the rigid wall the compressive force is transmited from bumper to the A pillar through rail and shotguns. So Obiviously the Sectional force at A pillars are very less compared to the Section which is are front of the A Pillar as seen from the animation.Once the maximum compressive force reached,it start bending of the shotgun results in the shotgun coming in contact with Rigid wall and rigid wall in turn exert the force on the shotgun.this force is again propogates to the A Pillar hence sectional force is increasing again.
Rail cross-section -
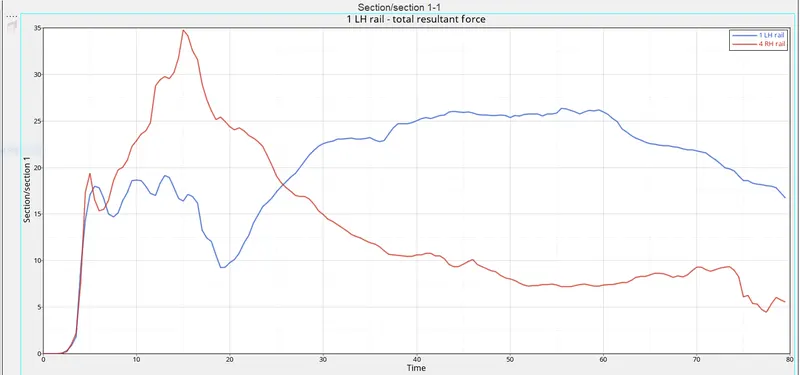
The maximum cross sectional force at Left Rail is 26kN/mm at t= 55ms whwere as maximum cross sectional force at Right rail is 35kN/mm at t=15.5ms.The Force occured at the shortgun are the force transmited from the rail section.The force propogation is not same at both the rails and hence the amount of deformation at both the shotgun sections are differnt.Once the Compressive force reaches its maximum value it starts to deform rapidly.Therefore the Compressive force is decreasing as refered from the graph.
Acceleration curve received on the accelerometer at base of B pillar (on B pillar rocker) -
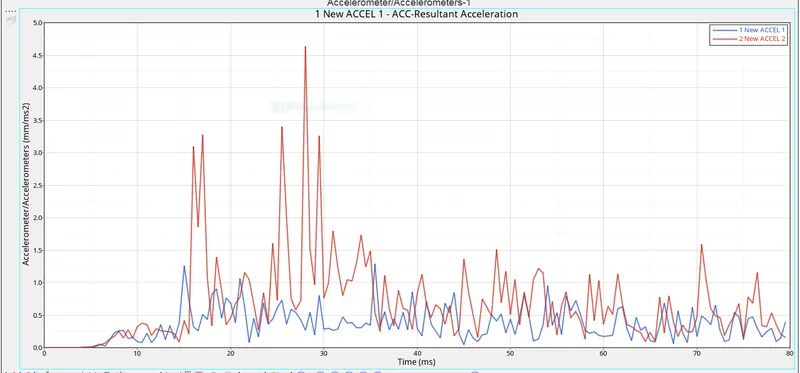
From the above graph, we can see that the acceleration is recorded in the accelerometer on the B-Pillar Rocker Arms. This acceleration is recorded on behalf of the initial velocity given to the vehicle. We can see clearly from the above two graphs that there is very much difference in the value of the recorded acceleration. This is due to the retardation of the vehicle at various velocities at various sides. In figure 1 there is less acceleration recorded as this side component is deforming completely and this side is getting retarded at a faster rate than the 2nd side. On the other hand, on the 2nd side of the vehicle, the retardation is at a slower rate so there seems to be a higher spike in the acceleration due to the slower retardation rate.
Intrusions on the dash wall 66695,66244 -
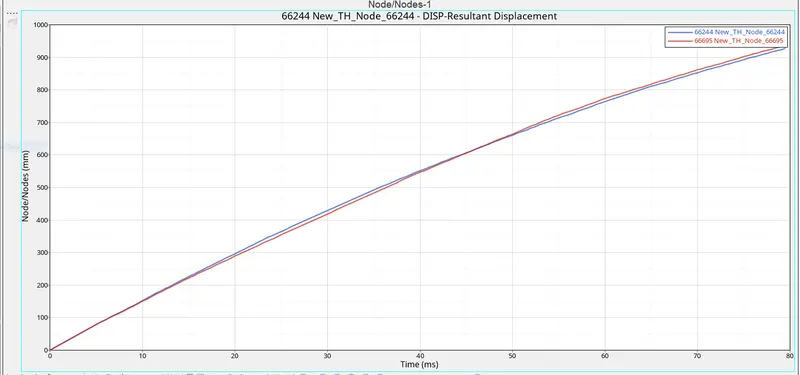
Here we can see that after the frontal impact the intrusion is recorded in the form of displacement. This intrusion node 66695 & 66244 are near the driver brake and acceleration pedal. As there are no other components in the front section of the vehicle like the absence of Engine, Radiator, etc there is very huge deformation recorded at this intrusion node. This can be fixed after fixing the other parts under the hood of the vehicle.
Intrusion at this particular node is calculated in order to check the safety of the driver due to the deformation occured at the front portion of the vehicle.From the above graph we can see that the maximum intrusion occured in the spring(Node 66695,121739) during crash is 936mm and maximum intrusion occured in the spring(Node 66695,121739) during crash is 927mm. From the animation we can notice that there is so much deformation occured at this location. Hence we can coclude that there is a more injuries will happen to the Passenger/driver.
CONCLUSION - BIW structure design as the way that it dissipate the impact energy by crumpling or crushing as well as transfer it around the occupant chamber such that least damage is to be done for driver and passenger.