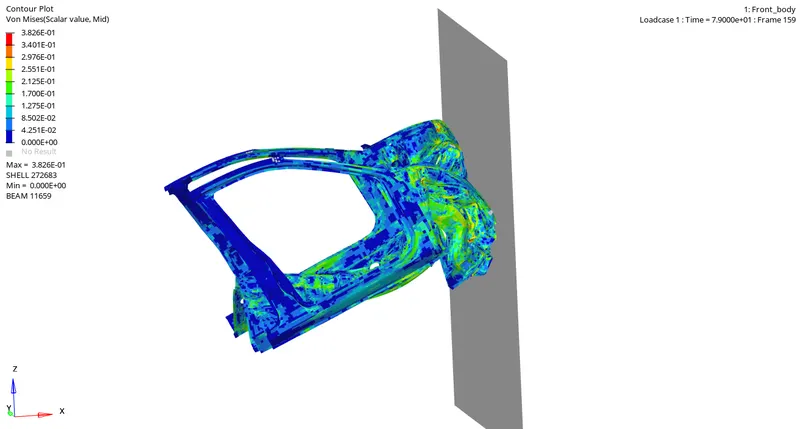
Front Impact Crash Test
AIM:
To perform the crash analysis for the given model and notify the energy difference.
METHODOLOGY:
- Importing the model.
- Checking the units and changes made if any.
- Create the required parameters and cross sections.
- Plot the graphs with different energies.
INTRODUCTION:
A car is made of different materials and parts. to test those materials and parts crashworthiness is done. It tells how much the car absorb the energy when it get crash and we are testing how much energy is distributed to different parts.
PROCEDURE:
- Import the .hm file.
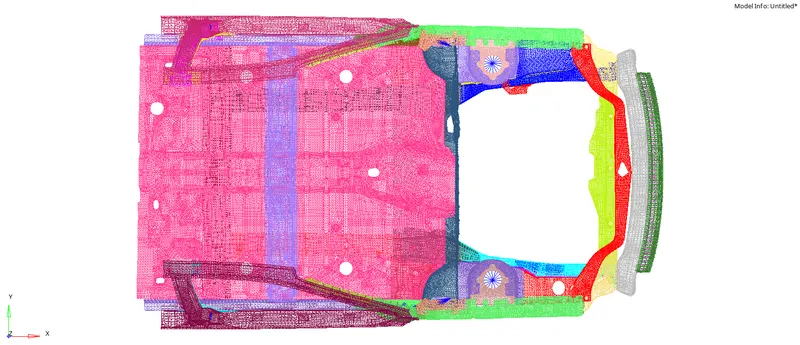 3
3
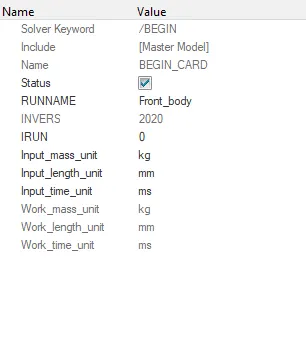
- Check the units in BEGIN _CARD.
- Units to be followed as “Mass(kg), Length (mm), Time (ms)”.
INTERFACE:
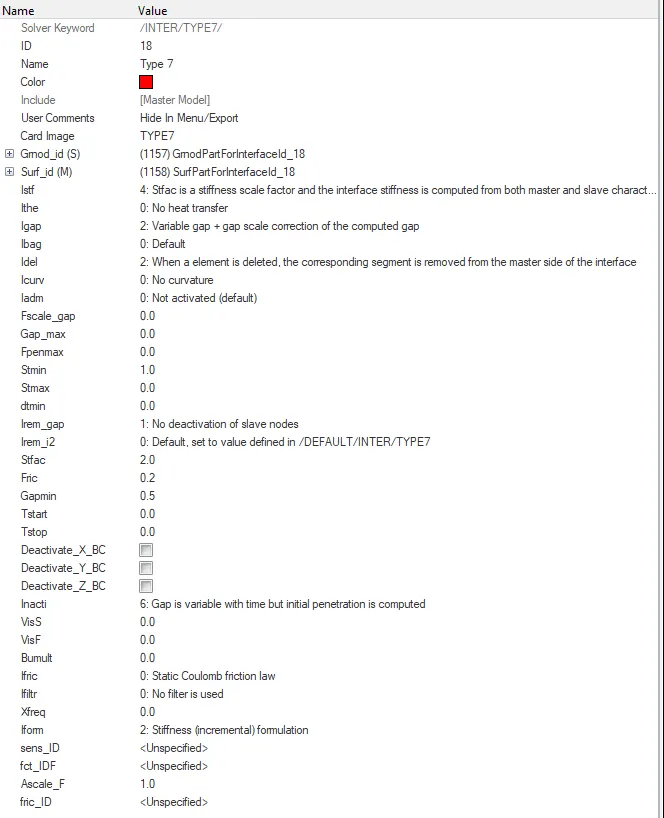
- New Interface is created and name it type 7.
- Change the card type to TYPE 7 and modify the necessary parameters.
- Select the Slave entities and Master Elements.
- Give the values of Istf (stiffness definition) as 4, Igap (gap/element option) as 2, Idel (Nodes and segment deletion) as 2, Irem_gap () as 2, Irem_i2 () as 0, stfac () as 2, Fric () as 0.2, Gapmin () as 0.5, Inacti () as 6, Iform () as 2.
RIGID WALL:
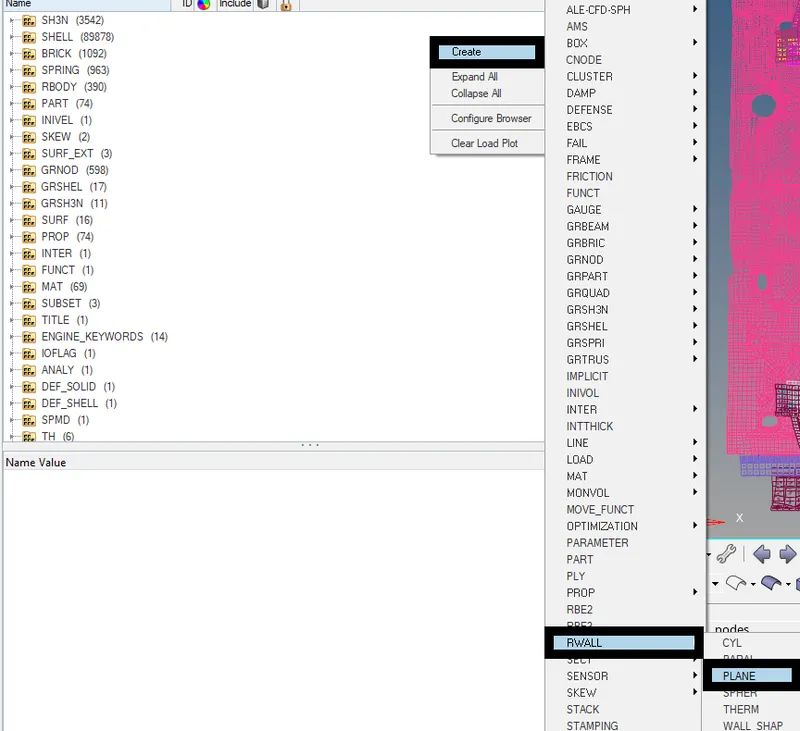
- Create a rigid wall by right click on tab area and RWALL.
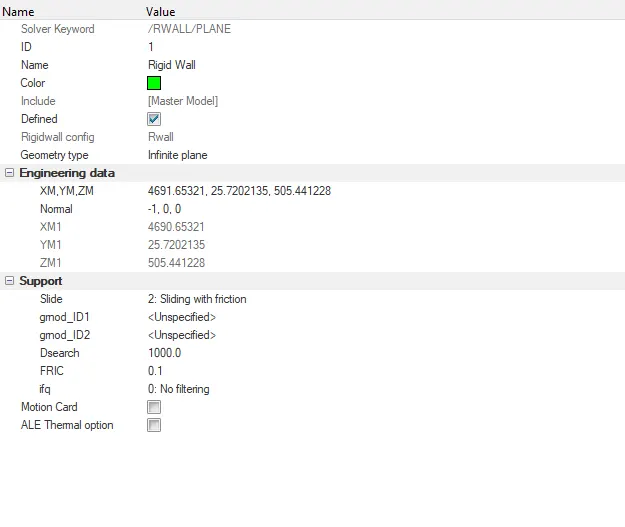
- Select the geometry type as ‘Infinite plane’.
- Set the coordinates with selected base node for creating rigid wall.
- Select the Normal around the axis as per requirement.
- Give the Slide value as 2, Dsearch value as 1000, Fric Value as 0.1.
COG point:
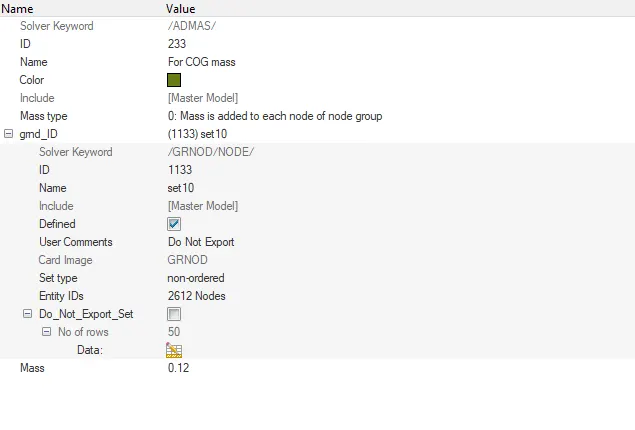
- Check the COG point and modifies accordingly by adding node mass.
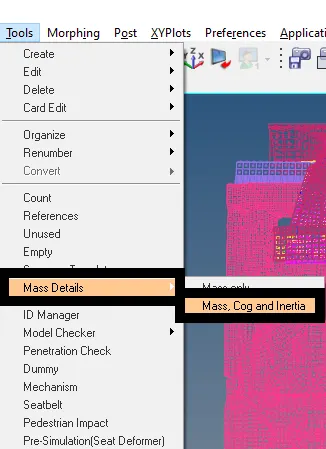
- Go to Tools menu, click on Mass Details and select the Mass,inertia and COG.
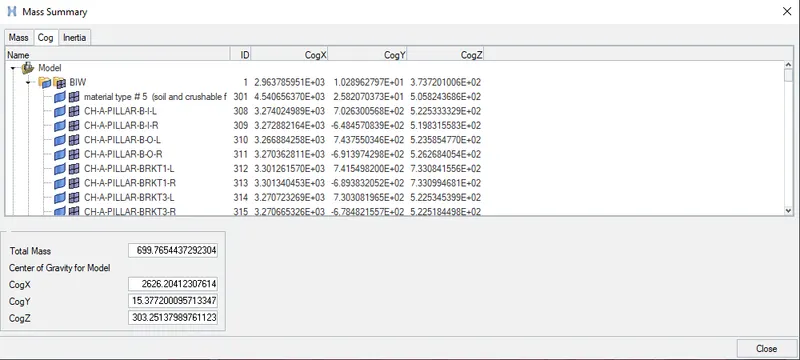
- A dialogue box pop up and check for the COG coordinates.
- Copy those coordinates and create a new node with those coordinates.
- If COG is not in required position the node mass is to be added.

- Right click on tab area and select ADMAS, a new card is created.
- Right click on gmd_ID and select create.
- Select the nodes for adding the mass with approx mass value.
INITIAL VELOCITY:
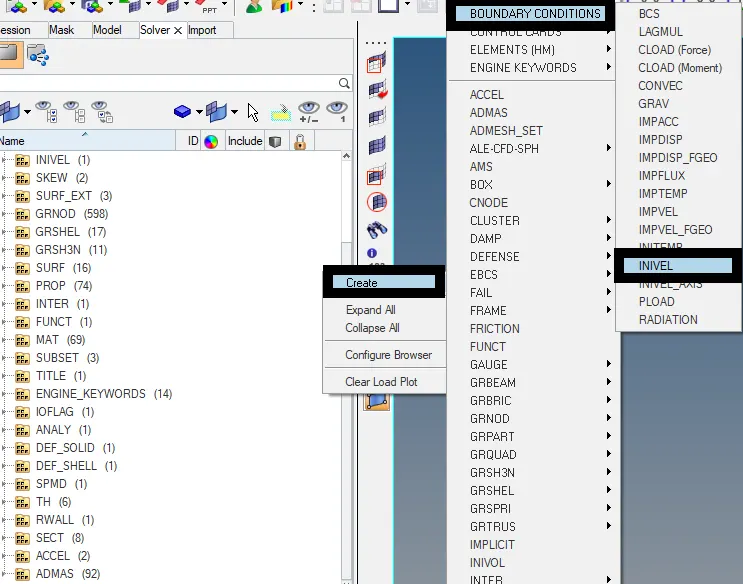
- Right click on tab area, select the BOUNDARY CONDITIONS.
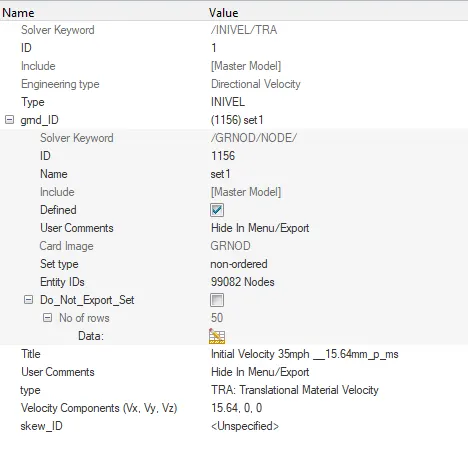
- Select INIVEL, a new card is created.
- Right click on gmd_ID and select create.
- Select the displayed nodes and click proceed.
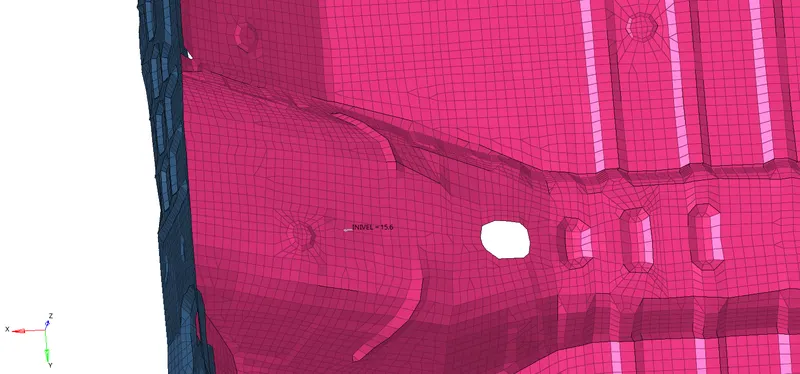
- Set the velocity value as 15.64 mm/ms (35mph as per question).
- Select the nodes for direction of velocity.
CROSS-SECTIONS:
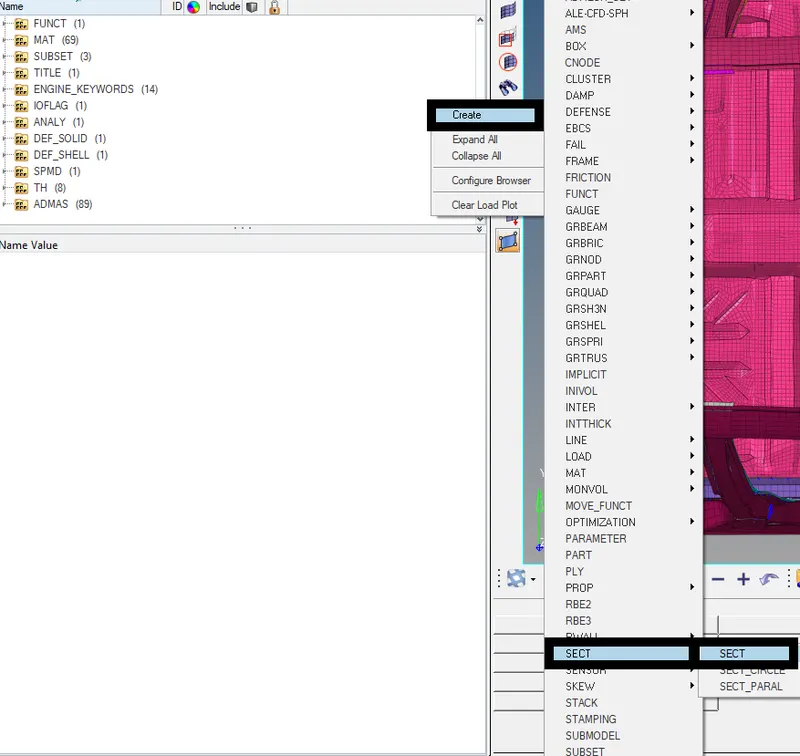
- Right click on tab area, select SECT in create menu.
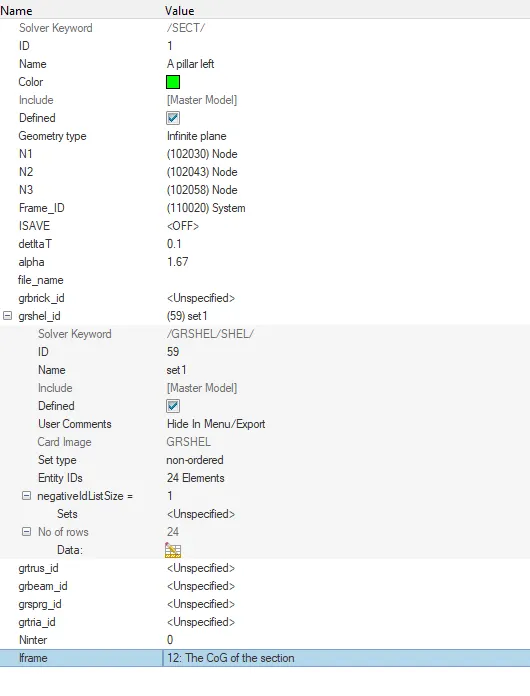
- New card is created, select three nodes for N1, N2, N3.
- Right click on gmd_ID and select create.
- Click on Entity ID’s, select the nodes for cross sections.
- Give the deltaT value as 0.1 and alpha value as 1.67.
- Right click on grshel_ID and select elements for cross sections.
- Give Iframe values as 12.
- Follow the same procedure for cross sections at different locations.
- To call out the cross sections created, click on Output blocks in Model browser.
- Create a new output block and rename it as cross sections.
- Click on Entity_ID and select all cross sections created.
ACCELEROMETERS:
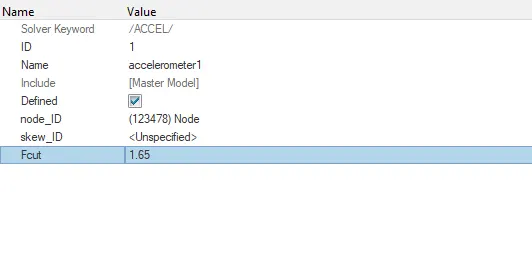
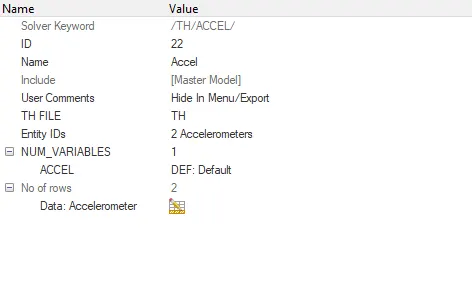
- Right click on tab area, click create and ACCEL.
- Select a node for specific locations and set Fcut value as 1.65.
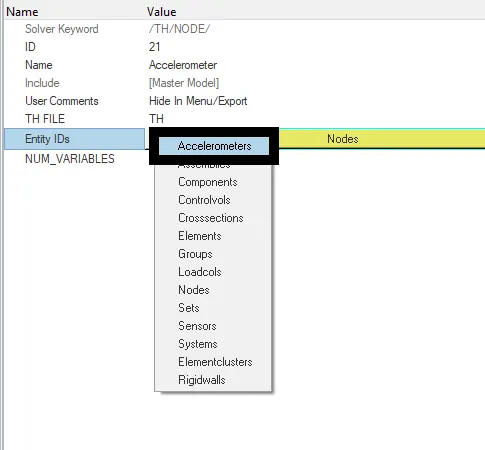
- Create a new Output block card in Model browser.
- Select Entity_ID as accelerometers and select accelerometers created.
INTRUSIONS:
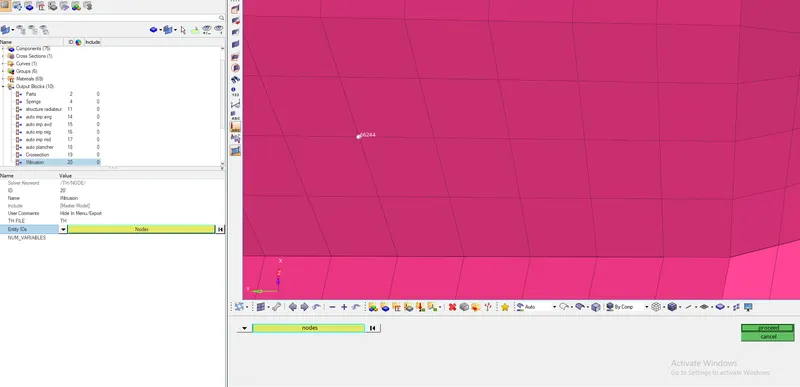
- Go to the Tools panel , click on numbers ,Select the nodes ,click on ID, give the node id as specified (given 66695, 66244) ,Click on display.
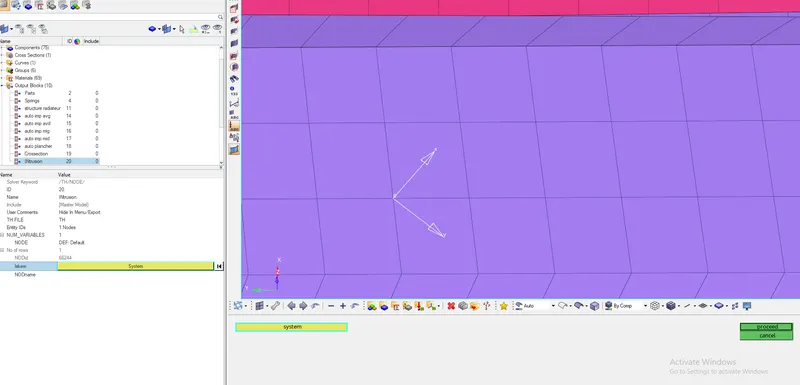
- Right click on tab area, click SKEW option, select MOV option , give a name to it ,select the nodes ( origin, axis, Plane nodes)
- Create a new Output block and rename it.
- Select the displayed node and skew system.
PENETRATION CHECK:
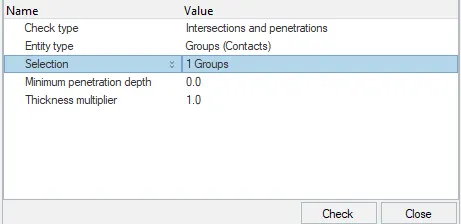
- Go to Tools, select penetration check.
- Select groups and proceed.
ERRORS:
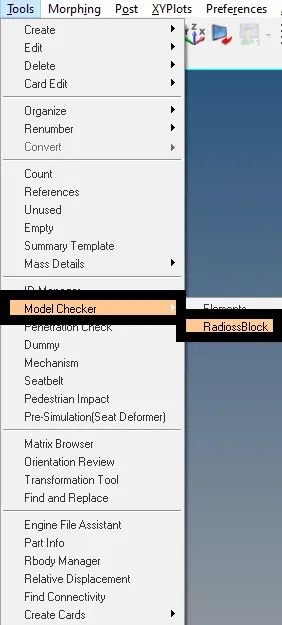
- Go to Tools, select the model checker.
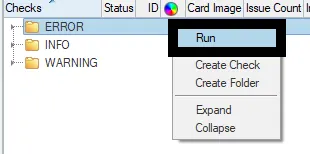
- Go to Solver Browser, right click on Error and select RUN.
- Clear errors if any.
RUNTIME & TIME STEP:
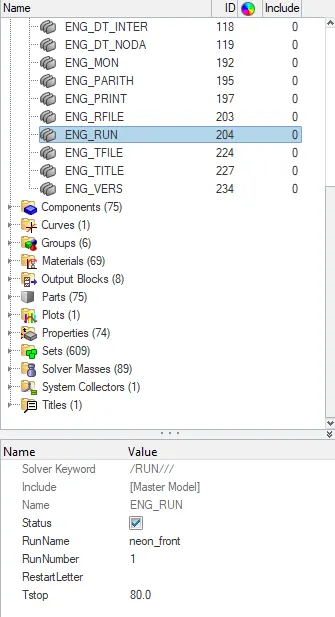
- Click on ENG_RUN in cards in model browser.
- Change the Tstop value as 80.
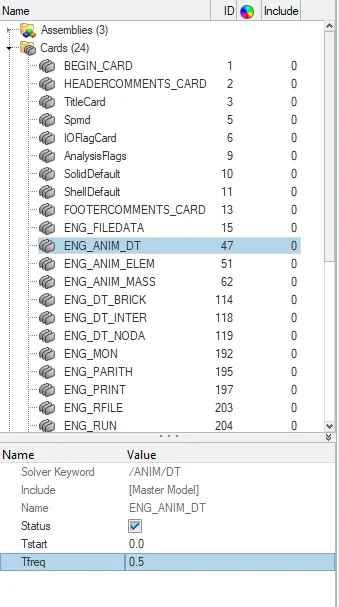
- Click on ENG_ANIM_DT and set Tfreq as 0.1.
Creating the Animation:
⦁ To create an animation, Go to the Hyper View in the Client Selector,Hyper view is opened,Select the File to view the animation (Note: File is in .h3d format in the respective case folder) Click Apply.
⦁ The animation is opened and it can be seen by clicking play in the Tool bar.

Plotting the Graph:
⦁ To plot the graph, go to the Client Selector option in the Tool Bar, Change it to Hyper Graph 2D ,The Hyper Graph is opened,Select the Data File from the respective folder ,Select Cross sections, Parts ,Internal Energy, Kinetic Energy, Total Energy, Hourglass Energy, Contact Energy ,MAG ,Click Apply.
⦁ The method is same for the other cases.
⦁ The Plots are created.

OBSERVATIONS:
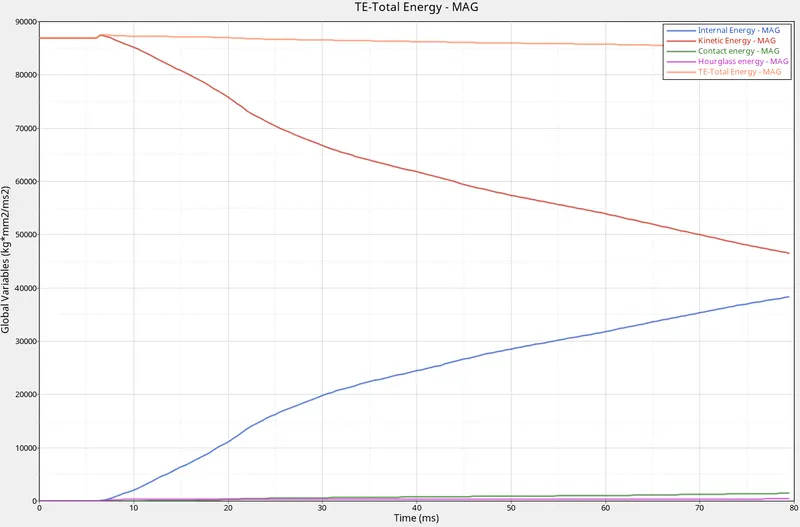
- Hourglass Energy and Contact Energy are almost contant and near to zero.
- The sum of internal and kinetic energies leads to Total Ennergy which will be high other than all energies.
- Internal Energy increases as the time goes on.
- Kinetic Energy decreases as the crash continues.
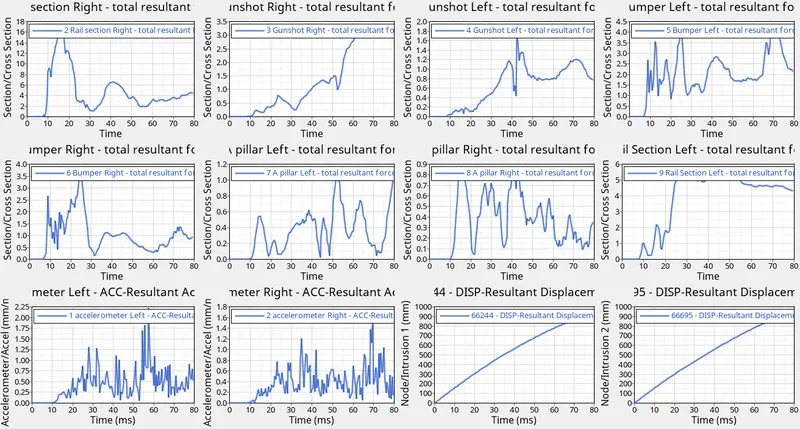
- Above graph represents the total resultant forces of cross sections created versus time.
- The last two graphs represents resultant displacement versus time graph.
DEFINITIONS:
Centre of Gravity:
The center of gravity (CG) of an object is the point at which weight is evenly dispersed and all sides are in balance. A human's center of gravity can change as he takes on different positions, but in many other objects, it's a fixed location.
Accelerometer:
An accelerometer is a tool that measures proper acceleration. Proper acceleration is the acceleration of a body in its own instantaneous rest frame; this is different from coordinate acceleration, which is acceleration in a fixed coordinate system.
LEARNING OUTCOME:
Learned how to create Intrusions
- Interface
- Accelerometer
- Initial Velovity
- Rigid wall
- Cross sections.
- CoG
Learnt how to check errors and rectify it.
RESULTS:
The Simulation is completed successfully.
The Plotting of graphs is achieved successfully.
Energy Plots:
The energy plots are created between hourglass energy, Total Energy, Kinetic Energy, Internal Energy, and Contact energy versus Time.
Section Plots:
The plots for the cross-sections have different displacement values as the different components have different stresses acting upon it while performing a crash analysis.