Frontal Crash Analysis Simulation on the BIW Component of the Car
AIM: To Perform the Frontal crash analysis simulation on the BIW component of the car with given Output requests.
OBJECTIVES:
- Check unit system and either follow[Mg mm s] or [Kg mm ms].
- Create an appropriate interface, friction 0.2 and recommended parameters.
- Make sure of no penetrations and intersection.
- Correct rigid bodies if any issues.
- Create a rigid wall with friction 0.1.
- Compare the model weight with the full-scale 300k nodes model and use added masses to reach target weight of 700kg while getting CG about the required range.
- Initial velocity 35 mph.
- Use model checker to ensure good quality.
- Time-step :0.5 to 0.1 microseconds.
- Run 80 ms.
OUTPUT REQUESTS:
- Sectional force in the rails at the location of indicated node 174247.
- The axial force received on the rails from the bumper.
- Shotgun cross-sectional forces.
- A pillar cross-section.
- Acceleration curve received on the accelerometer at base of B pillar (on B pillar rocker).
- Intrusions on the dash wall 66695,66244.
PROCEDURE:
- First, import the file and make sure that we should follow the same unit [Kg mm ms] system throughout the simulation.
- Then define the self contact to the whole body select all slave nodes and master nodes as well as shown in the below image
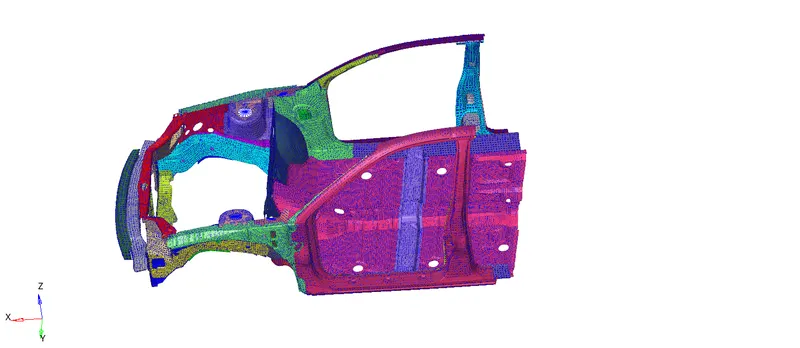
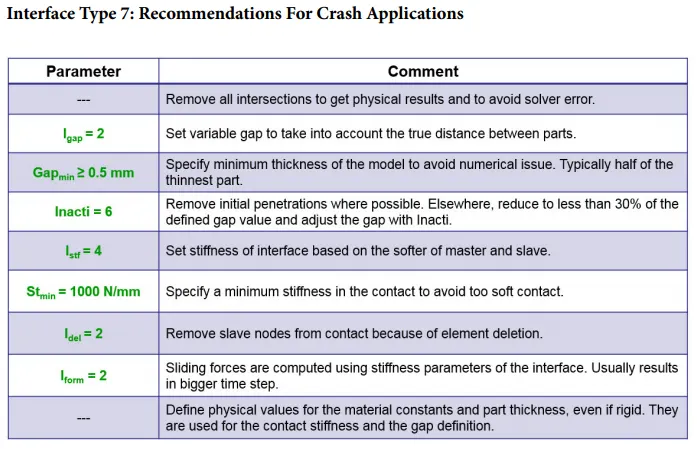
- And minimum stiffness we have to give the 1 we can convert newton to kilonewton with type7 interface self contact and we should give the friction is 0.2.
3.Then we suppose to check the penetrations and intersections check for that Tools>penetrations check as shown in the below
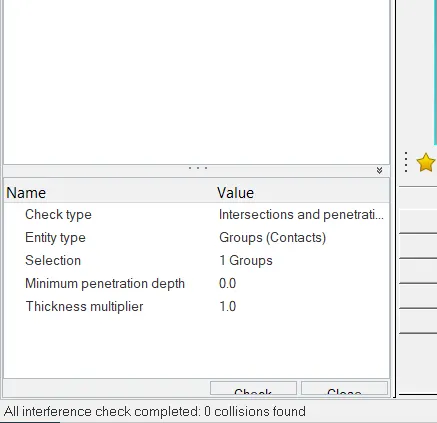
4.We should correct the rigid bodies if any issues are there that means we should not have any flying components without connections.
5.We should create the rigid wall with friction(0.2) for that BCS>create the rigid wall >enter the required parameters.
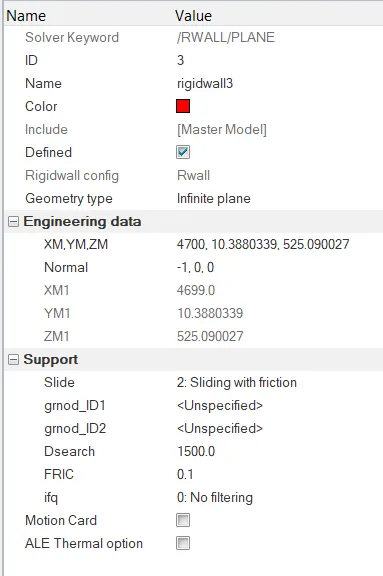
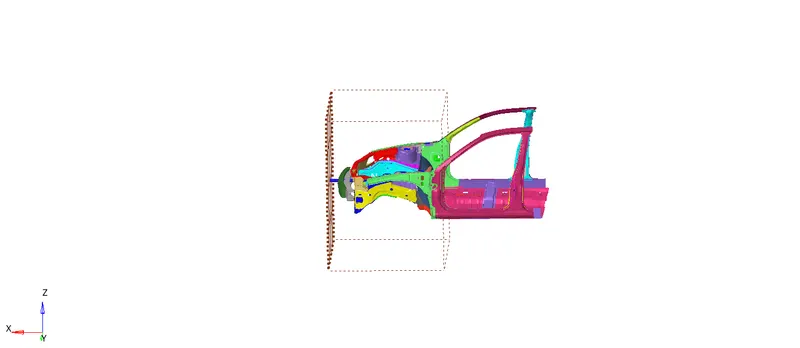
- A rigid wall is defined by a surface type and a group of slave nodes,the slave nodes tpo a rigid wall can be defined as a group of nodes and as nodes initially at a distance less than the distance(Dsearch) from the rigid wall.
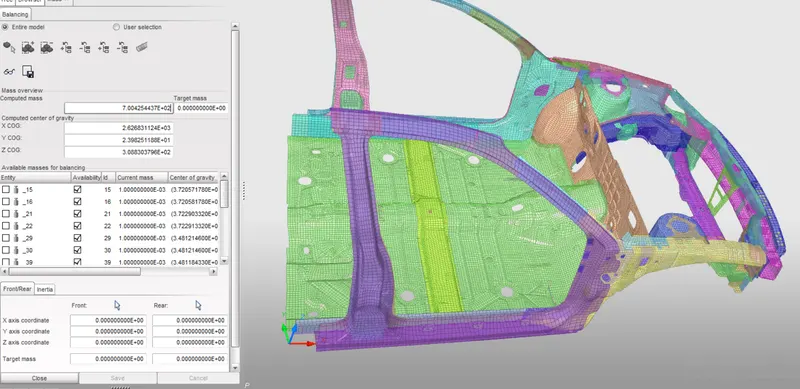
6.Compare the model weight with the full-scale 300k nodes model and use added masses to reach target weight 700kg while getting CG about the required range.
- Here we are comparing the full model with the half model to reach target weight of 700kg as shown below image.
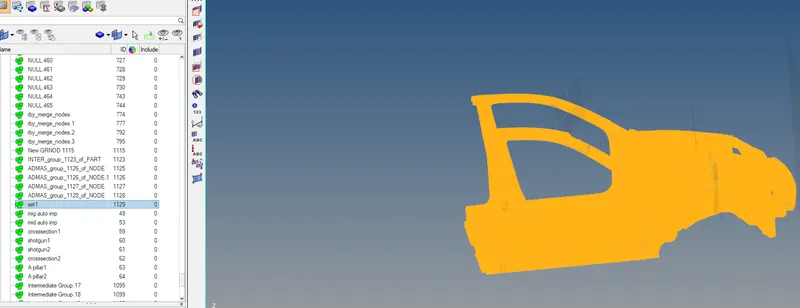
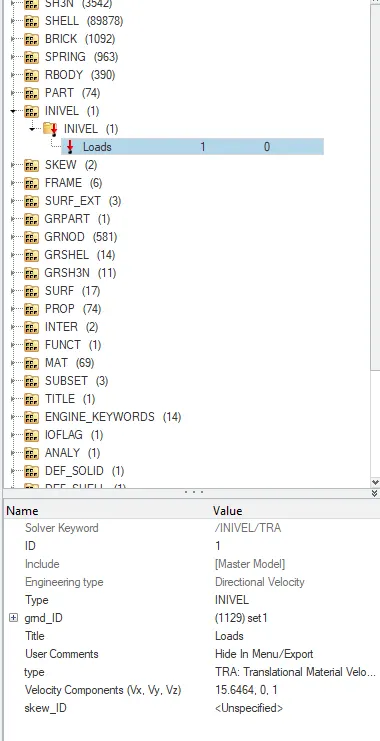
7.Giving the initial velocity of(35mph =15.6464mm/ms
- Here we are giving the initial velocity to the over all nodes in the given component for the Create the set in the model>inthat set we have to select all nodes which are in the component as shown below.
- After that go to the solver browser then we can create>BCS>INIVEL then there we can give the set and the initial velocity(15.6464) as shown the below.
8.Use model checker to ensure good quality
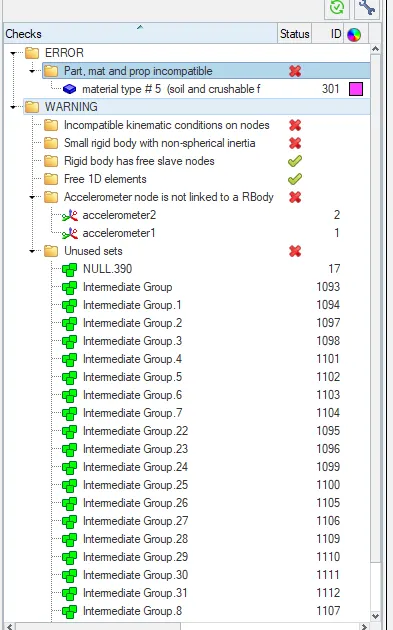
- Go to the tools >model checker>run it if there is any unsupported cards are we can remove it there is any error we can debug it.
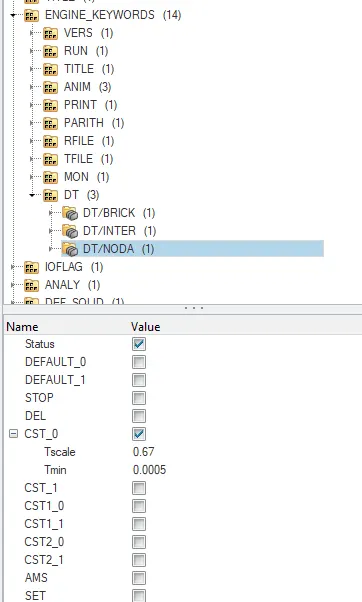
9.We have to give the time step:0.5 to 0.1 microseconds.
- For this we can goto slover>Engine key words>DT>DT/NODA there we can change the time step to the 0.0005msecs as shown in the below image.
Now we can go with the Output Requests:
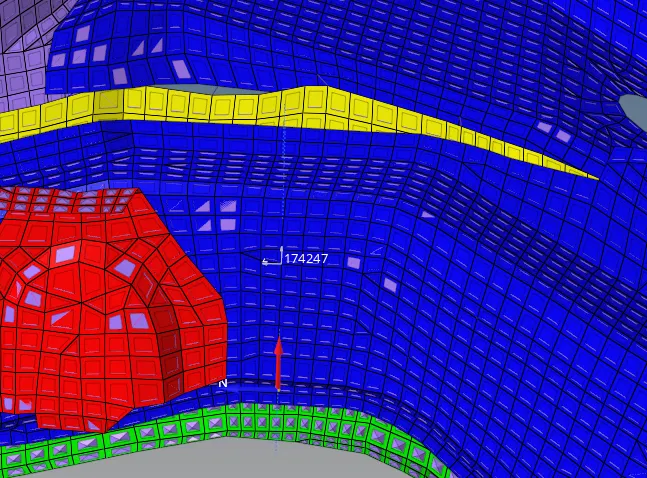
1.Section force in the rails at the location of the indicated node (174247)
- First, we have to find the given node Id that is Tools>nodes>By ID >enter the given number the node is displaced like shown in the below image.
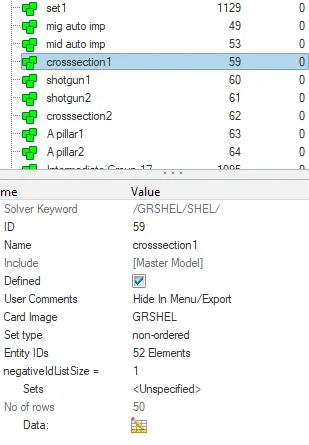
- Then we have to make cross-sections for six parts to observe the sections force in each part in the component.
- To create the section first we have to select some set of elements to make a set(Create>set) as shown in the below image
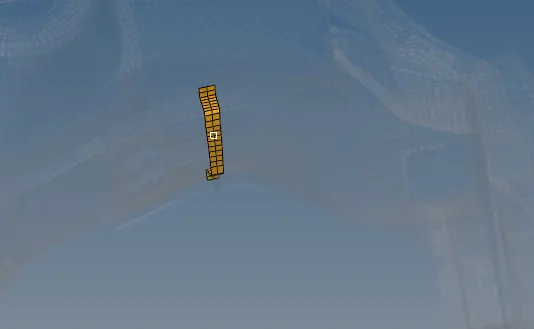
- Then we have to go to the solver then we should create the frame for that (create>frame >moveframe)here we are created the frame for all six parts in the component.
- Then we have to create the section to do the crosssection in the component(create>section)here we are created the section for all six parts in the component.
- Here we have to feed the frames(N1, N2 and N3) to the sections (N1, N2 and N3) as shown in the below image and we can select the frame Id over there as shown in the below image.
- Here the z_axis will be normal to the rigid body because we are interested in calculating the force in the cross-section.
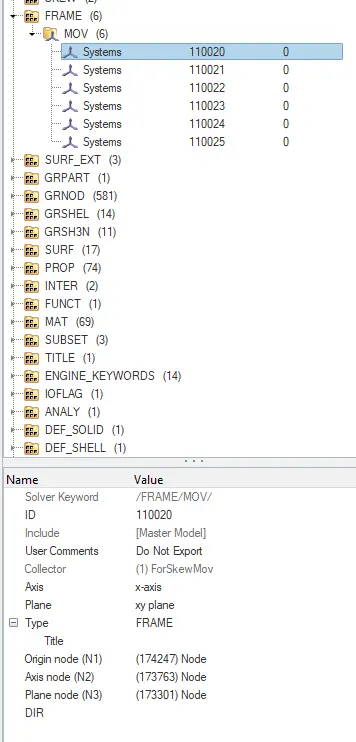
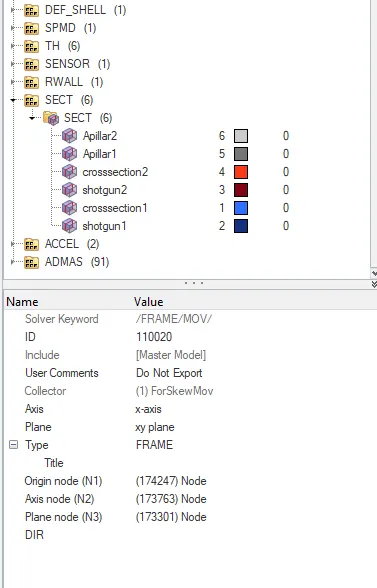
- After that we can select the frame id >system>then select the frame there we can get the visible crosssection over there in the part.
- Similarly, we can do the same thing for the remaining five parts that will show in the below image.
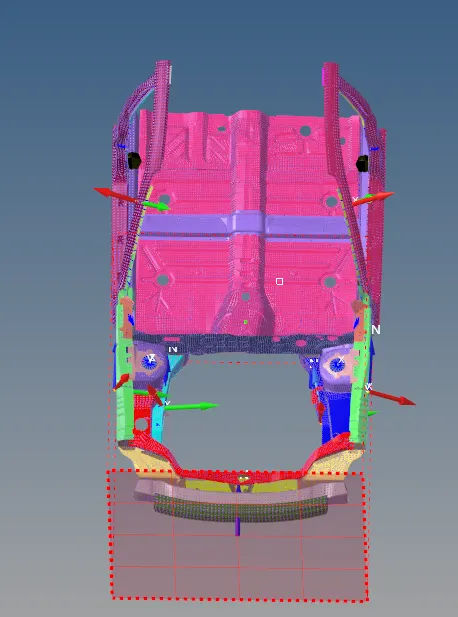
2.Axial force received on the rails from bumper:
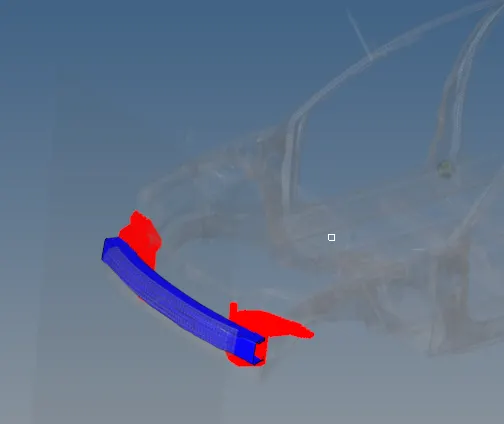
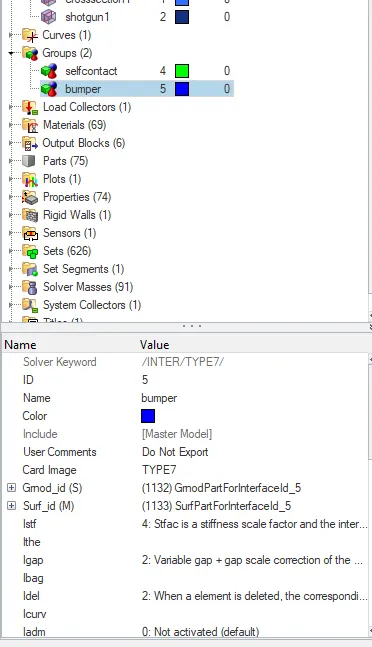
- For that, we can select the bumper as the master and then before that there is a small two rail components is there that should be the slave as shown in the below images.
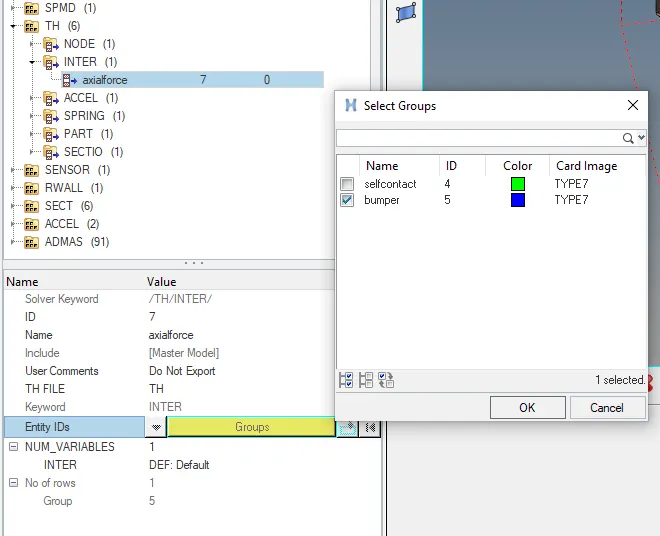
- After creating the well-defined type7 interface with(with recommended parameters) then go to the solver there we can create the TH part for that bumper to represent the Axial load as shown in the images.
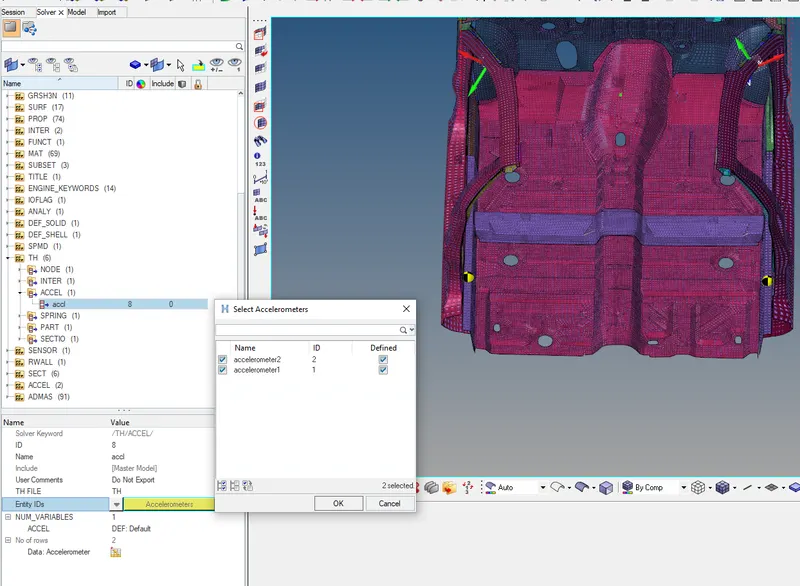
3.Acceleration curve received on the accelerometers:
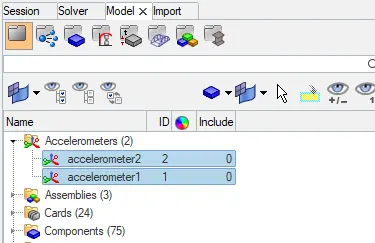
- For the observation of the acceleration we need accelerometer sensors to calculate the acceleration over there for that we are kept the accelerometers at the backside of the rails as shown in the below images.
4.Intrusions on the dash wall 66695/66244:
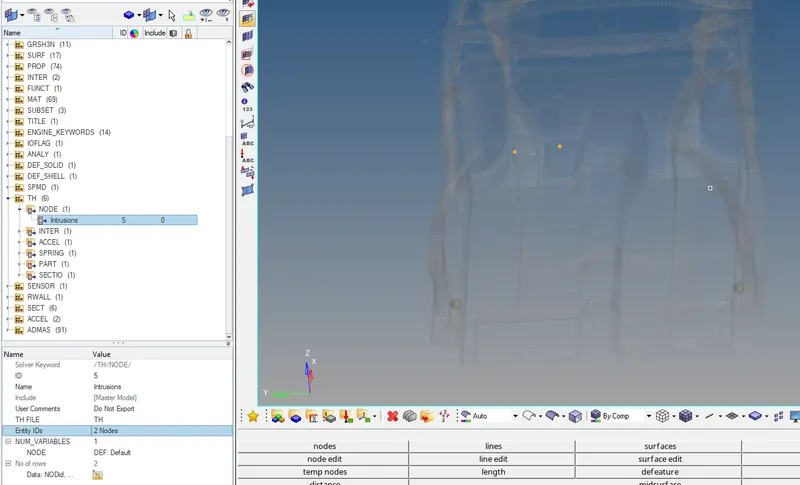
- To create the intrusions they given the two-node Ids for that >goto slover>TH>node>enter the two Ids and name it as the intrusions.
PLOTTING THE RESULTS:
ANIMATION:
1.Cross-section Force for the rail components:
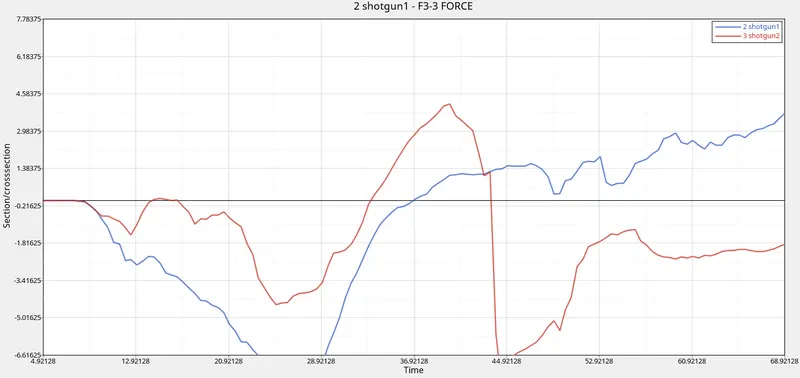
2.Cross-section Force for the Shotgun components:
3.Cross-section Force for the A&B pillar components:
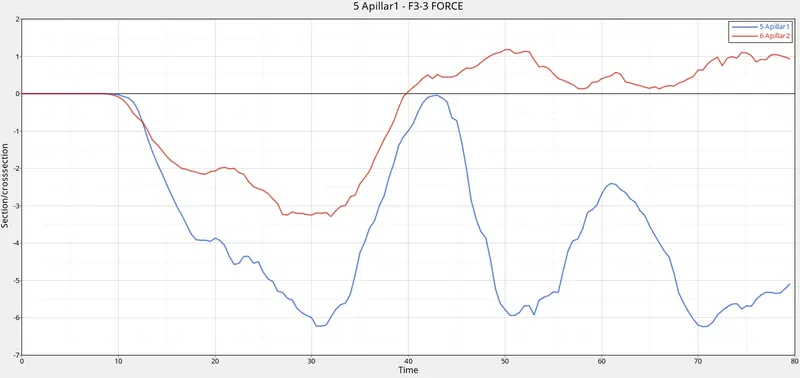
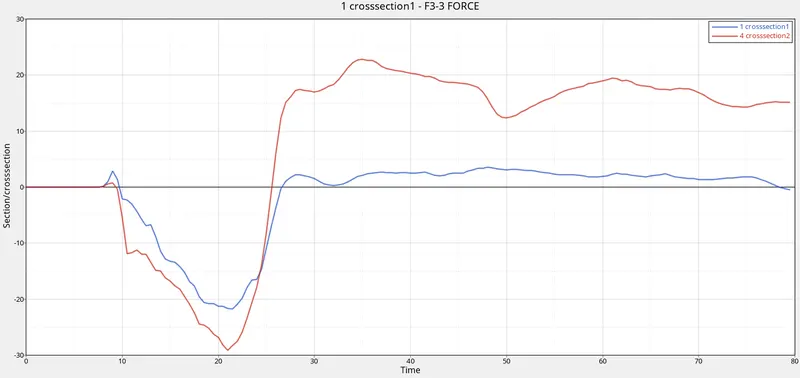
- When we observe the above graphs forces are acting in negative and positive directions on the cross-sections because there we created the moving frames so that when the deformation occurs the frame also move to that direction so that the force vector direction will change w.r.t the direction of deformation.
- Here we can observe the section force on pillars, rails and shotguns as shown in the above graphs.
4.Axial force received on the rails from the bumper:
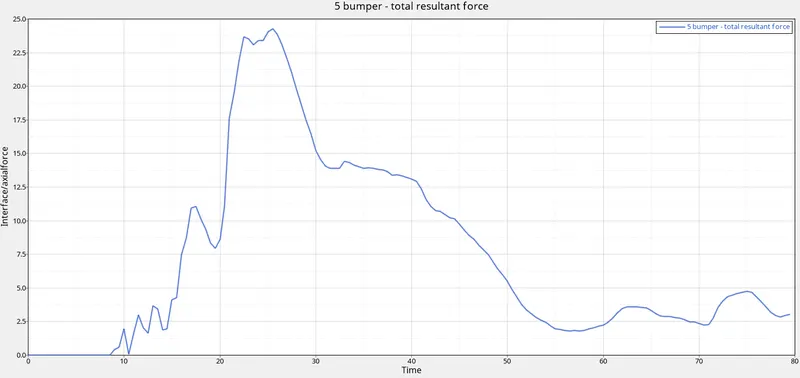
- Here we observed that up to 9secs the axial force is 0 but after 10 secs it is increasing because at the time of 10th sec the bumper will hit the rigid wall then that force is transferred to the rail component then again decreasing the curve due to the rail component already crushed.
- The maximum Axial force received on the rails from bumper is 23KN.
5.Acceleration curve received on the accelerometer at the given parts:
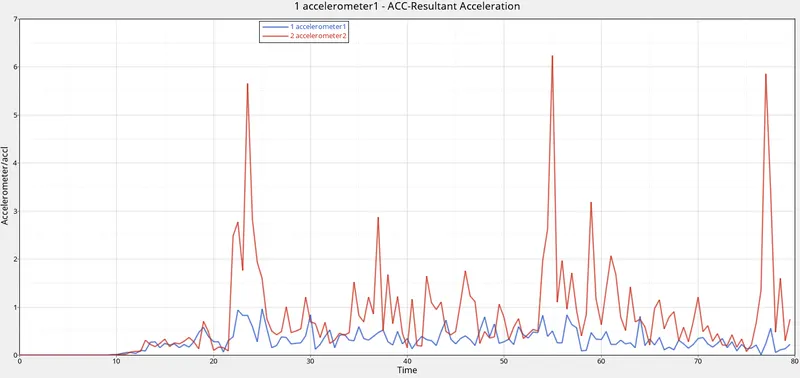
- If we observe in the above graph accelerometer2 receives more acceleration than the accelerometer1 that means at the accelerometer2 side the crush is happening more rapidly than the accelerometer1 side.
- Therefore we can say that accelerometer2 recevies the more acceleration(6.5mm/(ms)2).
6.we should found the displacement over intrusions on the dash wall at given nodes 66695/66244
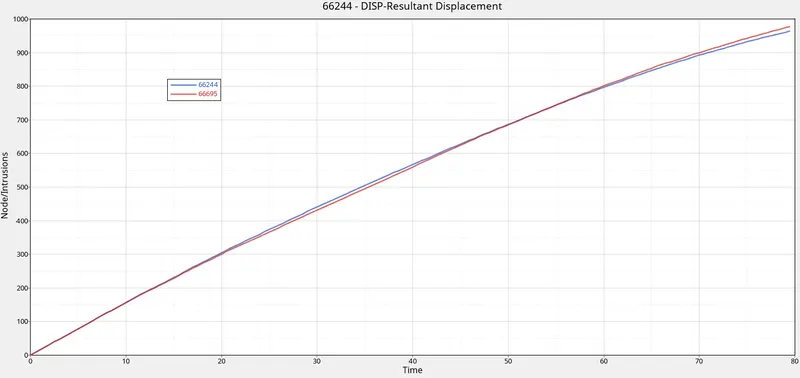
- If you observe the above graph it is increasing somewhat linearly so that we can say the crush happens that particular node displacement increases linearly as shown in the above graph.
- The maximum displacement of the two nodes is "960mm".
PLOTTING THE ENERGIES:
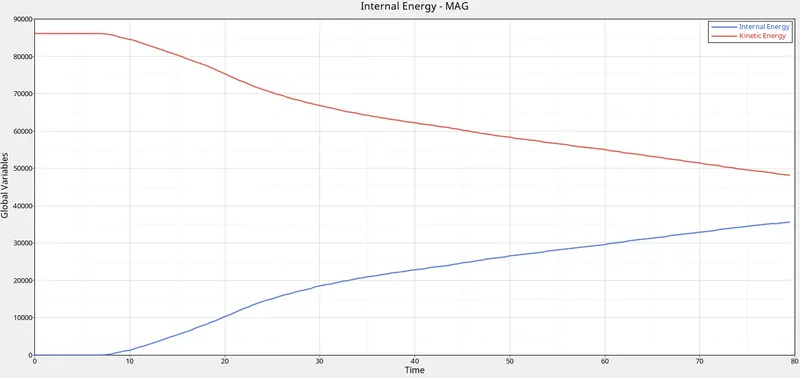
1.Internal and kinetic energy:
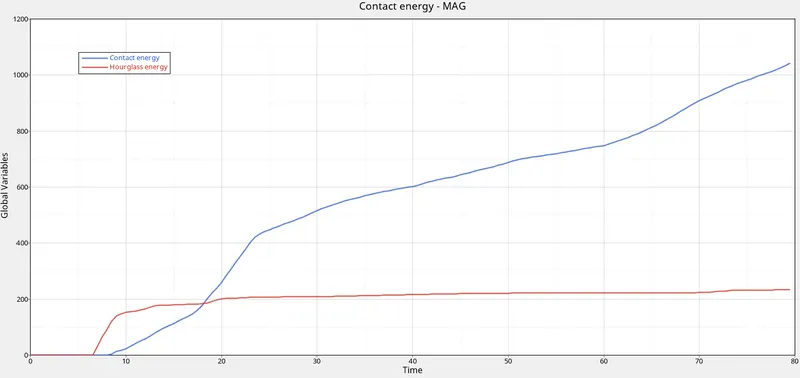
2.Hourglass and contact energy:
3.Contact energy:
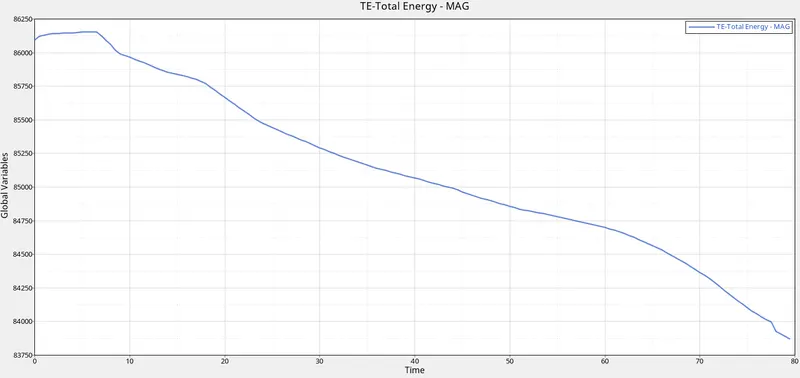
- As we know, the kinetic energy is decreasing and internal energy is increasing as usual in the above graph.
- Same as contact energy is also increasing and some hourglass energy is there in the above graph.
- Then Total energy is decreasing it is the sum of internal energy and kinetic energy.
CONCLUSION:
- When we observe the above graphs forces are acting in negative and positive directions on the cross-sections because there we created the moving frames so that when the deformation occurs the frame also move to that direction so that the force vector direction will change w.r.t the direction of deformation.
- The maximum Axial force received on the rails from bumper is 23KN.
- If we observe in the above graph accelerometer2 recevies the more acceleration than the accelerometer1 that means at the accelerometer2 side the crush is happening more rapidly than the accelerometer1 side.
- Therefore we can say that accelerometer2 recevies the more acceleration(6.5mm/(ms)2).
- If you observe the above graph it is increasing somewhat linearly so that we can say the crush happens that particular node displacement increases linearly as shown in the above graph.
- The maximum displacement of the two nodes is "960mm".
LEARNING OUTCOMES:
1.I understood how to create the skews and frames on the component.
2.Calculating the Axial force and section force.
3.Creating sensors like Accelerometer and Intrusions at particular nodes.