Crash-worthiness of Frontal Crash Test of the BIW
Aim:
To perform computer model Crashworthiness Crash test for Front Impact Analysis on the BIW Structure of Automotive Vehicle using HYPER-MESH & RADIOSS.
Objective:
The objective is to analyze the BIW (Body in White) with the front crash analysis and check for the impact of this front crash on the BIW structure in the high-velocity crash.
Study of the forces received energy generated and displacement on the various cross-sections of the BIW and study of the various energy plots after running the simulation.
Abstract:
- Check the unit system and either follow[Mg mm s] or [Kg mm ms].
- Create an appropriate interface, friction 0.2, and recommended parameters.
- Make sure of no penetrations and intersections.
- Correct rigid bodies if any issues.
- Create a rigid wall with friction 0.1.
- Compare the model weight with the full-scale 300k nodes model and use added masses to reach the target weight of 700kg while getting CG about the required range.
- Initial velocity 35 mph.
- Use a model checker to ensure good quality.
- Time-step :0.5 to 0.1 microseconds.
- Run 80 ms
Introduction:
What is a crash test?
A crash test is a form of destructive testing usually performed to ensure safe design standards in crashworthiness and crash compatibility for various modes of transportation or related systems and components.
Types of Crash Test:
- Frontal-impact tests: Front Impact test is what most people initially think of when asked about a crash test. Vehicles usually impact a solid concrete wall at a specified speed, but these can also be vehicles impacting vehicle tests. SUVs have been singled out in these tests for a while, due to the high ride-height that they often have.
- Moderate Overlap tests: Moderate Overlap tests in which only part of the front of the car impacts with a barrier (vehicle). These are important, as impact forces (approximately) remain the same as with a frontal impact test, but a smaller fraction of the car is required to absorb all of the force.
- Small Overlap tests: Small Overlap tests this is where only a small portion of the car's structure strikes an object such as a pole or a tree, or if a car were to clip another car. This is the most demanding test because it loads the most force onto the structure of the car at any given speed. These are usually conducted at 15-20% of the front vehicle structure.
- Side-impact tests: Side Impact test these forms of accidents have a very significant likelihood of fatality, as cars do not have a significant crumple zone to absorb the impact forces before an occupant is injured.
- Pole-impact tests: A difficult test that places a large amount of force on a small proportion of the side of the vehicle.
- Roll-over tests: A rollover test tests a car's ability (specifically the pillars holding the roof) to support itself in a dynamic impact. More recently, dynamic rollover tests have been proposed in place of static crush testing (video).
- Roadside hardware crash tests: Roadside hardware crash test is used to ensure crash barriers and crash cushions will protect vehicle occupants from roadside hazards, and also ensure that guard rails, signposts, light poles, and similar appurtenances do not pose an undue hazard to vehicle occupants.
- Old versus new: Often an old and big car against a small and new car, or two different generations of the same car model. These tests are performed to show the advancements in crashworthiness.
- Computer model: Because of the cost of full-scale crash tests, engineers often run many simulated crash tests using computer models to refine their vehicle or barrier designs before conducting live tests.
- Sled testing: A cost-effective way of testing components such as airbags and seat belts is conducting sled crash testing. The two most common types of sled systems are reverse-firing sleds that are fired from a standstill, and decelerating sleds which are accelerated from a starting point and stopped in the crash area with a hydraulic ram. It can also be used to evaluate the whiplash protection of a vehicle's seat.
But for our study, we will just see the Front Impact of the BIW Structure. For this, we have the BIW structure available as below.
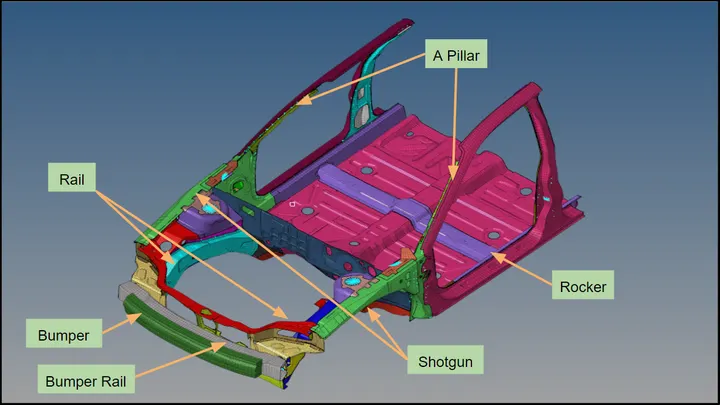
fig - BIW Structure
Model Setting -
Firstly we import the model to the hyper mesh window as below,
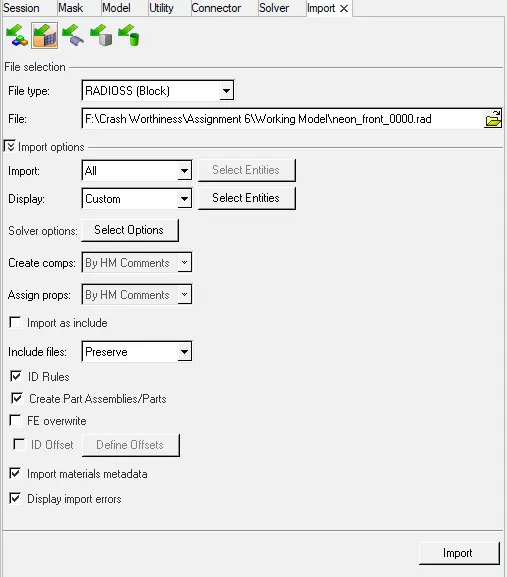
fig - Import the model
Step I - Check the unit system and either follow[Mg mm s] or [Kg mm ms]
After importing the geometry we go to check the unit system used in the rad file. For this, we open the 0000.rad file in the notepad and observe the unit system over there. The purpose of checking this unit system is important to check because if the unit consistency is different than expected the whole calculation will go wrong at the end of the project.
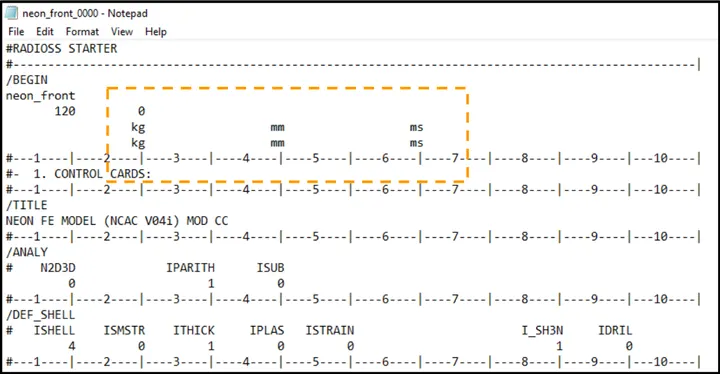
fig - Unit System
From the above image, we can see that the unit system used for this model is Kg-mm-ms which is always preferable for the industry.
Step II - Create an appropriate interface, friction 0.2, and recommended parameters.
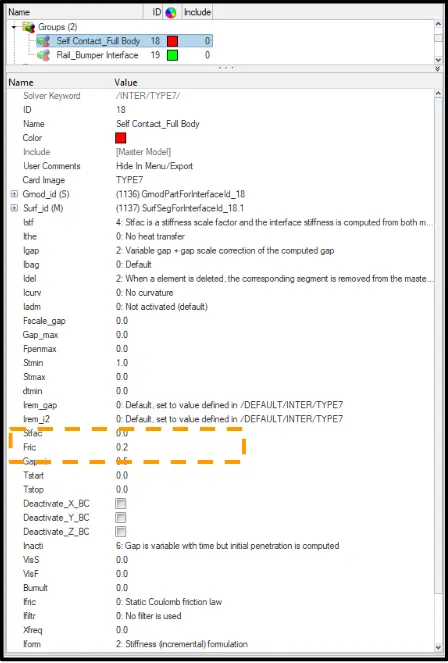
fig - Interface Creation
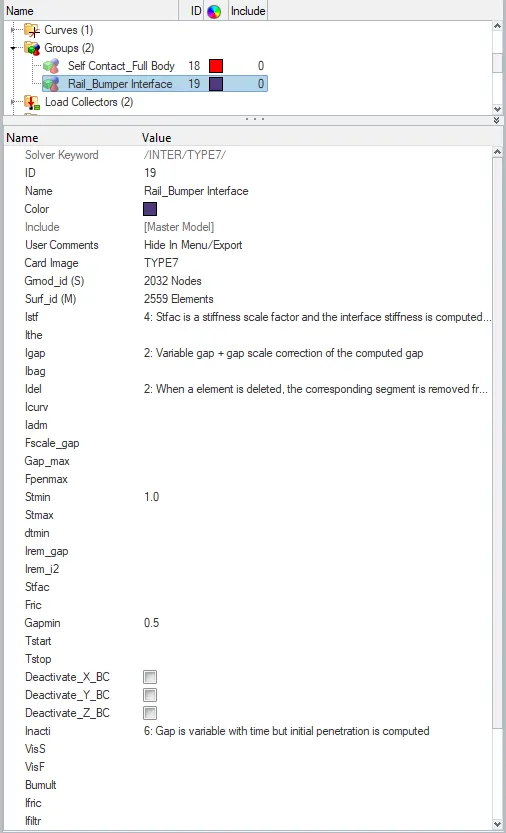
The interface card is created using Type 7 contact with the recommended properties as below and also this time friction factor is added to give some friction between the slave and master node.
|
Interface - Type 7 |
|
|
Prop |
Value |
|
Istiff |
4 |
|
Igap |
2 |
|
Idel |
2 |
|
Stmin |
1 |
|
Fric |
0.2 |
|
Gap_min |
0.5 |
|
Iform |
2 |
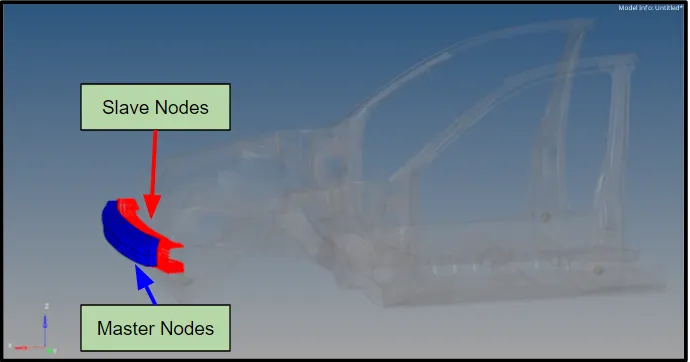
Another type 7 interface card is added to the model to ensure the contact between the bumper and the bumper rail to identity the force sustained by the rail after the impact from the rigid wall. Its properties are all same as mentioned above except for friction. The solid bumper is kept as the master node and the bumper rail is selected as the slave node. This slave and master node is selected based on the situation of impact and some criterion.
Step III - Create a rigid wall with friction 0.1.
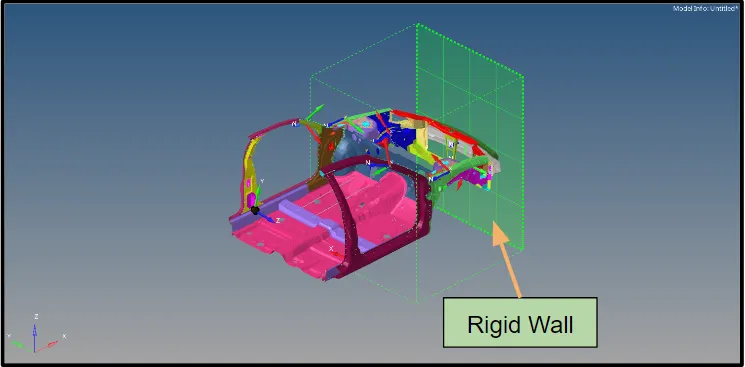
Now there is a need to create a rigid wall on which the vehicle is going to impact with some initial velocity. To create the rigid wall there is an option in the solver to create the rigid wall. So we go to solver right click and create the RWALL with below parameters and the representation of the rigid wall is shown below,
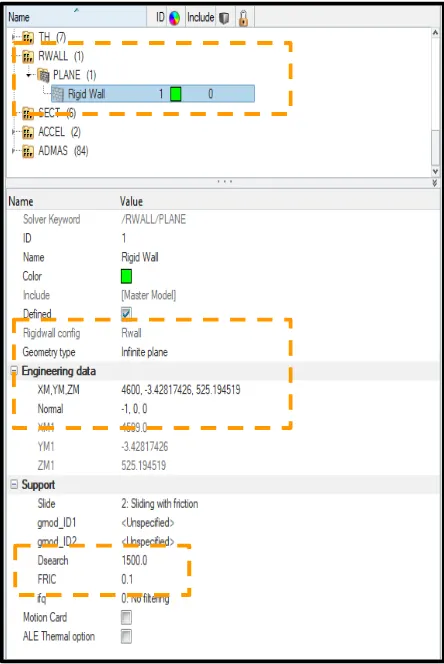
Here we can see that the geometry type used us infinite plate so that the sufficient area of impact will be available to make the impact. The coordinates of the rigid wall are created using 1 point on the front bumper and keeping the rigid wall a little away from the front bumper to avoid the penetration of the wall in the vehicle. This wall is created concerning the normal direction in the X-axis and in a negative direction that is why the value of normal x is kept as -1. To make it sliding friction wall sliding friction with 0.1 is introduced in the rigid wall with Dsearch distance of 1500. This Dsearch distance will search the slave node till this region in the model.
Step IV - Compare the model weight with the full-scale 300k nodes model and use added masses to reach the target weight of 700kg while getting CG about the required range.
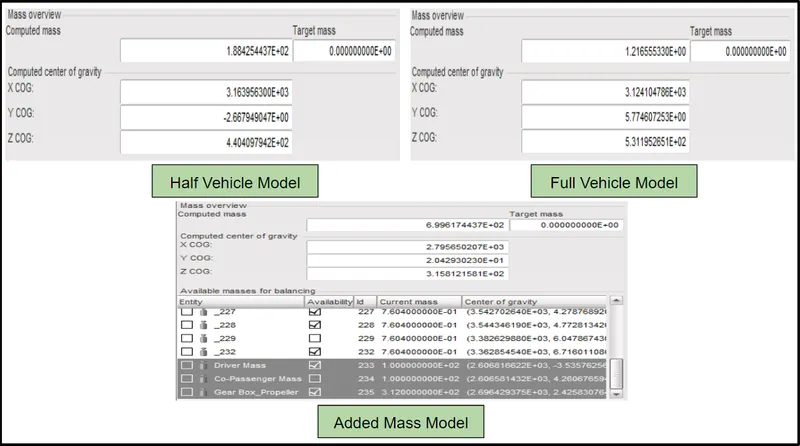
Here we can see in the reduced vehicle model that the weight of the model is around 188 Kg approx so the CG (Center of Gravity) and that of in Full Vehicle model is 1200 Kg approx so to maintain the vehicle stability during the test we have to increase the weight of the vehicle interns of added masses for Driver, Co-Passenger and miscellaneous weight like Gear Box and Propeller Shaft Weight.
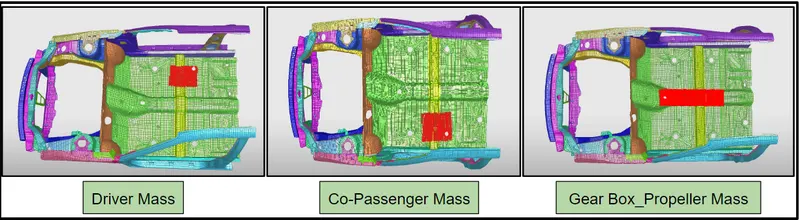
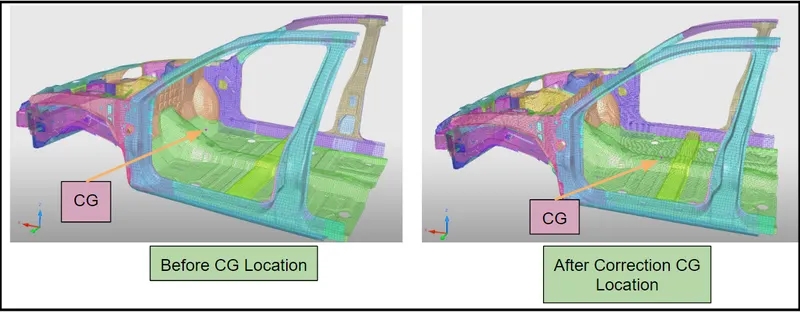
So for our instance, we consider the driver and co-passenger weight around 100Kg each and the Gear Box Propeller weight as 312 Kg so a total of 512 Kg of Added mass is added to bring the CG in the required range. As per the standard rule, the center of gravity of any model is to lie near the driver seat so by adding the added mass to the model we had achieved our CG point near the driver sear as we can see below
Step V - Initial Velocity of 35 mph
To make the impact on the rigid wall we have to introduce some initial velocity to our model. So to do this so in the solver we can introduce the initial velocity as shown below,
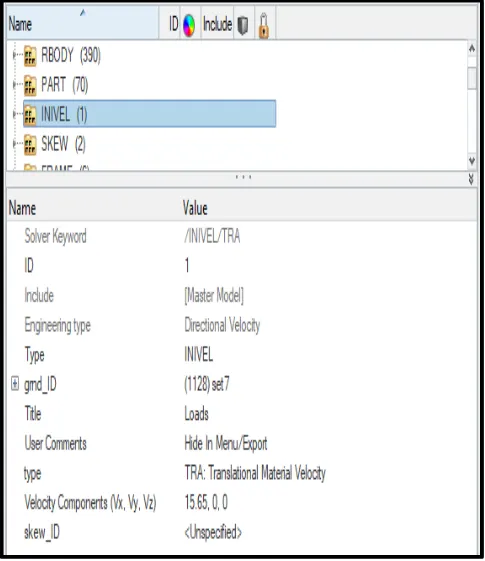
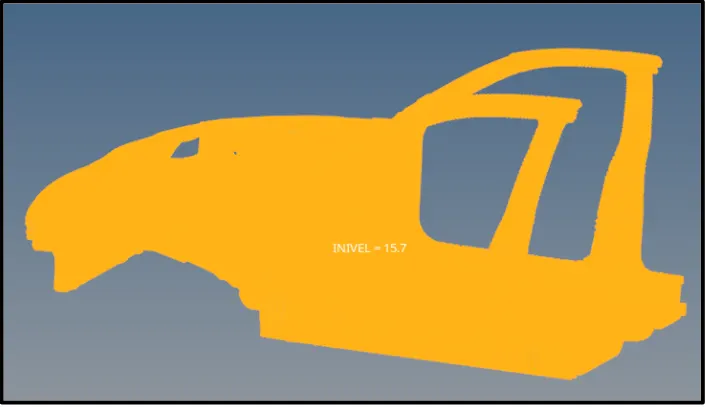
All sets of nodes in the model have been assigned with the initial velocity of 15.65 mm/ms (35 mph) and Translational velocity is assigned as a type.
Step VI - Time Step
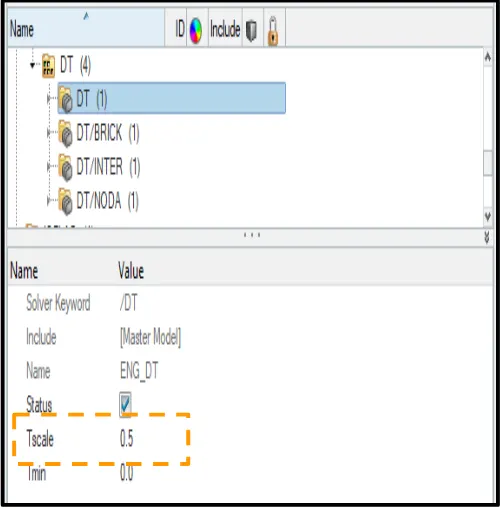
For this, we add the DT card to the solver to introduce the time step with the time scale value of 0.5. This is used to define the time step control during the computation.
Step VII - Engine Run Time
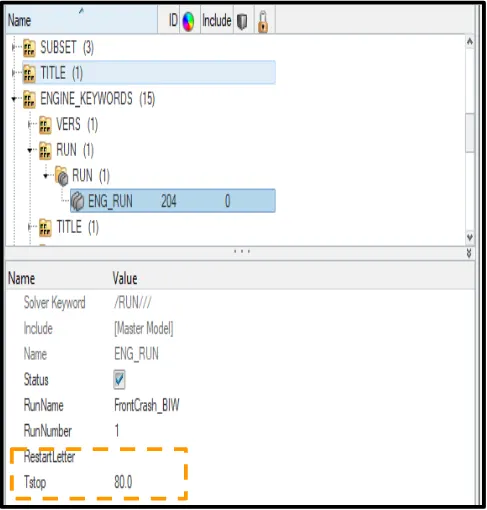
The simulation time is set to be run for 80 sec.
Output Request
The next step was to set up for the output required from simulation for this we create various cross-sections along with some areas where we want to observe the result.
1. Sectional force in the rails at the location of indicated node 174247
This section is the rail component where we have to create the section frame as shown below. For this, we create the section and add a local frame introducing the normal direction.
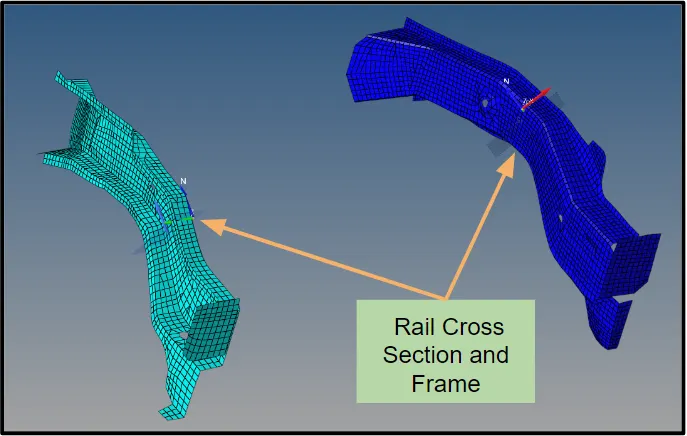
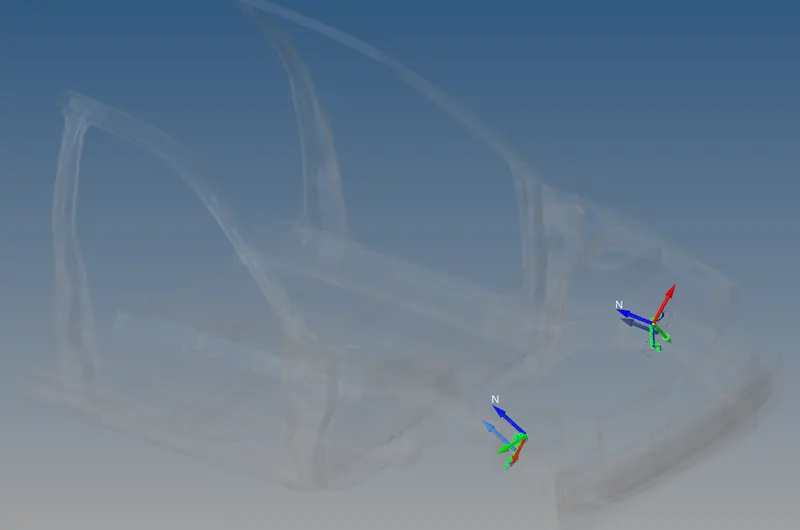
Two rows of elements are selected across which the section force has to be calculated.
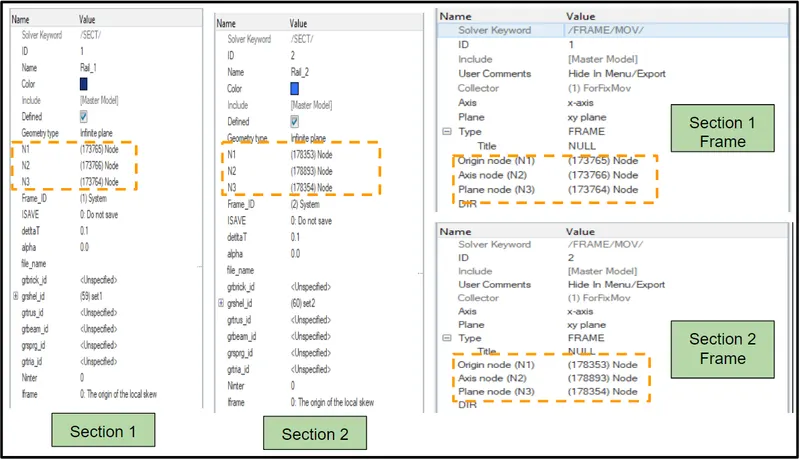
The N1, N2 & N3 is taken as reference frame nodes to calculate the force across this section.
2. Axial force received on the rails from bumper
To calculate the axial force on the rails from the bumper we have already created the interface card on the bumper and the bumper rails component above. So to measure the force across this interface we have to create the TH card with the inter keyword and select both the component as the entity.
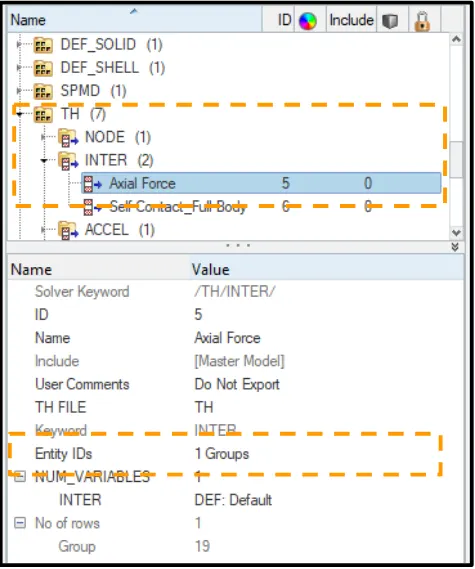
3. Shotgun cross-sectional forces
This section is the Shotgun component where we have to create the section frame as shown below. For this, we create the section and add a local frame introducing the normal direction.
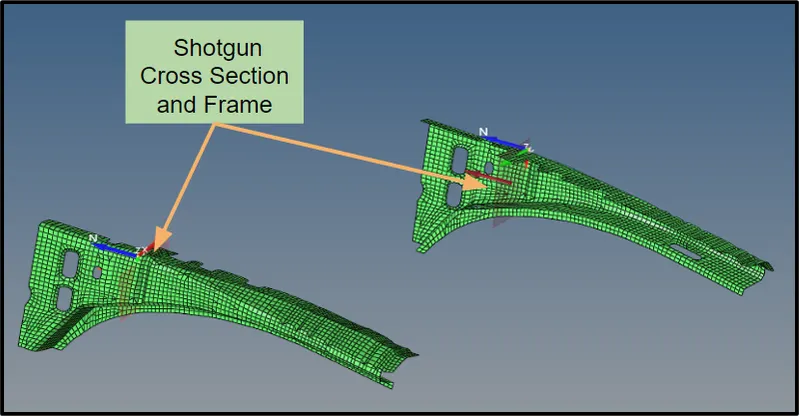
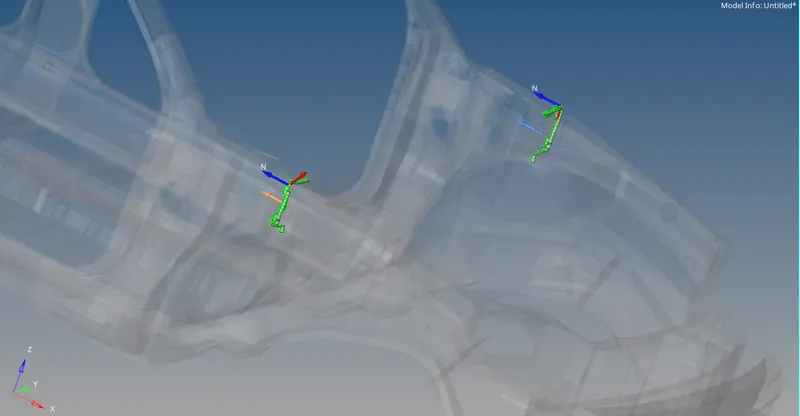
Two rows of elements are selected across which the section force has to be calculated.
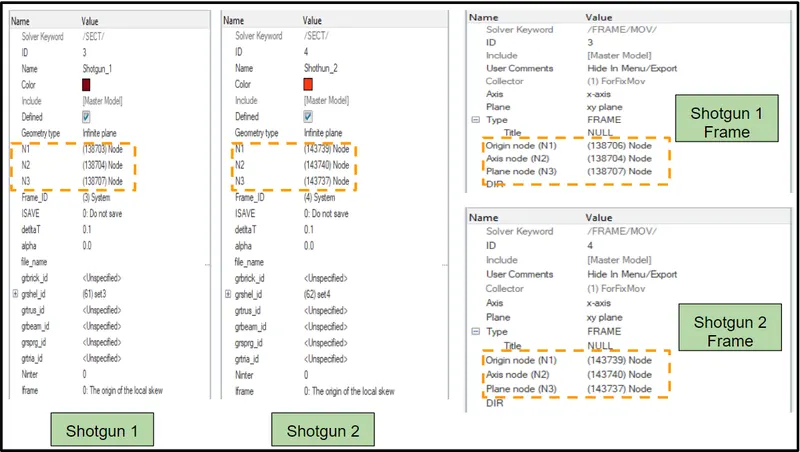
The N1, N2 & N3 is taken as reference frame nodes to calculate the force across this section.
4. A-pillar cross-section
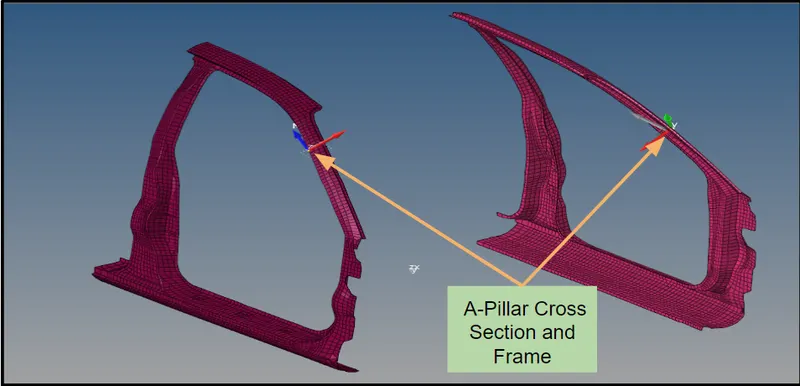
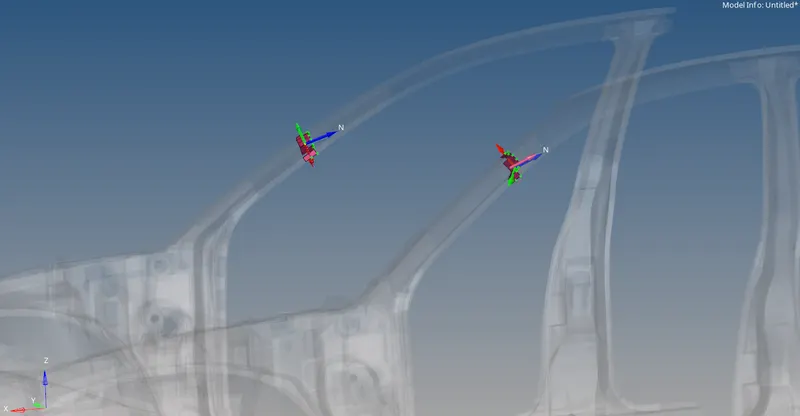
Two rows of elements are selected across which the section force has to be calculated.
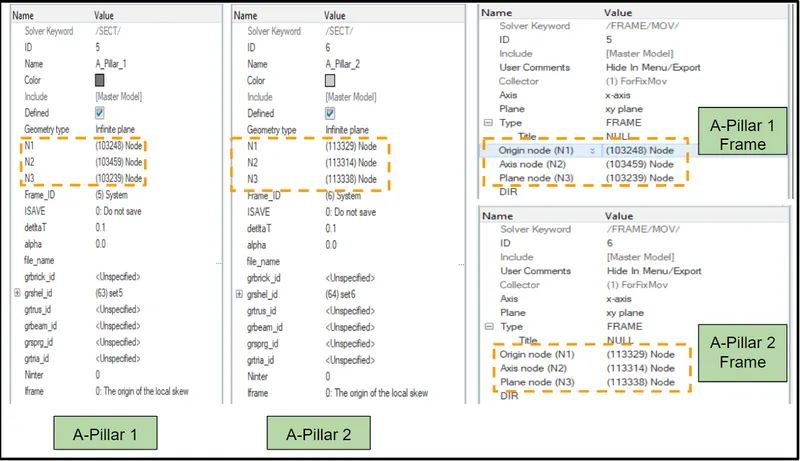
The N1, N2 & N3 is taken as reference frame nodes to calculate the force across this section.
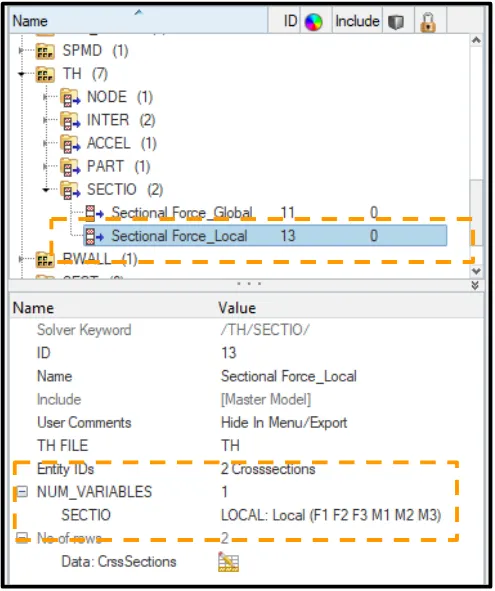
After taking all the sections we have to introduce the TH card for calculating the section force across the section. Voila, you can calculate the force using this TH in Hypergraph.
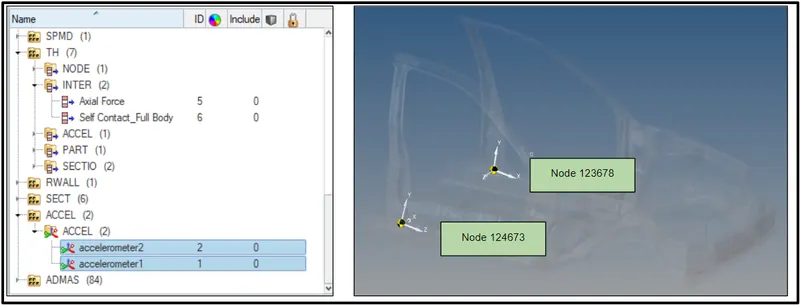
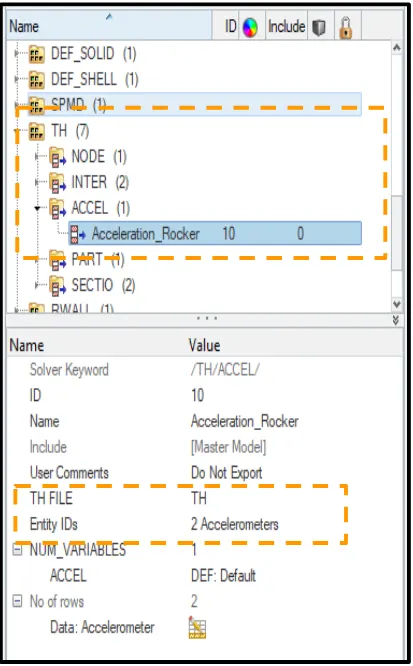
5. Acceleration curve received on the accelerometer at base of B pillar (on B pillar rocker)
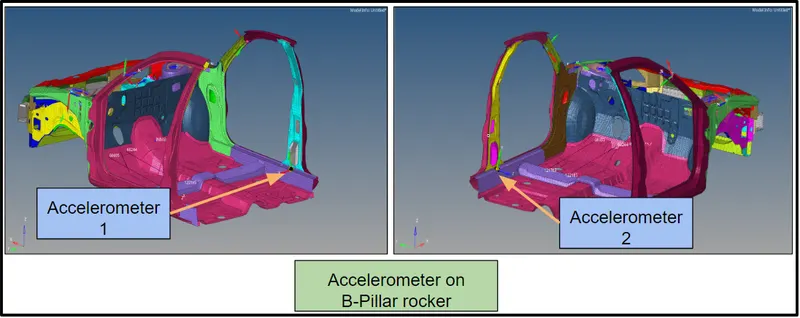
Here we want to measure how much acceleration is received on the B Pillar rocker for this we need to have set up an accelerometer just below the B-Pillar on the rocker arm.
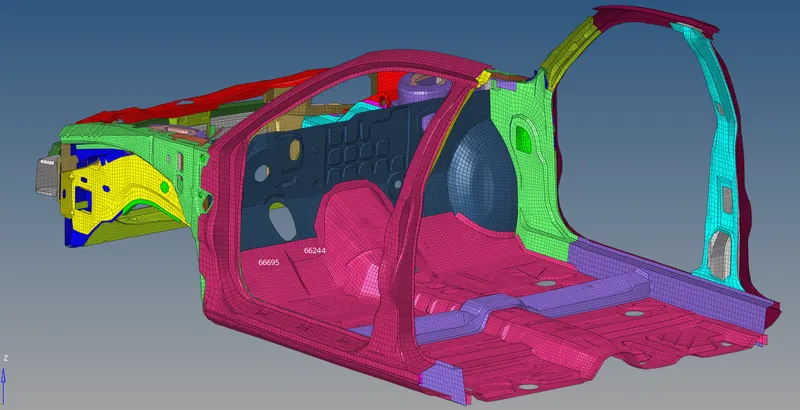
6. Intrusions on the dash wall 66695,66244
Intrusion here means how much displacement the driver is facing near the brake and acceleration pedal. For this, we introduce 2 points on the dashboard with node number 66695 and 66244 and then calculate the displacement of this intrusion based on the forces received after impacting the rigid wall.
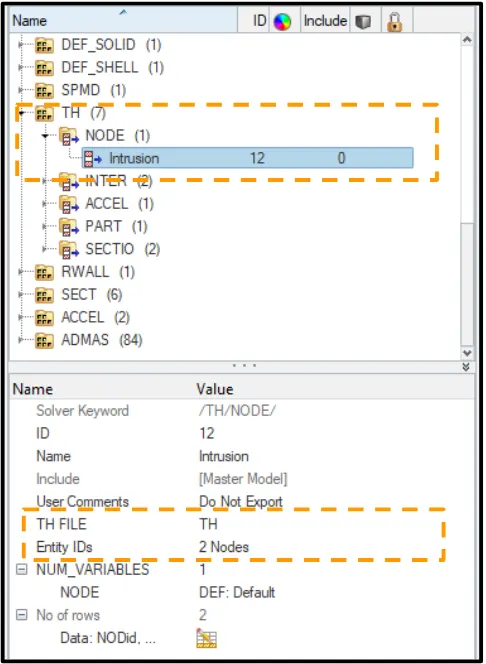
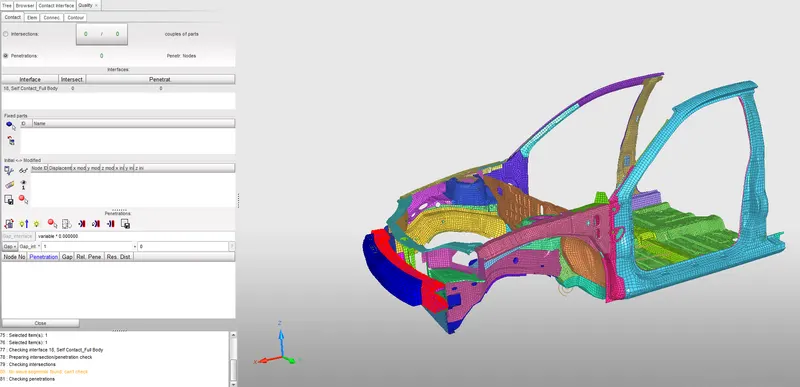
After completing all the above steps next was to check the penetration and run the model check in the hyper crash. For this the model is loaded in the hyper crash is checked accordingly.
Penetration Check
Model Checker
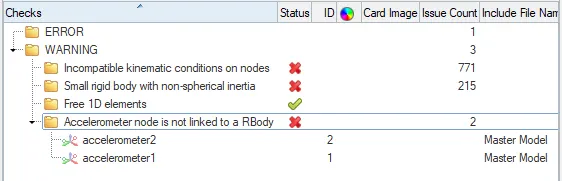
After running the model check there were some errors like the intrusion calculation with the spring was not allowing the model to run so the spring is removed and directly 2 nodes are added to calculate the intrusion on a node no 66694 & 66244. Apart from this, there were some unwanted spring present in the models. This is rectified and resolve to make the model error-free. Some free edges are also corrected using the connectivity check method.
Results:
1. Sectional force in the rails at the location of indicated node 174247
Video - Displacement of Rail Component
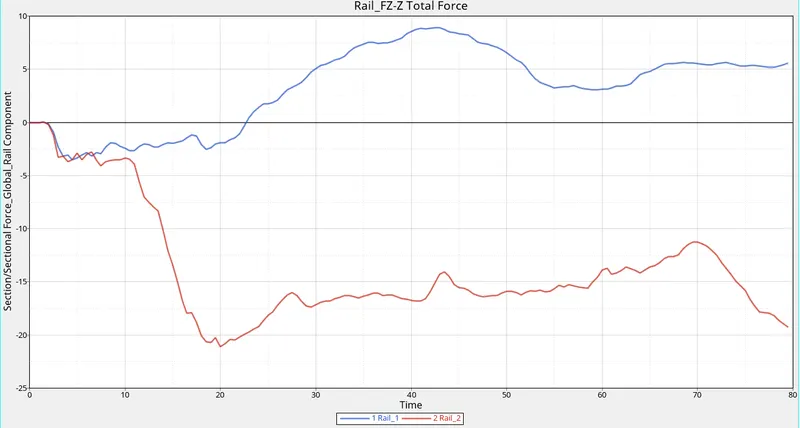
fig - Total Force in Rail Component
fig - Sectional Force in Rail on node 174247
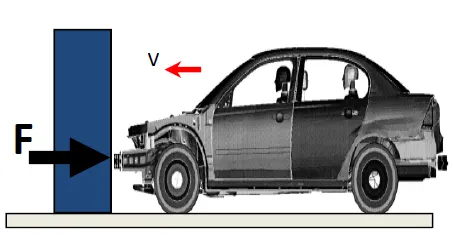
fig - Physics of Crash
To understand the above graph we have to study the physic of the crash so here comes this 3rd picture into effect. During the front impact, the vehicle is going to impact the rigid wall. At the time of impact, this vehicle will have some kinetic energy possessed and the rigid wall will try to oppose this kinetic energy and itself will apply the force from the opposite direction as shown above. So while impacting the rigid wall the kinetic energy of the vehicle will be reduced continuously and at the same instance, the wall will apply force to the vehicle components due to the transfer of energy. From this, we can conclude the force will be recorded in the vehicle components due to high collision and it can be either positive or negative based on how much particular component is going to deform and how much force it is absorbing from the rigid wall.
From the above graphic of displacement and graph, we can say that the vehicle is going to impact the rigid wall and from our observation, we can say that rail component 1 is getting more deformed than rail component 2. When this rail component is impacting the rigid wall there is some force transferred from the rigid wall into this component. From the graphic, it is clear that rail 1 is deformed more that is why the force recorded in rail 1 is positive and less deformation is observed in rail 2 so that is why there is no transfer of force in rail 2 which is leading to the record the negative force.
2. Axial force received on the rails from bumper
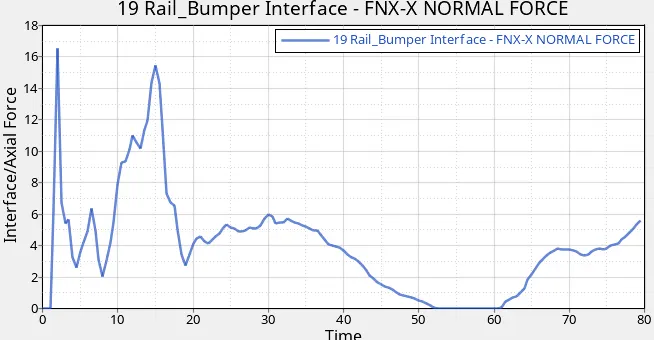
fig - Axial Force in the Bumper Rail
The bumper of the vehicle is the most frontal part of any vehicle. For any automotive vehcile, the bumper is known to be a vital role-playing component. The bumper should absorb as much as a force during the crash so that the other components may not get so much deform and remains safe. From the above graph, we can see that the force transfer between the bumper to the rail is nearly approx 17 KN. This value is initially high at the start of the crash but as soon as the intensity of the crash decreasing the value of the force is also found to be decreasing. Before 20 sec the force experienced by the rail is higher compared to the force experienced after 20 sec.
3. Shotgun cross-sectional forces
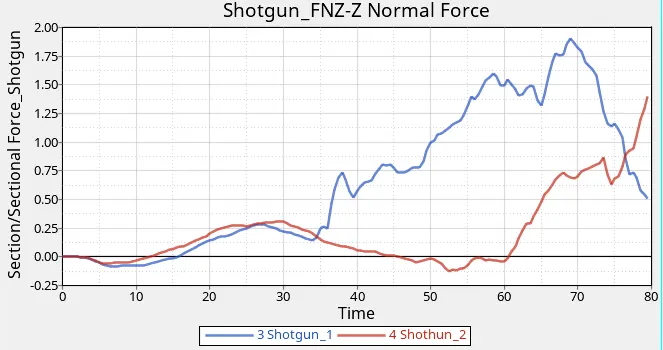
fig - Sectional Force in Shotgun
The shotgun of the automotive is also one of the important components playing a major role in the front crash analysis. In the above graph, we can see that the forces are shifting between positive and negative values. From the graphic, it is clear that shotgun 1 is deformed more that is why the force recorded in a shotgun is more and utmost positive, and less deformation is observed in shotgun 2 so that is why there is not much transfer of force in shotgun 2 which is leading to the record the positive-negative force.
4. A-pillar cross-section
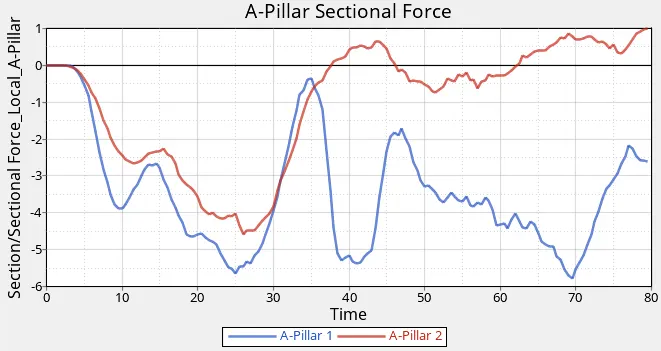
We know that A-Pillar is the component that is not in the same angle or axis as that of other frontal parts. A-Pillar is a little tilted at some angle. So to rectify the cross-section force in the A-Pillar we have set the frame at the cross-section of the A-Pillars. Force is calculated along the Z-direction. From the above graph, we can see that the forces are negative this is due to the vehicle is deforming at the same instance the vector force is changing it directly because of the bending and buckling action of the other frontal components.
fig - Sectional Force in A-Pillar
5. Acceleration curve received on the accelerometer at base of B pillar (on B pillar rocker)
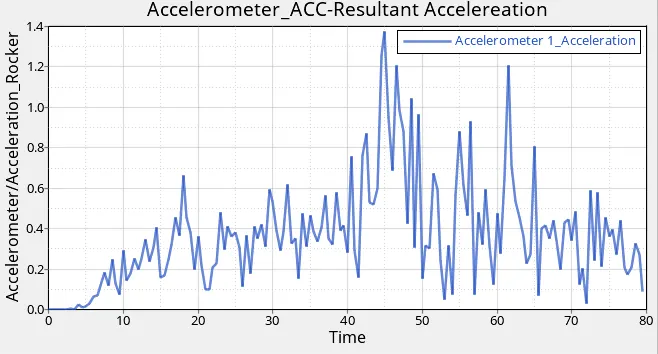
fig - Acceleration in B-Pillar Rocker Arm 1
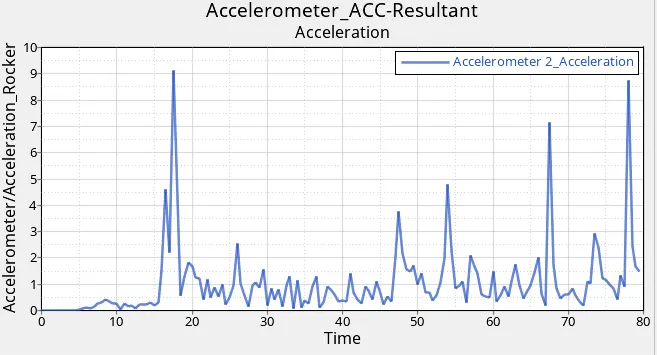
fig - Acceleration in B-Pillar Rocker Arm 2
From the above graph, we can see that the acceleration is recorded in the accelerometer on the B-Pillar Rocker Arms. This acceleration is recorded on behalf of the initial velocity given to the vehicle. We can see clearly from the above two graphs that there is very much difference in the value of the recorded acceleration. This is due to the retardation of the vehicle at various velocities at various sides. In figure 1 there is less acceleration recorded as this side component is deforming completely and this side is getting retarded at a faster rate than the 2nd side. On the other hand, on the 2nd side of the vehicle, the retardation is at a slower rate so there seems to be a higher spike in the acceleration due to the slower retardation rate.
6. Intrusions on the dash wall 66695,66244
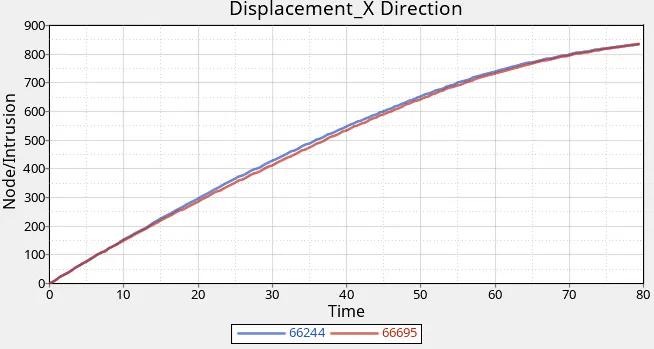
fig - Intrusion in Node 66244 & 66695
Here we can see that after the frontal impact the intrusion is recorded in the form of displacement. This intrusion node 66695 & 66244 are near the driver brake and acceleration pedal. As there are no other components in the front section of the vehicle like the absence of Engine, Radiator, etc there is very huge deformation recorded at this intrusion node. This can be fixed after fixing the other parts under the hood of the vehicle.
Energy Plot
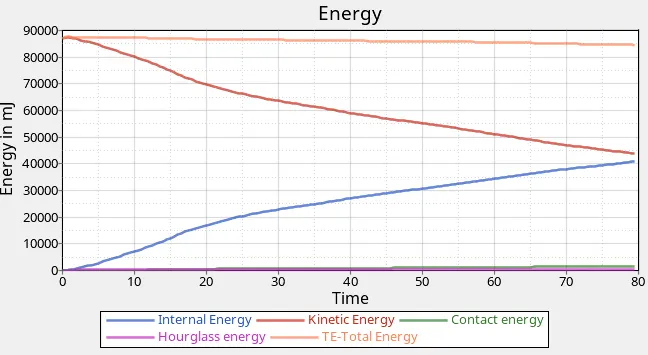
From the above graph as usual we can see that the kinetic energy and internal energy are decreasing and carrying accordingly. As the vehicle is impacting the rigid wall the kinetic energy of the vehicle is converted into internal energy. The total energy is the summation of the kinetic energy and internal energy.
Total Displacement in the Vehicle
fig - Total Displacement in the BIW Structure
Total Von Mises Stree in the Vehicle
fig - Total Von-Mises Stree in the BIW Structure
Learning Outcome -
1] Setup the model for the Frontal Crash Analysis using FEA, RADIOSS & HYPERMESH.
2] Types of force need to be calculated during the analysis.
3] Front Crash Analysis Fundamentals for FEA.
Conclusion -
Here we conclude this project is completed. Learning throughout the CRASH-WORTHINESS of Frontal Impact Analysis is very much worthy and can be applied to the industrial realistic problems of CRASH-WORTHINESS.
- Jetti DineshGood Report. Keep it Up.