Assignment 5-RADIOSS Interfaces & Study of Effect of Notches Challenge
AIM:
To mesh the given bumper model in hypermesh with element size 6mm, and to run the crush tube simulation with different interfaces cases and different notch positions.
The meshing of Bumper model.
Procedure:
- Import the bumper .hm file into the hypermesh
- Switch the geometry colour mode to 2d topology, to check for free edges in the model
- Fix the free edges and clean up the geometry fro meshing,
- Go 2d auto mesh option to mesh the given assembly
- Check for quality by going to tools->check elements
- Fix the failed elements by remeshing the failed elements to pass the quality criteria
- connect the parts with weld elements.
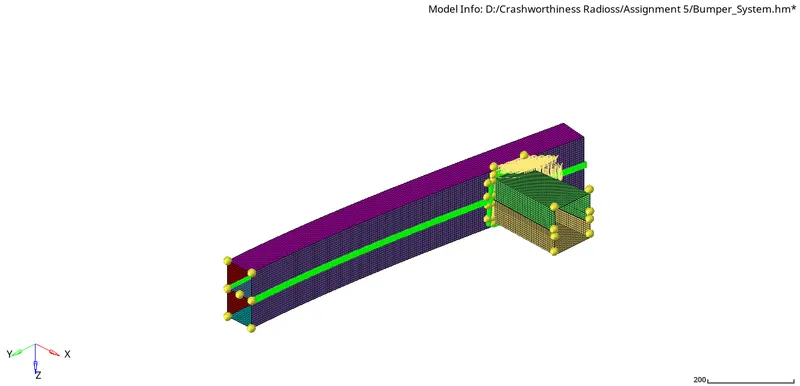
Meshed bumper model.
Interfaces cases.
Case 1:
To run the given crush tube model without any changes.
Check the user profile, set it to Radioss profile and import the .rad file into the hypermesh
Run the analysis
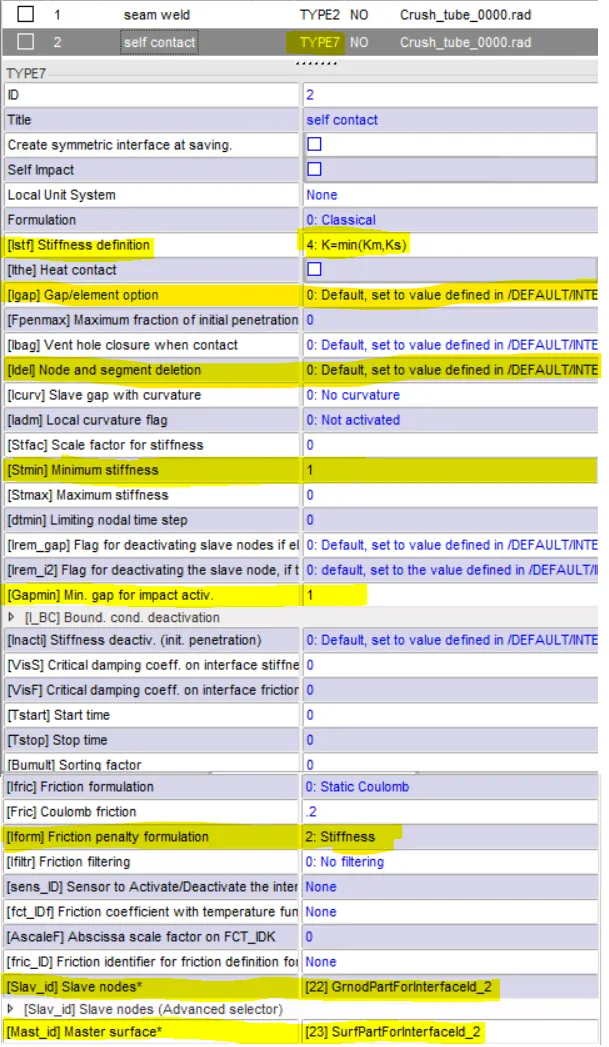
type 7 interface card applied to case 1.
Type 7 node to surface:
In type 7 interface a node can act as master and slave at the same time which allows for self impact simulations.
One of the main limitations of type 7 is it can not solve edge to edge interactions.
Details for interfaces are referred from (Altair HyperWorks help, Altair Radioss, Penalty method).
Important parameters for type 7:
1.I_stf: Interface stiffness definition flag,
For I_stf=4, K=min(K_m,K_s)
K_m= master segment stiffness
K_s= slave segment stiffness
We only have shell elements in the model, hence
K_m = Stfac * 0.5*E*t
K_s =0.5*E*t
2. I_gap: dictates how the gap size is computed, if its set to 0 or not defined it considers the Gapmin value for Gap.
for this simulation the gap is 1mm, since the I_gap=0.
3. St_min: minimum stiffness to use in the interface in-case the stiffness values are low, helps to maintain the time step in-case the stiffness values are too lowI_form : Friction penalty formulation type
4.I_form : Friction penalty formulation type
I_form= 2 , is stiffness formulation, is recommended for implicit and low-speed impact explicit analysis.4
5. I_del: Node and segment deletion flag, dictates what happens to the slave nodes and master nodes when the attached element is failed
I_del= 0 (default value) no deletion
6. Gapmin: Minimum gap for impact activation
7. Inacti: Deactivation flag of stiffness in case of initial penetrations
Inacti = 0, No action
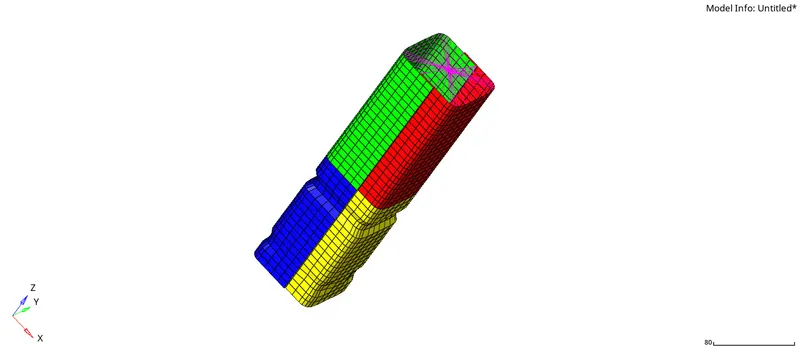
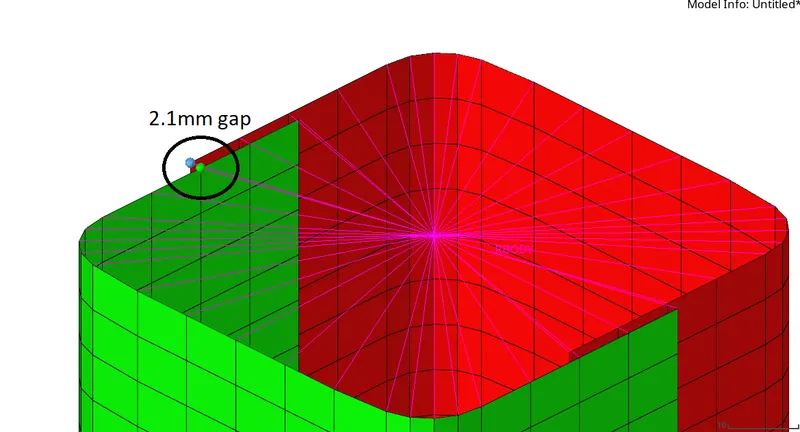
the gap between the parts is mainteained at 2.1mm as shown in the image above for all the cases.
Case 2:
Change the Inacti parameter value to 6 and run the simulation.
Inacti=6, Gap is variable with time, but the initial gap is adjusted to avoid initial penetration in the master segment.
this helps in improving the simulation stability if any initial penetration exists in the model, this will reduce the initial gap further to avoid high stiffness values at the start of the simulation, as the simulation progresses if the nodes push further into the master segment the resistive forces act to stop the further penetration of the slave nodes.
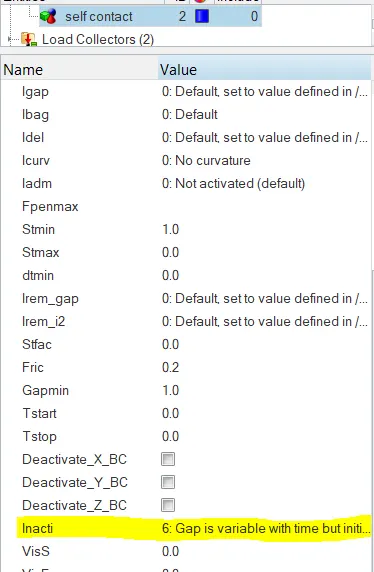
card image of type 7 interface setup.
Case 3.
Applying Type 11 interface contact to the model.
Type 11 simulates impact between edge to Edge or lines, which overcomes the type 7 limitation of edge to edge interaction.
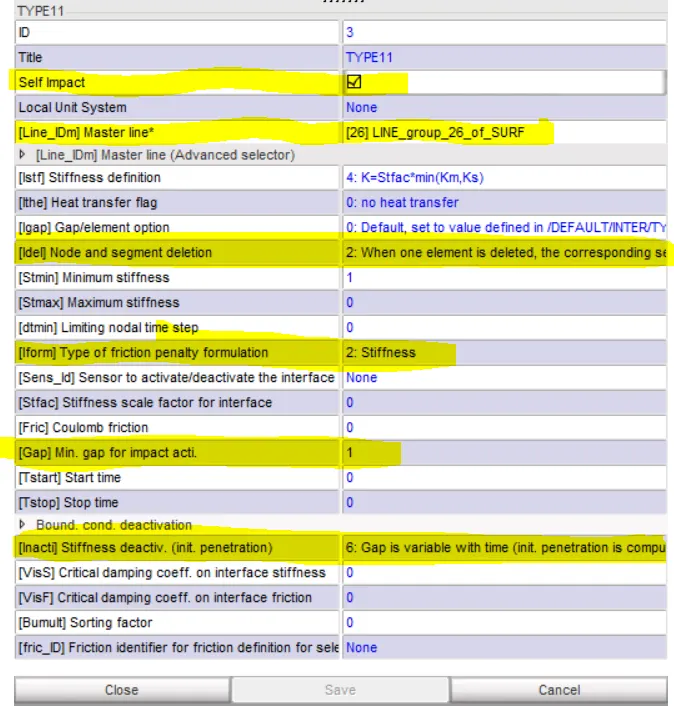
type 11 interface card image.
for the slave and master selection, all the 4 parts are selected
Case 4:
Removing all the notches in the model, and deleting the boundary conditions applied to the rigid body node.
To remove the notches, go to node edit->align node (F7 general keyboard shortcut), and align the nodes to the remaining nodes
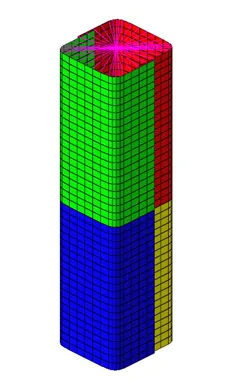
Image showing model without notches.
To check for the BCS on the node switch on BSC display option (Shift+F6 general keyboard shortcut) in hypercrash.
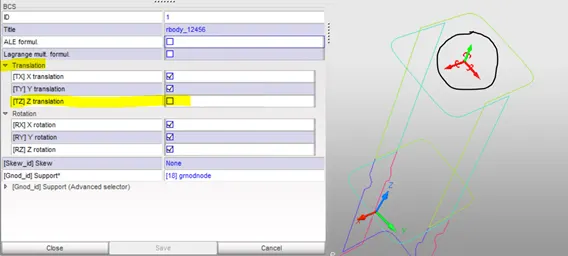
To remove the BCS applied to the rigid body node, go to boundary conditions and untick all the translation and rotational DOFS and save.
The green Z translation shows that it is the only direction the body is allowed to move, all other DOF are constrained
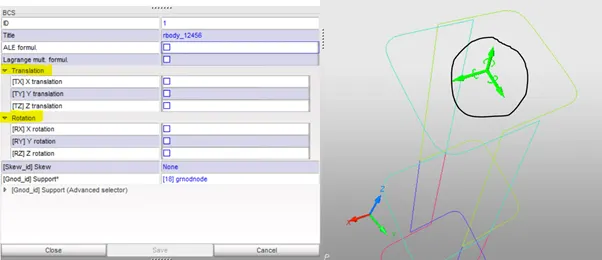
After you untick all the rotational and translation options the rigid body is not constrained in any of the direction, which is also seen in the images, where all the rotational and translations are in green in colour
Case 5.
Change the notch area to the centre of the model
To create the new notch at the centre, go to 2D->element offset
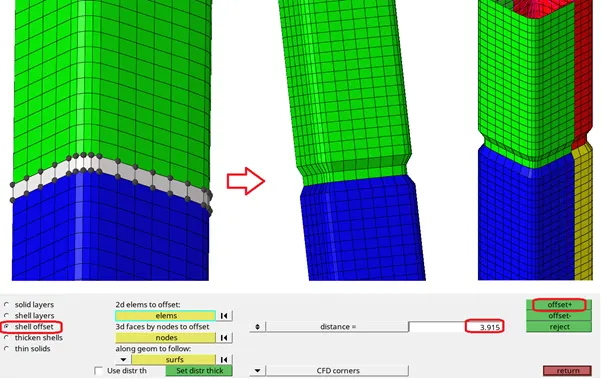
Repeat the same for the other two components in the model
keep all other settings similar to previous cases.
Case 6.
To keep the notches only at the opposite faces of the model.
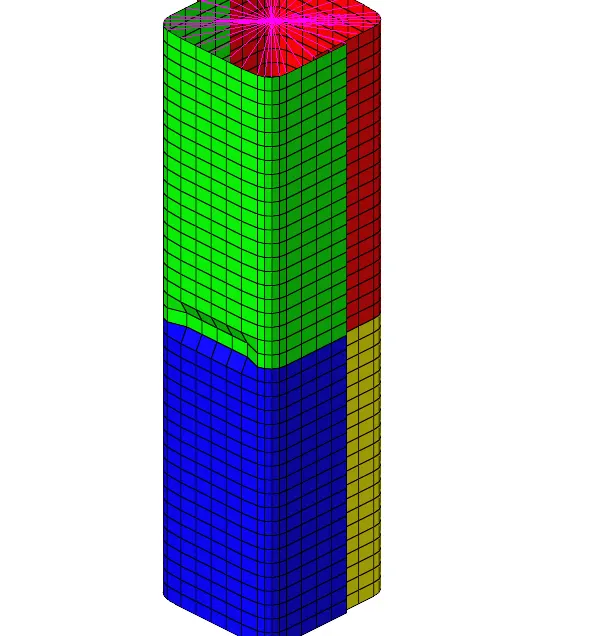
Run all the cases separately to observe the behaviour of the model for different case setup.
Results and Discussion.
case 1.
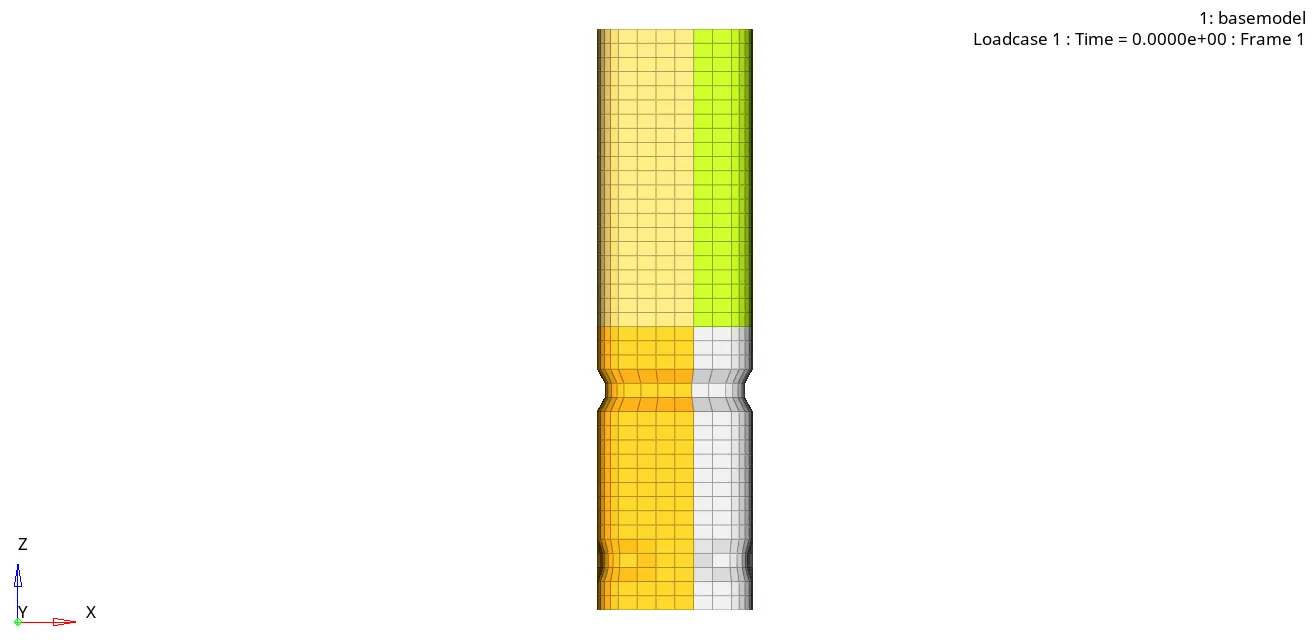
The simulation result shows that the first folding of the tube happens at the upper-middle notch area, and then as the simulation progresses, the lower notch is crushed
once the lower part of the tube is completely crushed, the upper half of the tube starts to deform and finally the whole tube is crushed against the wall as can be seen in the image above.
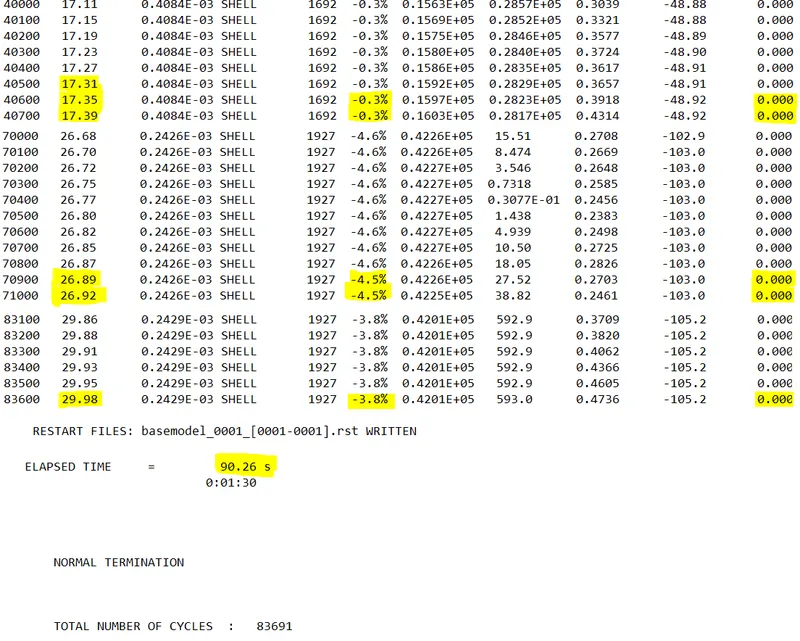
from the 0001.out file we can track the energy error of the simulation model, form the image above it can be observed that energy error at the start of the simulation is -0.3% as the simulation progresses the energy error increases in the negetive value and reaches -4.5% and at the end of the simulation the energy error is at -3.8%, the energy error value is under the required limit and the result is acceptable.
The interface type 7 is used, which is a node to surface interaction, and the gap for the simulation is at 1mm, there is no initial penetration in the model, as the gap between the parts is 2.1mm is maintained.
As the tube is crushed under load, due to self impacting the slave nodes tries to enter the defined gap due to which the resistive force is activated between the master segment and the slave nodes, which contributes to the energy being dissipated by the master segment to stop the slave nodes from reaching the mid surface, which can be seen in the energy error image above. The negative value indicates that some energy has been dissipated.
Mass error observed is 0.
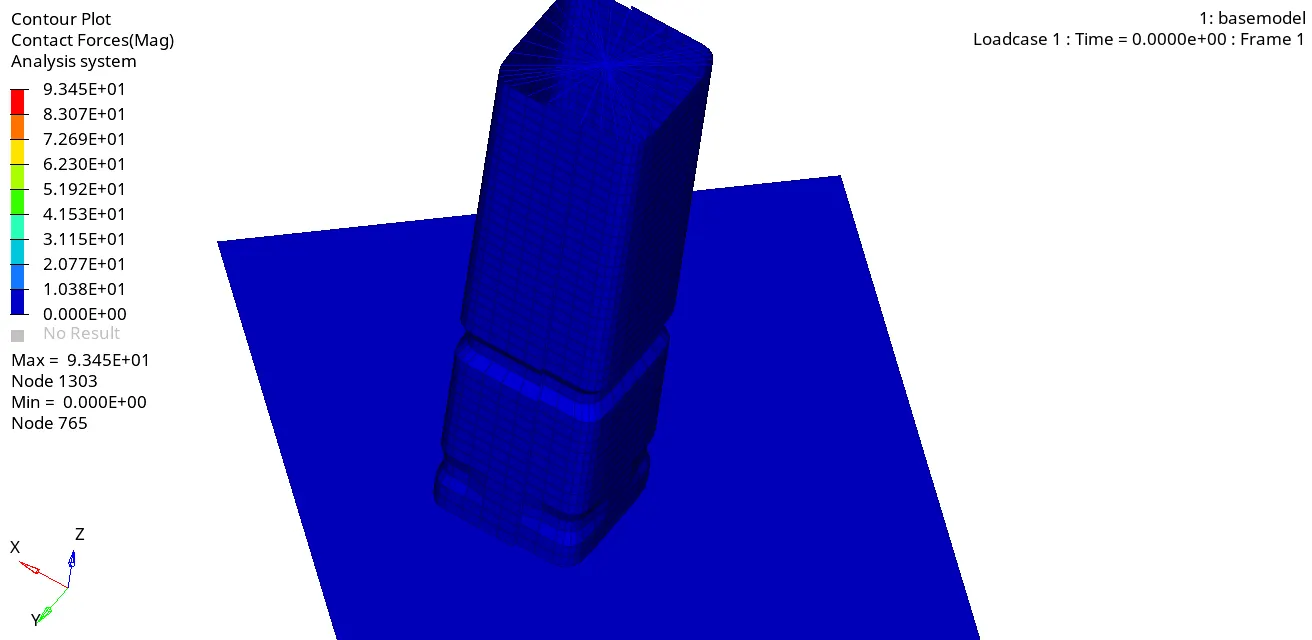
The above simulation shows the contact forces developed in the simulation, the highest value is at 93.4 kN it is observed at the end of the simulation at 27ms time, when the whole tube is crushed against the wall.
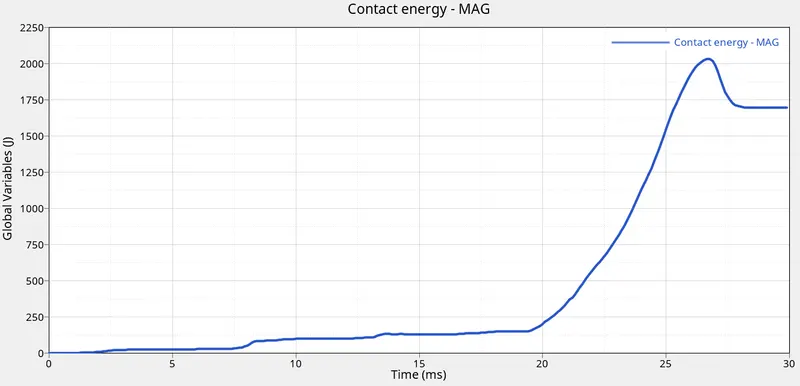
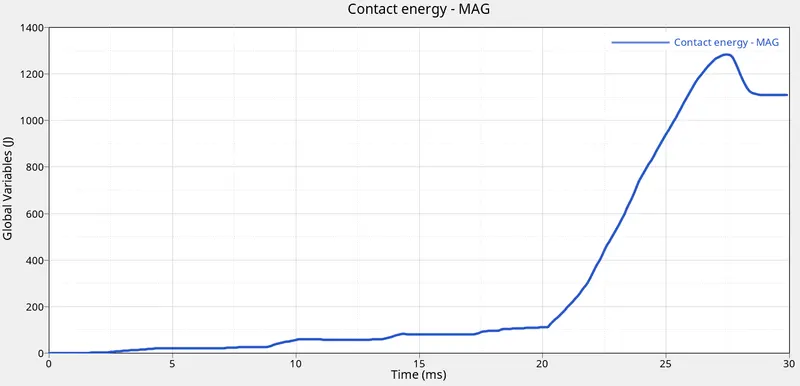
the graph shows the contact energy of the simulation model, it increases with time and reaches the peak near the end of the simulation at 27ms, since contact forces at the end are higher the contact energy at the end is also at higher values.
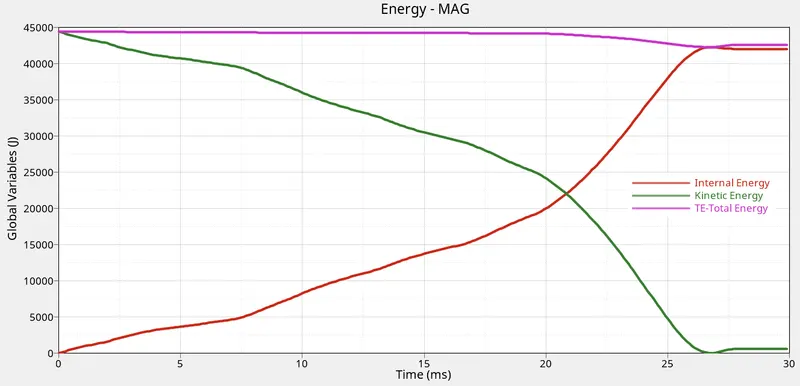
the internal energy increases with time, and kinetic energy has the opposite trend to that of internal energy, as the applied force crushes the tube the kinetic energy is transformed to the internal energy.
The total energy in the system stays almost constant due to resistive forces developed to keep the slave nodes out some of the energy is dissipated by the model.
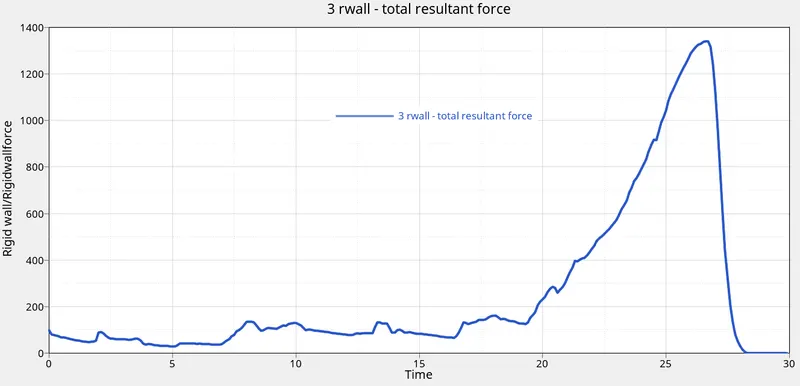
The graph shows the rigid wall forces, at the start of the simulation forces on the rigid wall is minimal because at the start of the simulation much of the forces due to the applied velocity is being absorbed by the materials due to which they deform, and when the tube is crushed completely against the wall that is when we see all the forces being transformed to the wall, which is what seen in the graph.
Case 2:
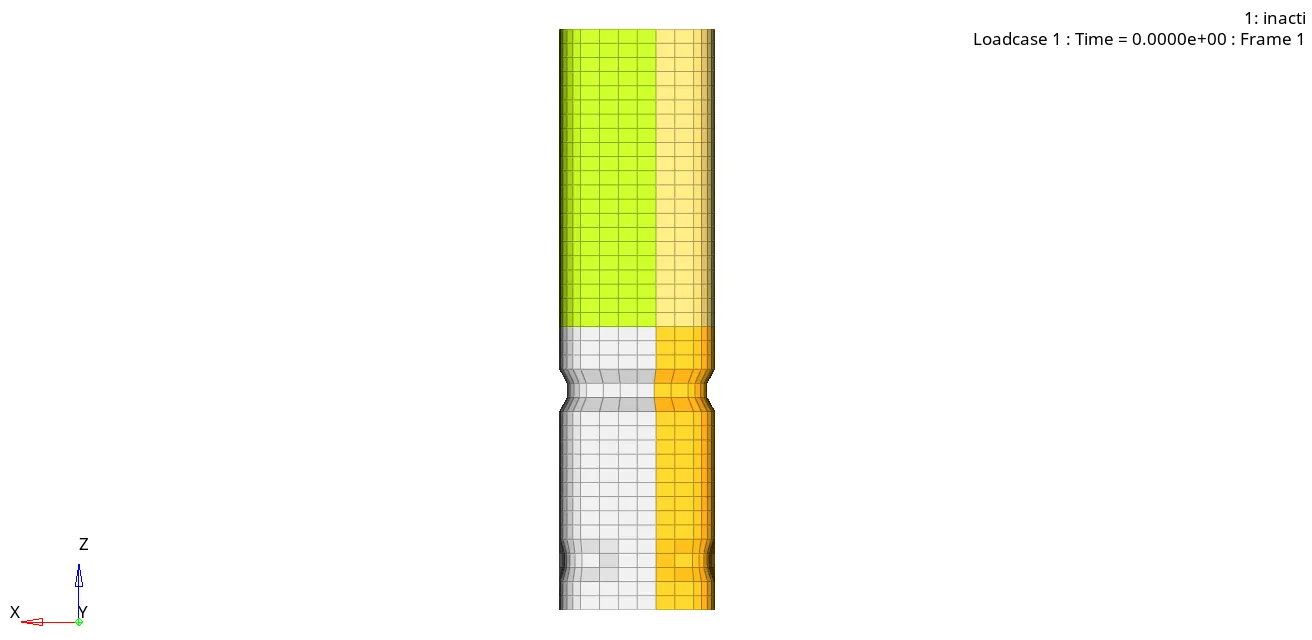
since their is no change in the notch areas and the material properties the simulation is similar to the case 1, with first notch being deformed first and progressing to the second notch and then finally deforming the the upper tubes.
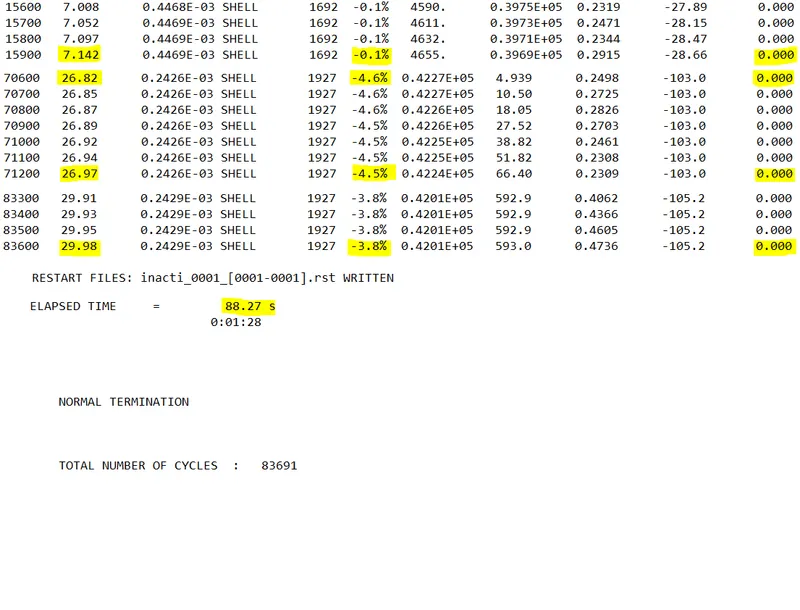
since their were no initial penetration their is not much noticeable change in the energy error, only change is in the simulation time which is be due to activating the inacti=6, which will help in reducing the calcualtion by providing some space for initial penetration. mass error is 0.
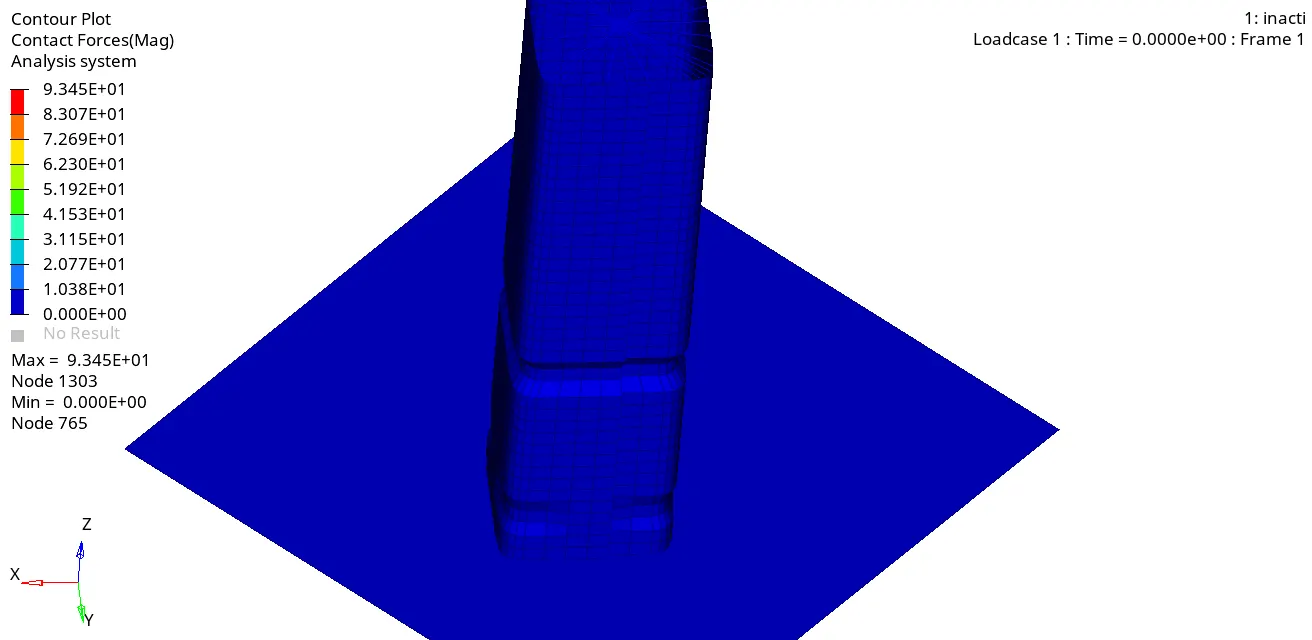
contact forces are observed at the end of the simulation similar to the case 1, adn the contact force values are also similar to that of case 1.
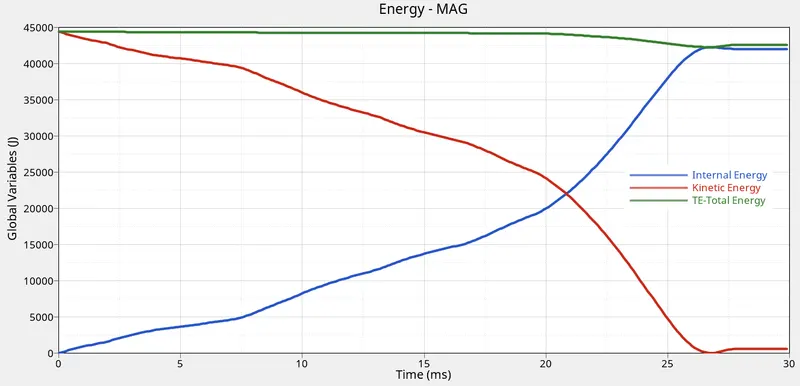
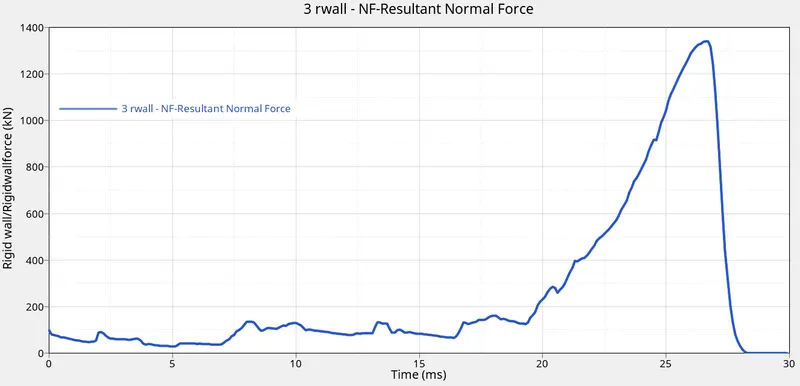
in all the three above graphs similar trend is seen as in case 1 simulation, and the values remain similar to that of the case 1.
Rwall forces reach a peak of 1350 kN, which is same as the previous case.
case 3.
simulation with type 11 contact interface.
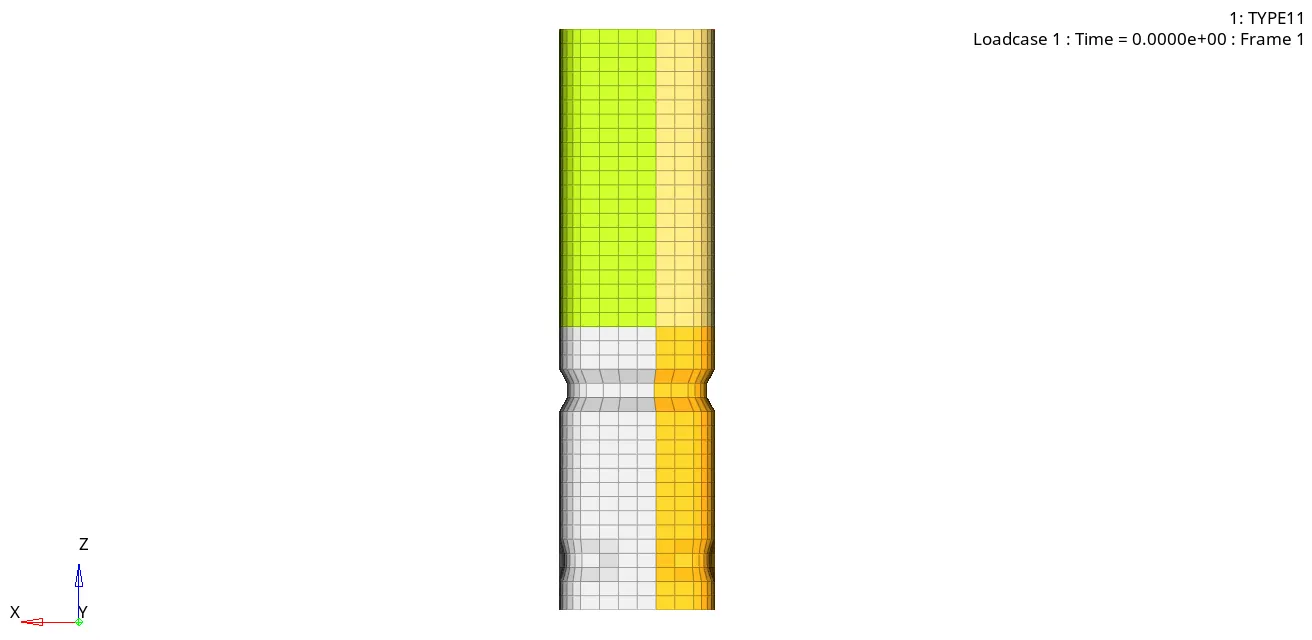
since their is no change in the placement of the notches, the simulation follows same trend as previous two cases.
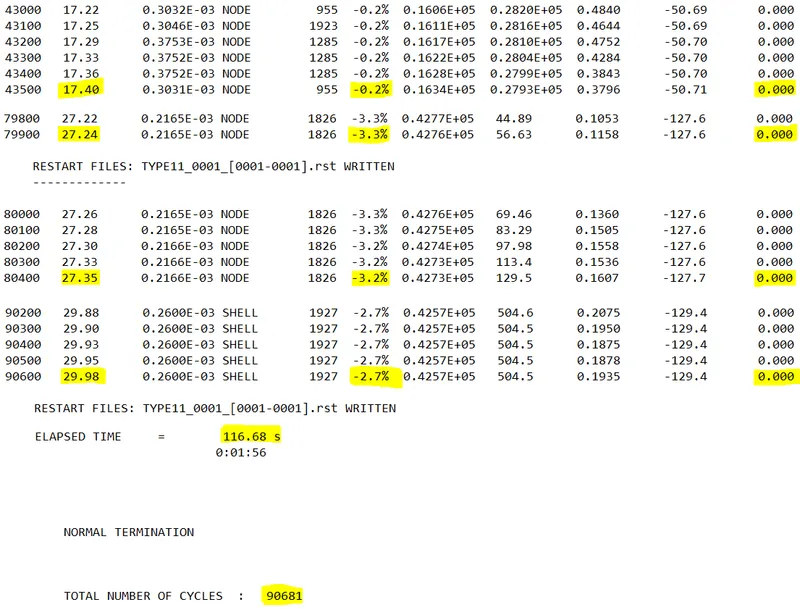
For case 3 simulation the energy error is decreased to -2.7%, which can be due to the introduction of Type 11 contact in the simulation, which takes into account the edge to edge contact. mass errror is 0.
since it has type 7 and type 11, contacts defined, the simulation time is higher than the previous two cases.
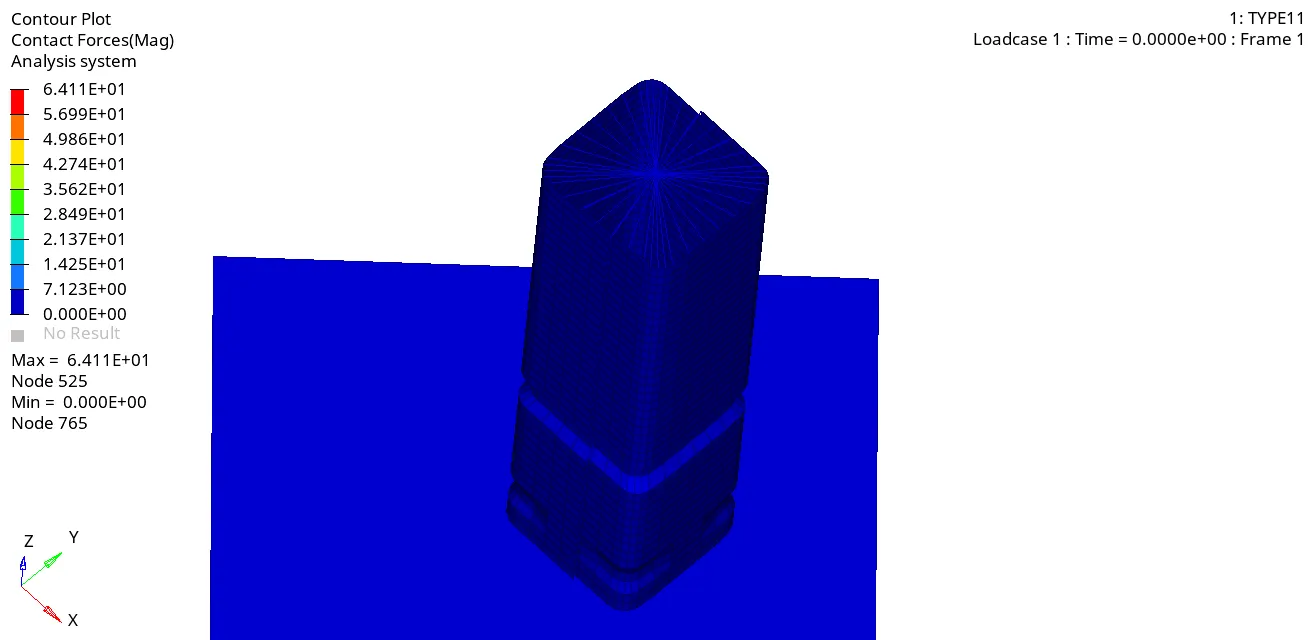
From the above simulation, the contact forces of the simulation are at 64.1 kN which is less than the previous cases which are at 93.45kN, since due to reduced contact forces the energy dissipated by the model is less, hence, the energy error is less compared to previous two cases.
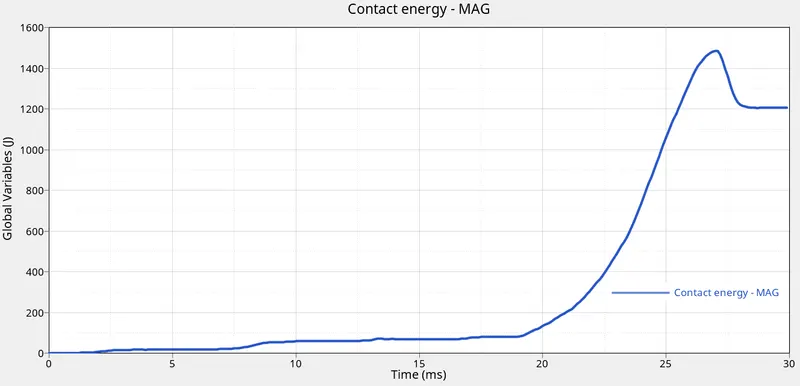
similar trend is observed in the contact energy graph as observed in th previous two cases.
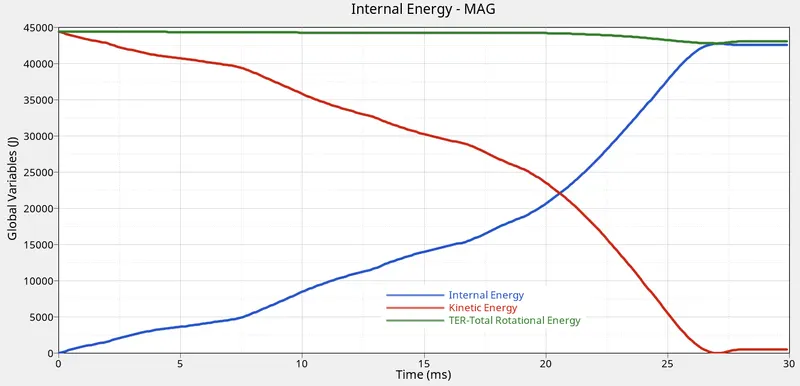
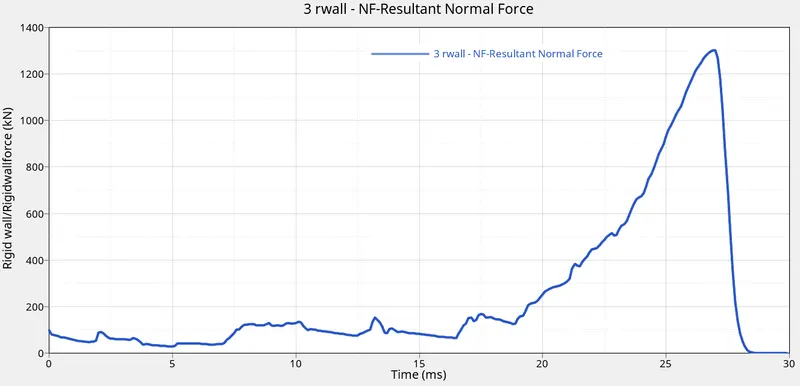
since all the load cases are similar, their is no change in the trend of energies and rwall forces for case 3. The Rwall forces reach peak at 1300kN.
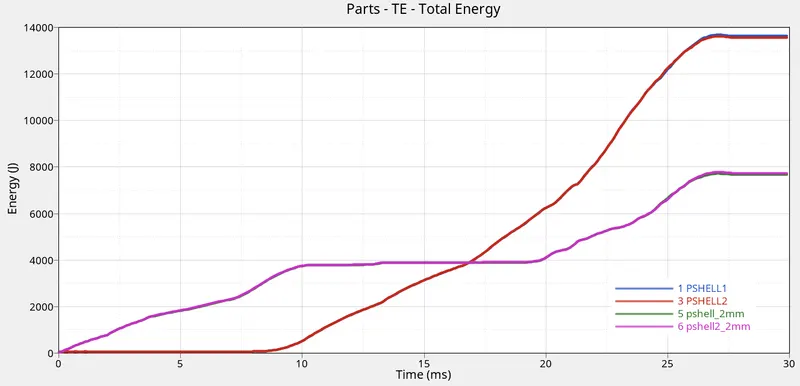
The total energies in the parts increse as simulation time increases,
total energy of 3mm thick parts is 13800J, and for 2mm parts it is 7800J. More energy is absorbed by the parts which are 3mm in thickness compaired to parts which are 2mm thick.
Case 4:
No notches in the crush tube model and no BCS on the rigid body node.
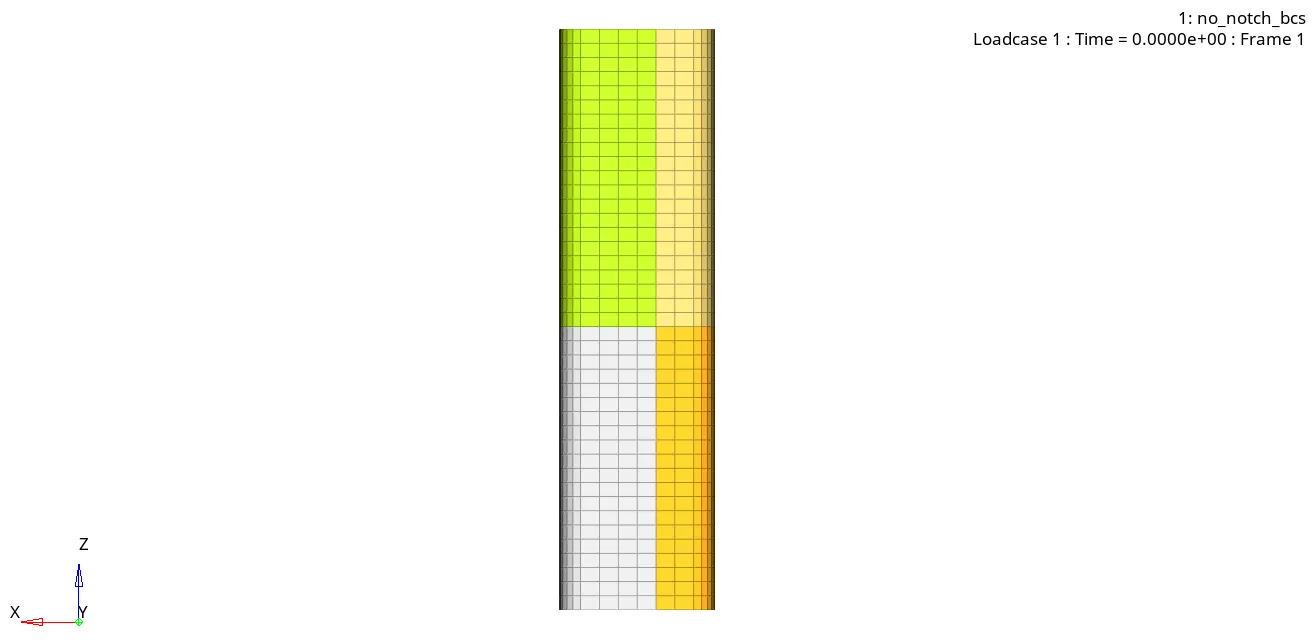
For model with no notches, the deformation starts from the bottom of the model, and then progresses to the upperbody.
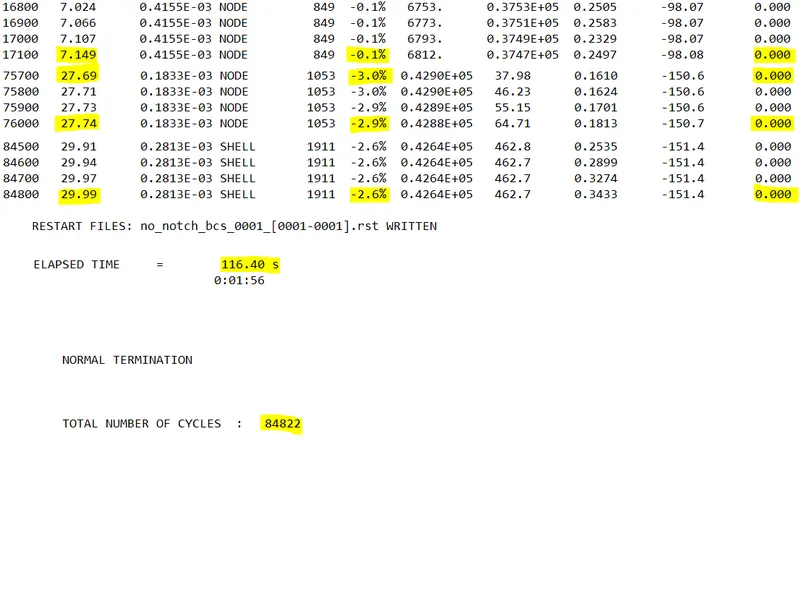
similar trend to previous cases is observed in the energy error for this case, and the time for simulation is almost close to the case 3 simulation. Mass error is 0.
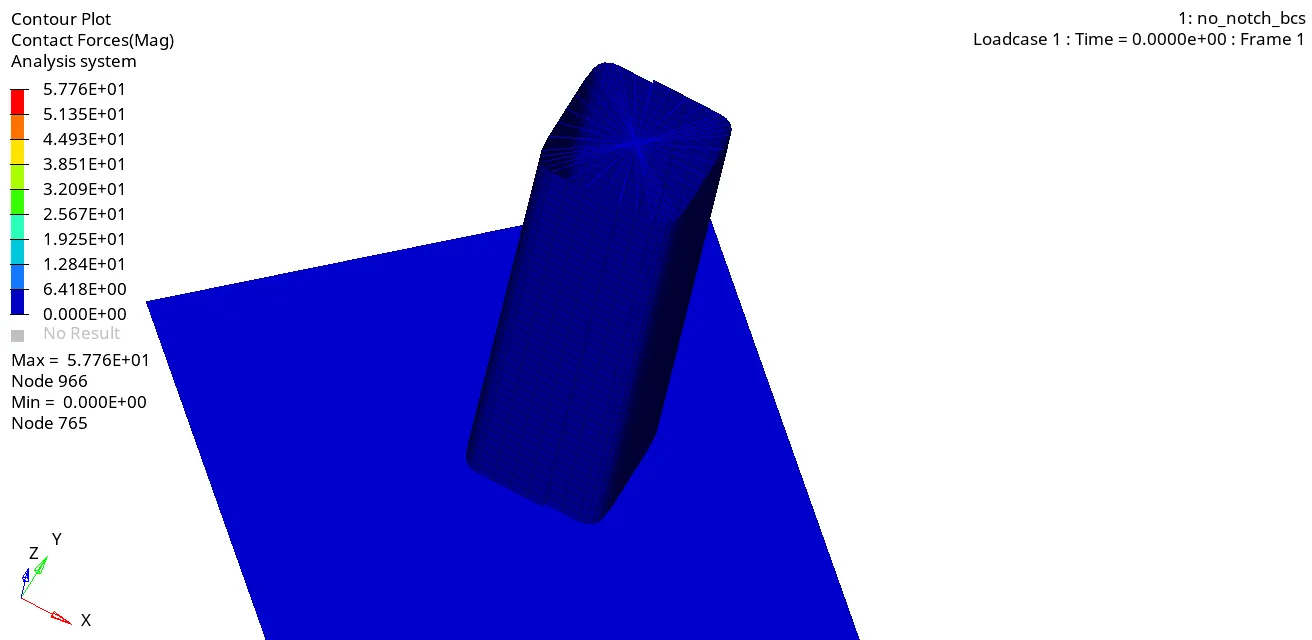
The contact forces are highest near the end of simulation time similar to what was observed in all the previous cases, but the contact forces value of 57.6 kN, is smaller compared to those of previous cases, this is due to the absence of notches in the model.
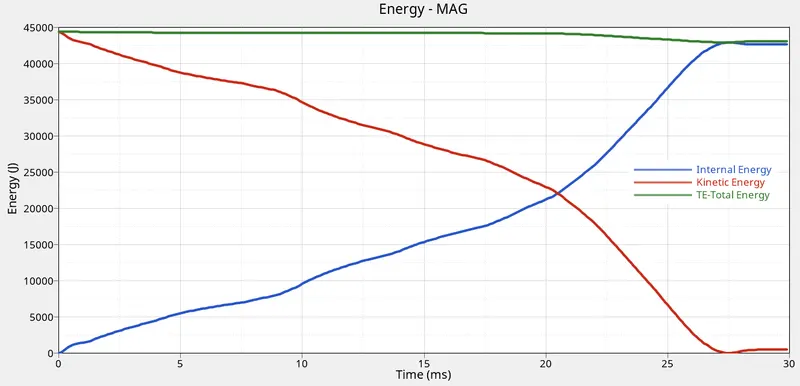
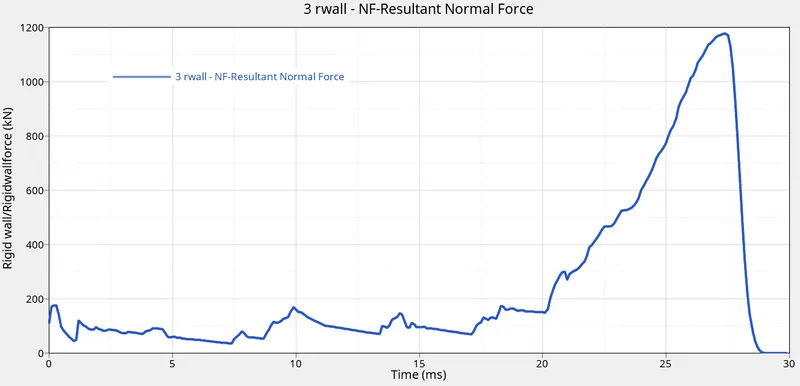
since all the load cases are similar, their is no change in the trend of energies and rwall forces for case 4. The maximum Rwall forces value is at 1180 kN, which is lowest compaired to previous simulation values.
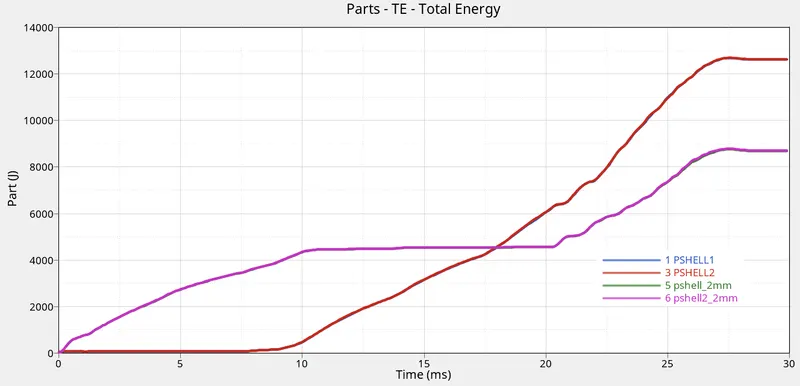
due to no notches in the model, the total energy on the parts which are 3mm thick are absorbing less total energy (12500 J) compaired to model with notches wher total energy value is at 13800 J, as for 2mm thick parts the total energy is much heigher than the previous case at 8800kN.
Case 5:
Model with notch at the middle.
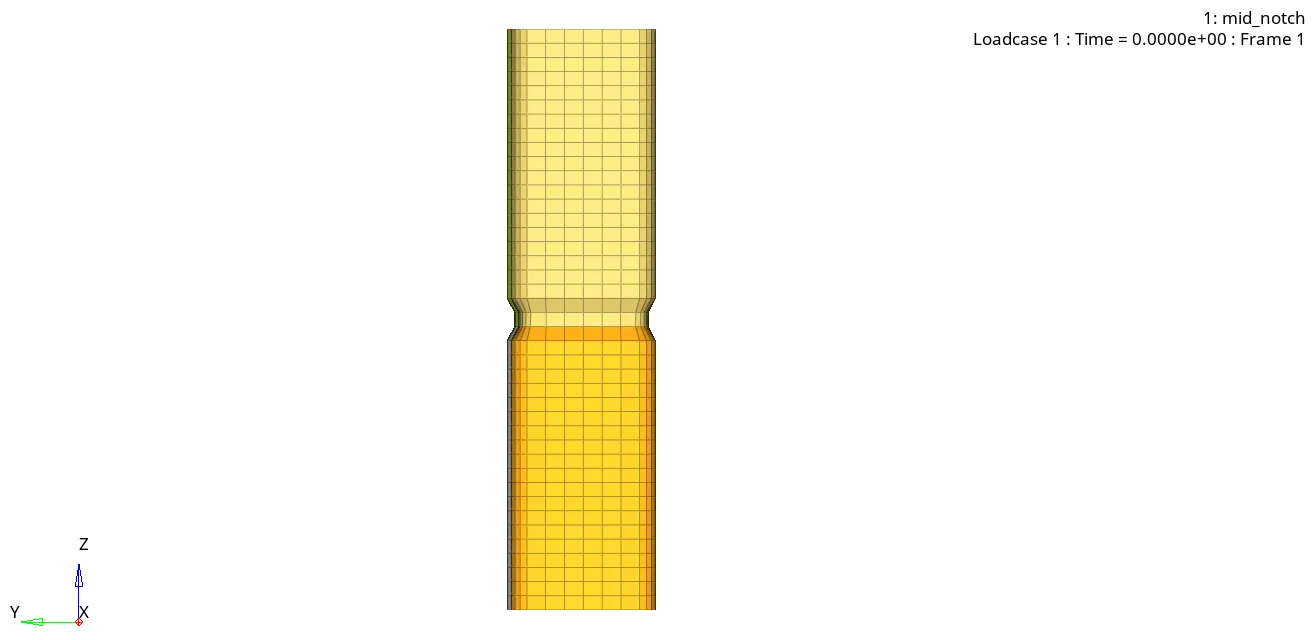
The first deformation in the model occurs at the notch area and then at the bottom of the tube before the upper part of the notch finally deforms and crushes the tube against the wall, which is as seen in the simulation above.
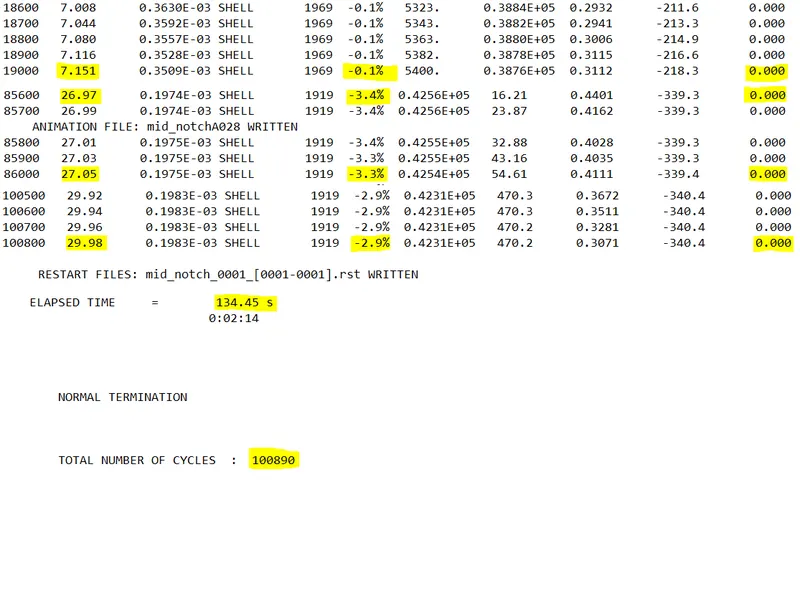
the energy error is -2.9% which is slightly higher than the model without notches, and the time for simulation is 134.45 second, which is the higher than all the previous simulations. Mass error is 0.
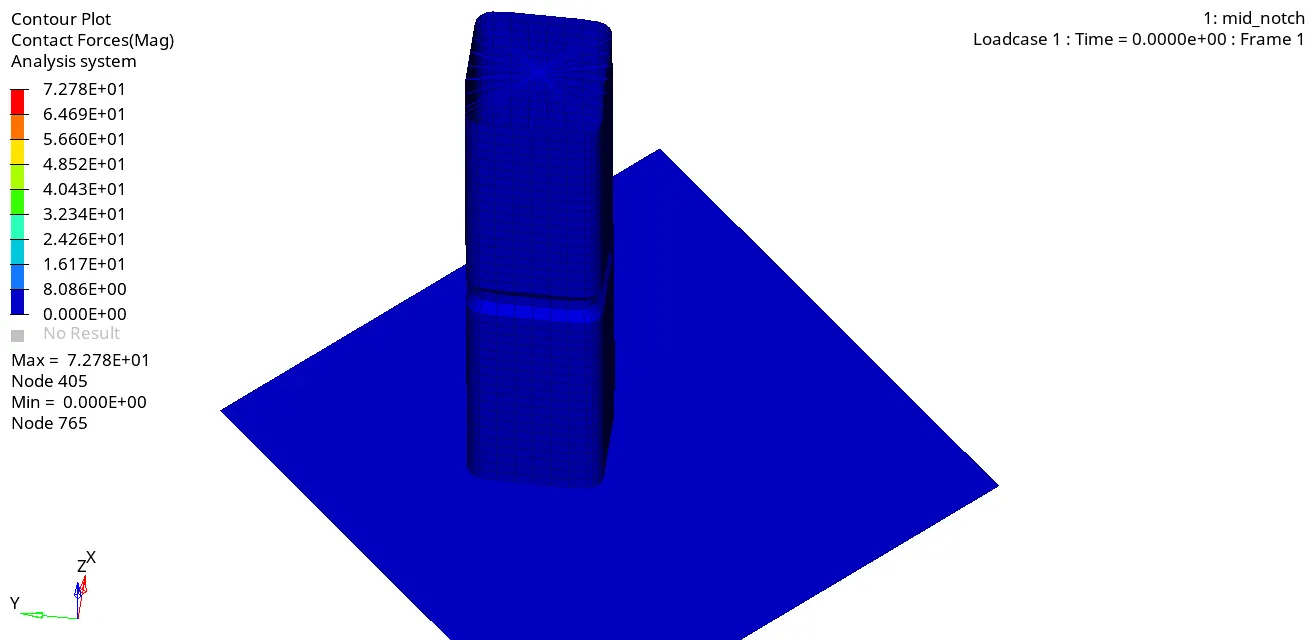
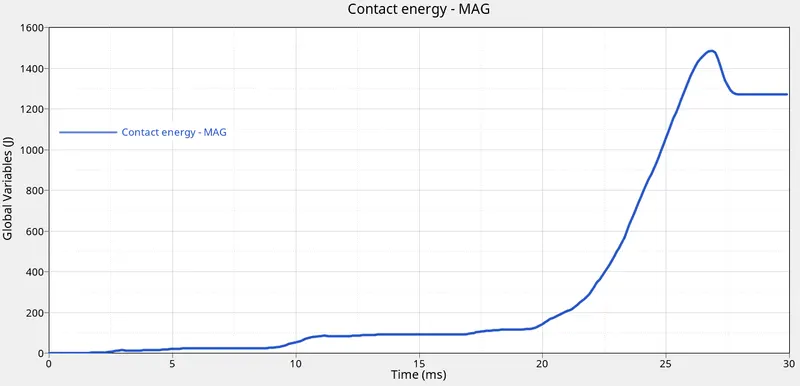
contact forces are higher at the 27ms of the simulation, i.e. at the end of simulation time, the contact energy graph also shows the peak at the same timeline and then stays constant at 1250 J.
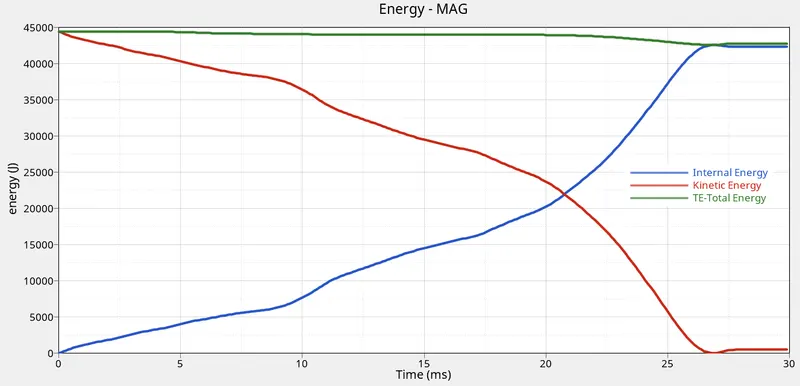
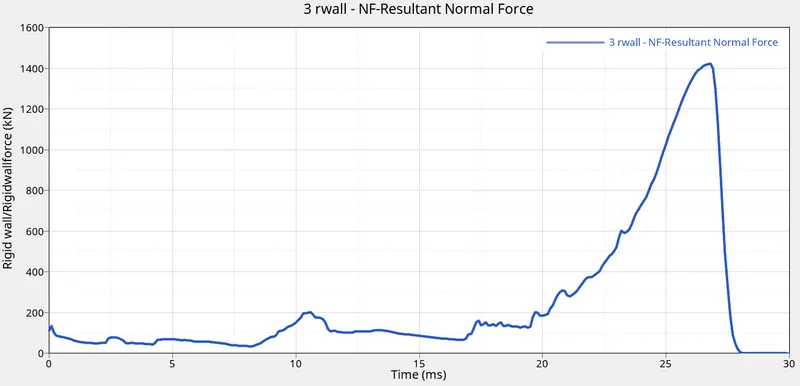
the energy trend is similar to the previous case, and the Rwall forces reach maximum of 1410kN which is heighest among all the previous simulation.
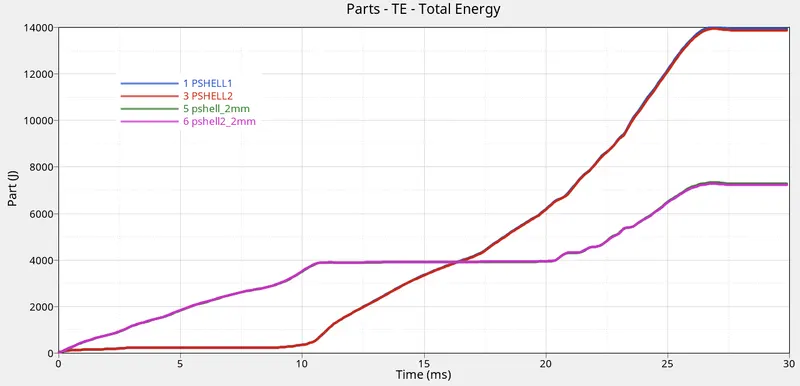
The 3mm thick parts total energy reaches maximum value of 14000J, which is heighest among all the previous simulations, buth the total energy of 2mm thick parts reach a maximum value of 7050kN which is least among the previous simulations.
Case 6:
Notches at the opposite 2 faces.
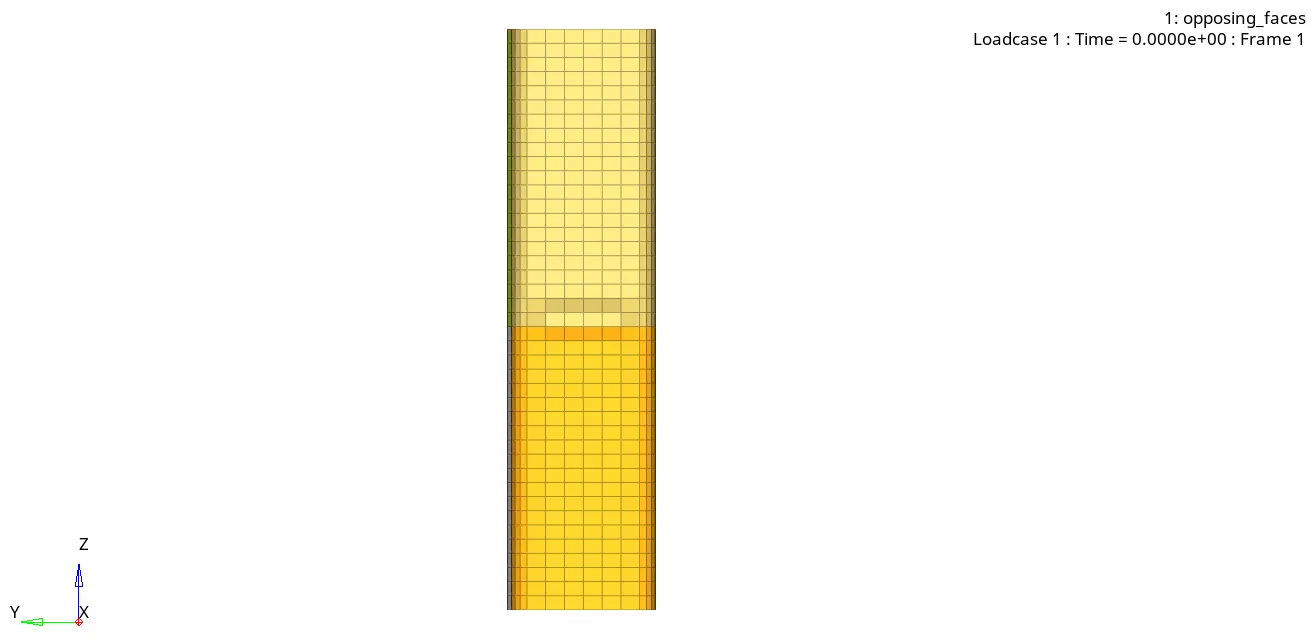
The first deformation in the model occurs when at the notch area, then progresses at th ebottom of the model after which the upper part of the model is deformed.
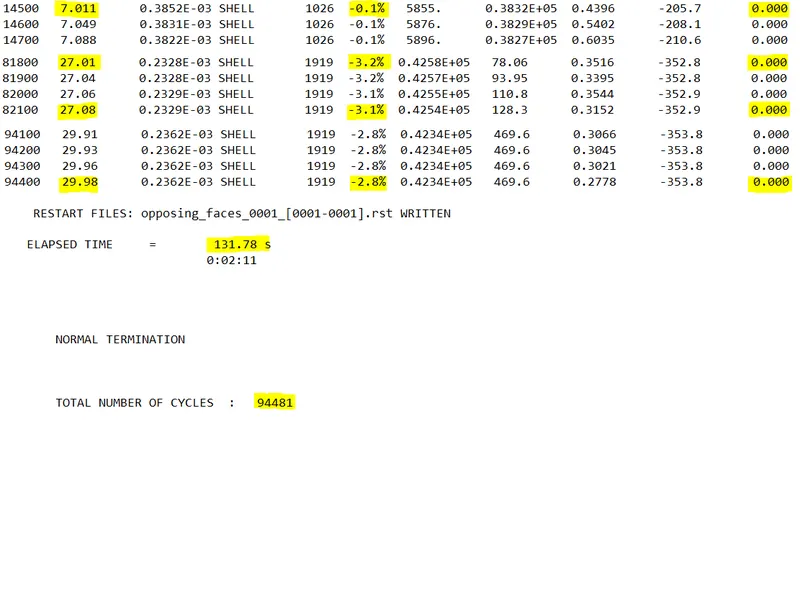
the energy error is -2.8% which, which is almost similar to the case 5, but time for simulation is 5seconds less. mass error is 0.
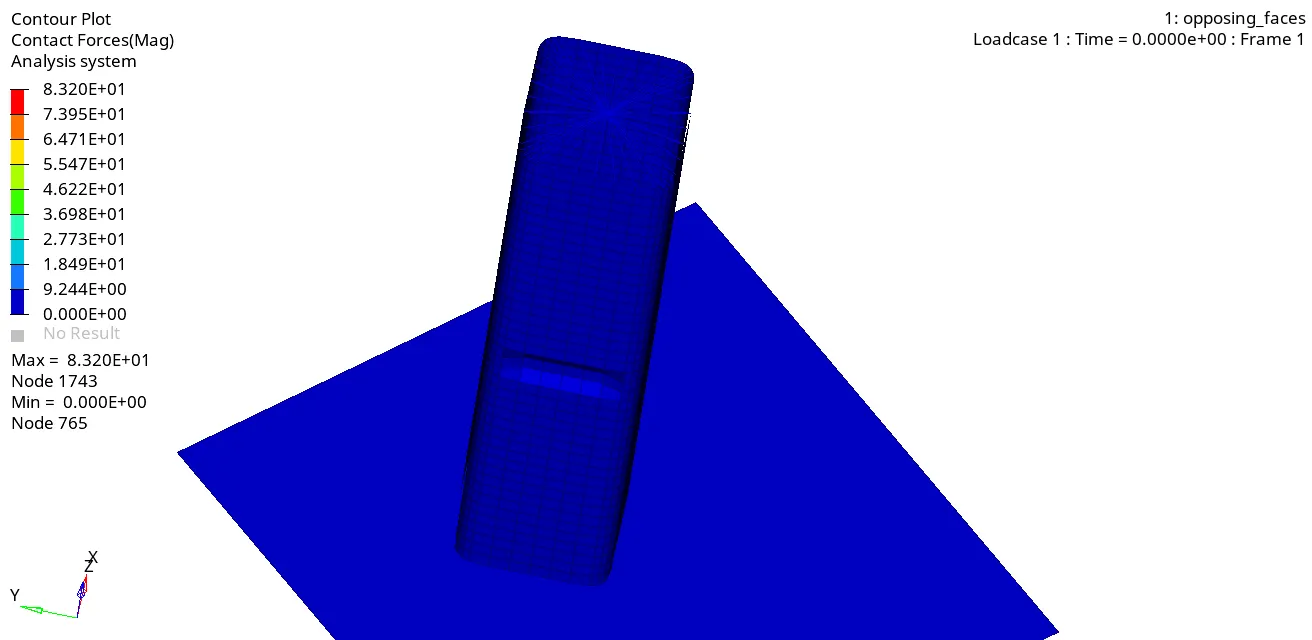
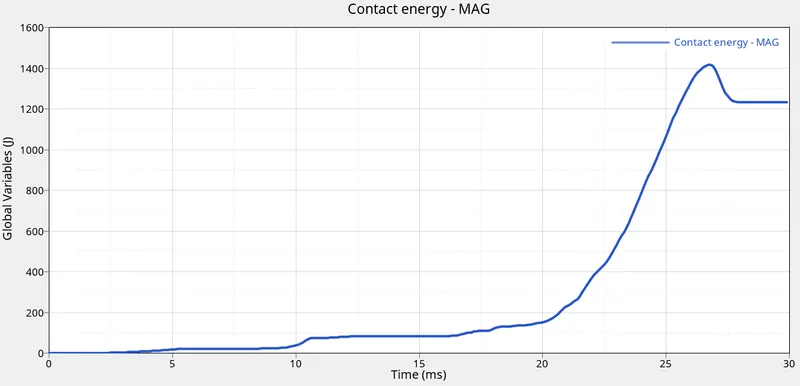
maximum contact force is 83.2kN at the 27ms of the simulation, the contact energy graph also shows the peak at the same timeline and then stays constant.
the contact forces are highest in this case compaired to all the cases.
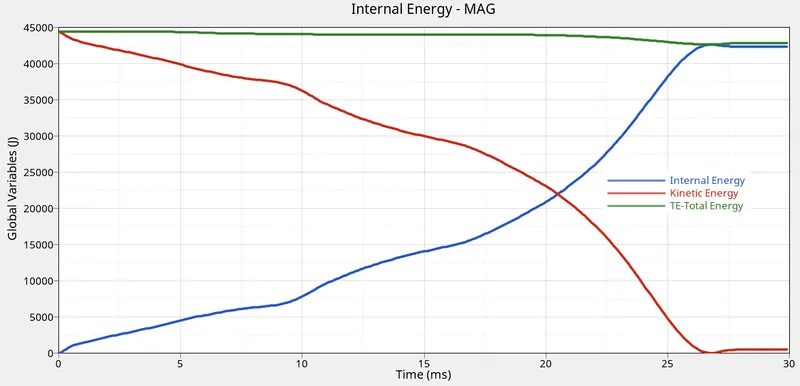
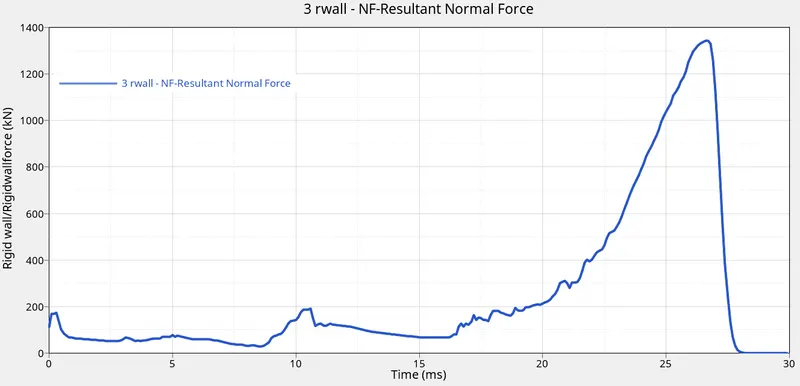
the energy trend is similar to the previous case, and the Rwall forces reach maximum of 1320kN which is third heighest after case 5 and case 2 respectively.
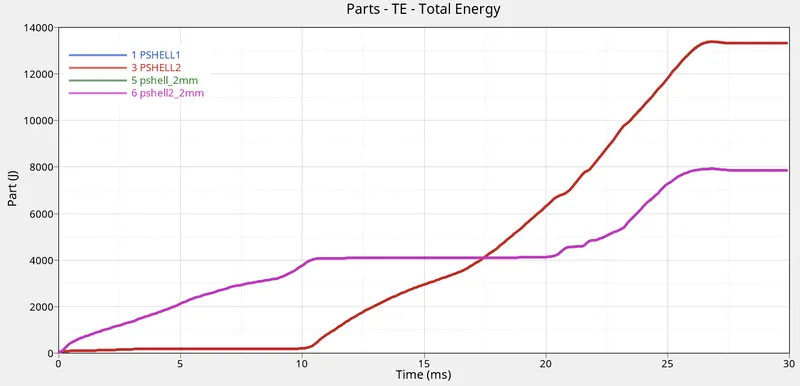
The 3mm thick parts total energy reaches maximum value of 13200J, the total energy of 2mm thick parts reach a maximum value of 8000kN which is similar to case 3.
conclusion:
The given bumper is meshed with 6mm elements and the crush tube simulation with different cases is conducted and the results are discussed comparing with eachother.