Assignment 5
objective:To mesh the given bumper system with a given average element size and run the crash tube model simulation with as per given in the questions and plot the graphs and then compare the results.
procedure:
1.Import the given bumper system assembly and then set the average element size as the 6mm and then mesh the given bumper system and then check for the free edges of the elements .
2.create the connections for the bumper system as the seam weld to the particular faces or the surfaces and then realize that connections.
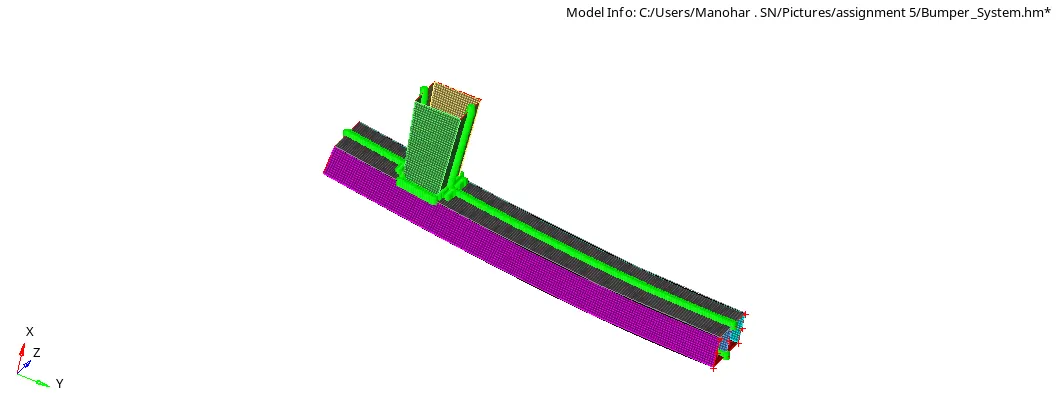
fig shows the meshing and connections of the bumper system
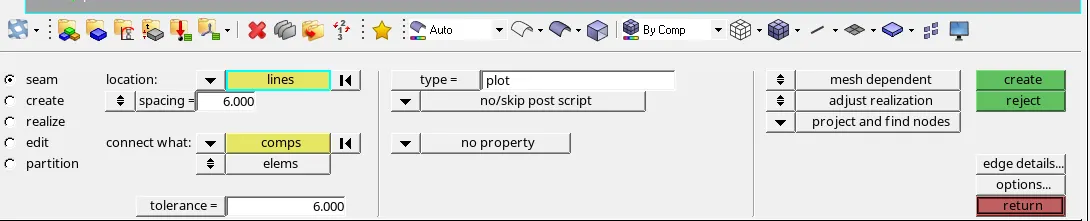
fig shows the 1d seam connections and value of spacing and tolerance
case1:Run the crash tube model as it is
1.Import the crash tube model as crash tube_0000.rad file and then go to the radioss option and set export as all and include connectors and in the option tab make -nt 4 ( no of threads) to speed up the simulation.
2.create the TH/part in the outblock section and then select the all the components in that TH/part section.
3.After the set of all click the radioss button and run the simulation and then switch the windows to hyperview section in that import the h3d file and then run simulation of the contact forces and note down the max and min forces at the particular nodes.
4.Then switch the windows to the hyper2d graph and import the t01 file and then plot the graphs include the internal energy and the rigidwall forces and the contact energy.
5.After all the plots of graphs completed note down the mass and energy errors in the crash tube_0001 file and then the mass error for this case is 0 and the max energy error is that -3.8%
6.compare the results of the internal energy and the rigid wall forces and contact forces.
7.Note down the simulation time and the no of cycles required to complete the simulation .
simulation time:284.25sec
No of cycles:83469
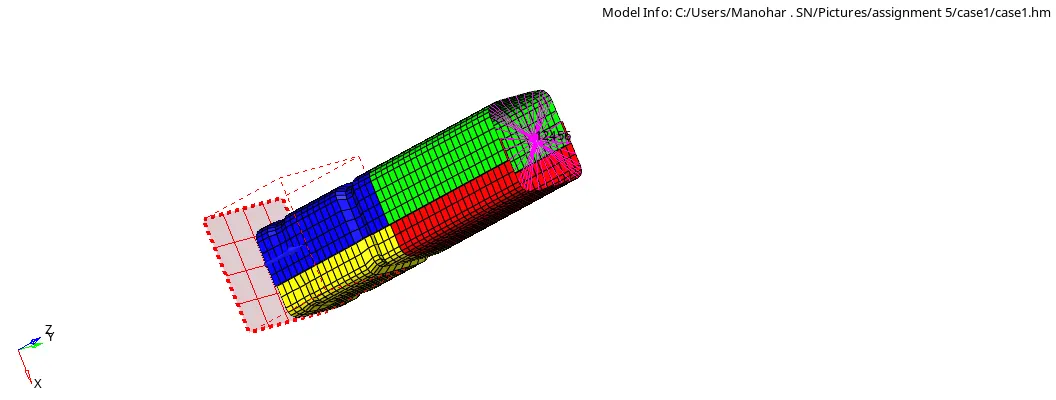
fig shows the import of the model
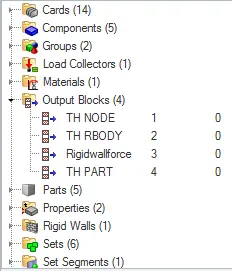
fig shows the create of the TH/part in the output block section.
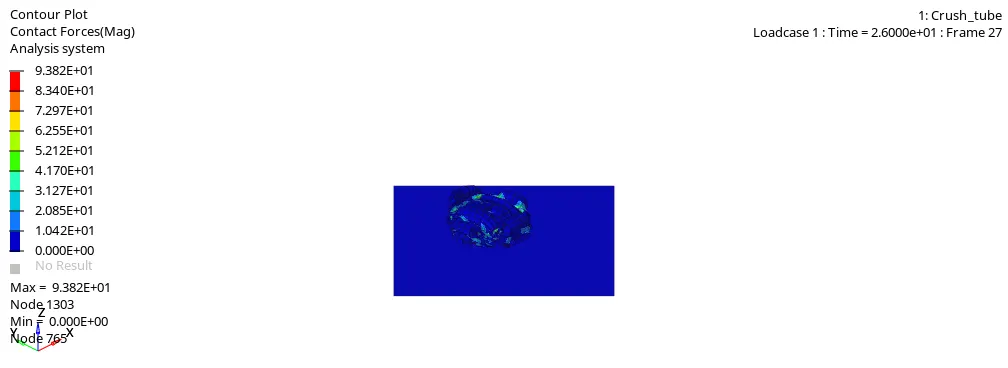
fig shows the contact forces max 9.382E+01 at a node 1303 and the min is 0 at the node765.
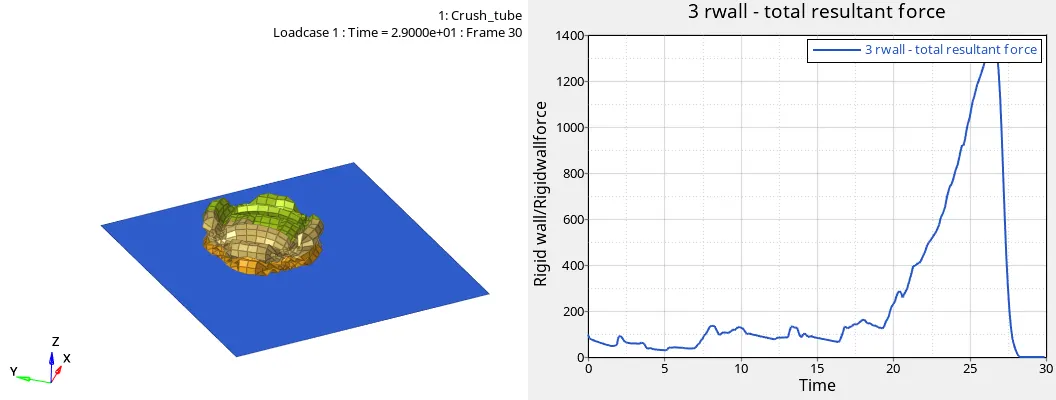
fig shows the rigid wall forces (resultant) varies with time
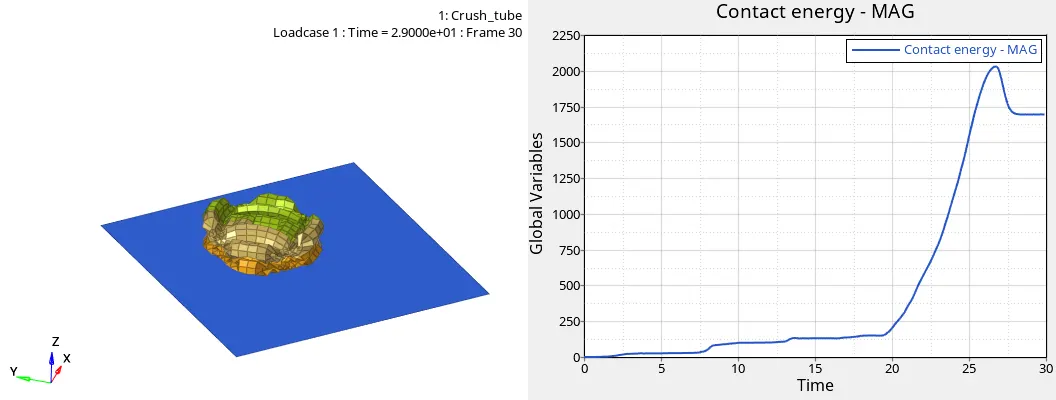
fig shows the contact energy varies with time
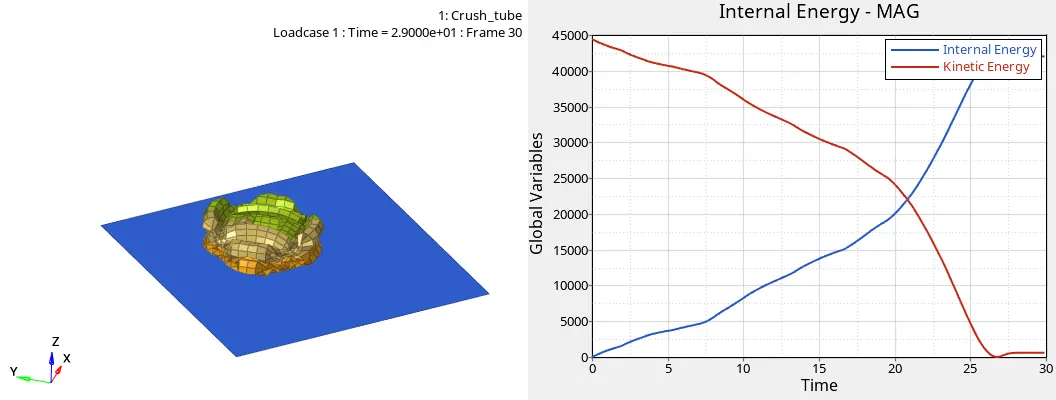
fig shows the internal energy increases with increase of time and kinetic energy decreases with increase of time .Increase of interanl energy is due to the component undergoes deformation leads to the strain energy (as change of its shape and size).
case2: Change the Inacti=6 and run.
1.Import the crash tube model as crash tube_0000.rad file and then go to the radioss option and set export as all and include connectors and in the option tab make -nt 4 ( no of threads) and change the action to take if intial penetrations exist in the inacti ie 6 and then run the simulation.
2.create the TH/part in the outblock section and then select the all the components in that TH/part section.
3.After the set of all click the radioss button and run the simulation and then switch the windows to hyperview section in that import the h3d file and then run simulation of the contact forces and note down the max and min forces at the particular nodes.
4.Then switch the windows to the hyper2d graph and import the t01 file and then plot the graphs include the internal energy and the rigidwall forces and the contact energy.
5.After all the plots of graphs completed note down the mass and energy errors in the crash tube_0001 file and then the mass error for this case is 0 and the max energy error is that -3.8%
6.compare the results of the internal energy and the rigid wall forces and contact forces.
7.Note down the simulation time and the no of cycles required to complete the simulation .
simulation time:276.80sec
No of cycles:83469
fig shows the import of model
fig shows the create of the TH/part in the output block section.
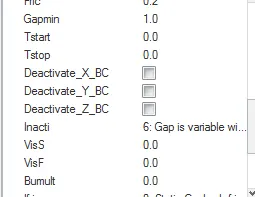
fig shows the change of action to take if intial penetrations exist (inacti)
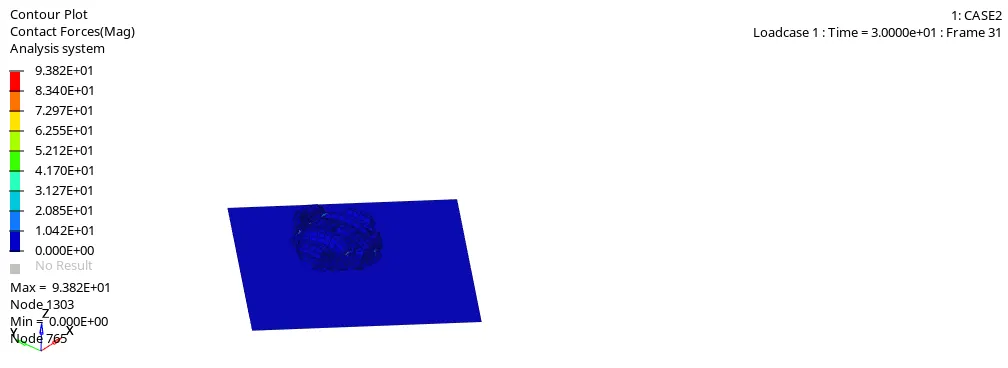
fig shows the contact forces of max 9.382E+01 at node1303 and min is 0 at a node 765.
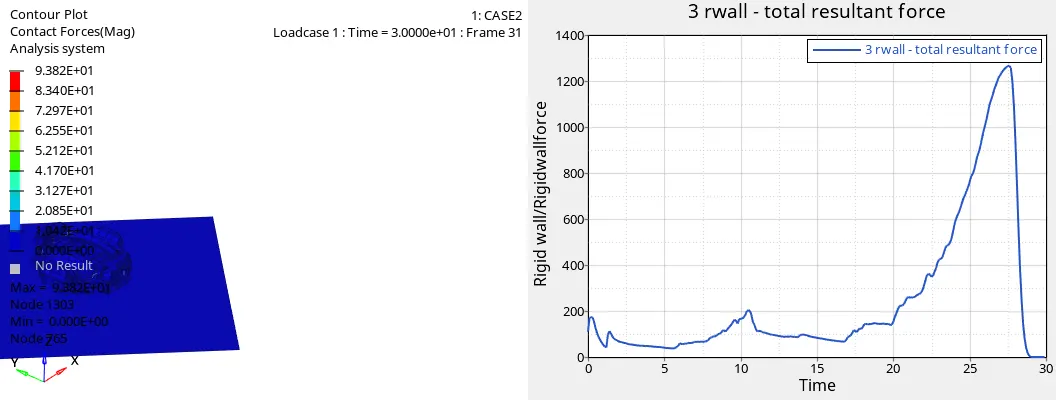
fig shows the rigid wall forces can varies with time
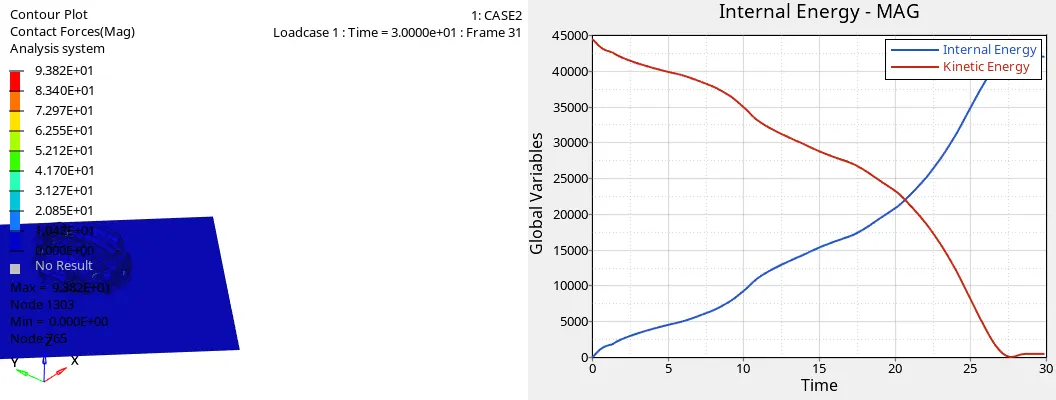
fig shows the internal energy increases with increase of time and kinetic energy decreases with increase of time .Increase of interanl energy is due to the component undergoes deformation leads to the strain energy (as change of its shape and size).
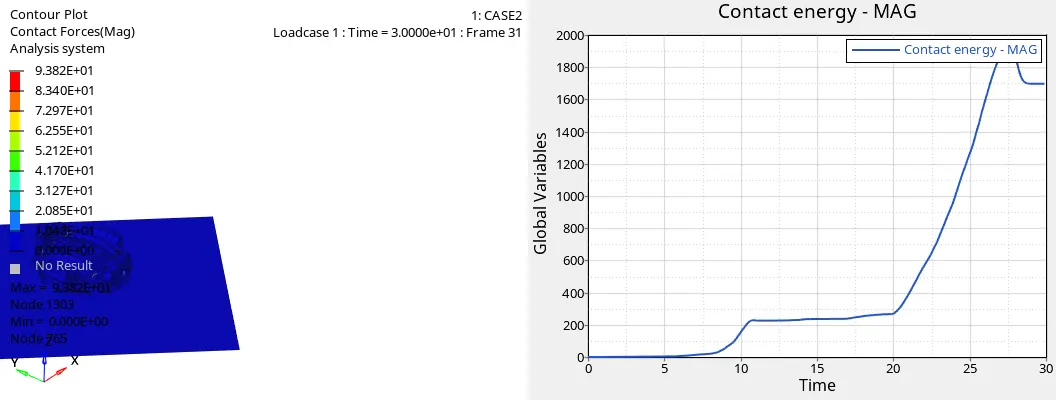
fig shows the contact energy varies with respect to time
case3: Create the type 11 contact and run.
1.Import the crash tube model as crash tube_0000.rad file and then go to the radioss option and set export as all and include connectors and in the option tab make -nt 4 ( no of threads) to speed up the simulation and then change the type of contact from type7(node to surface contact) to type 11(edge to edge contact).
2.create the TH/part in the outblock section and then select the all the components in that TH/part section.
3.After the set of all click the radioss button and run the simulation and then switch the windows to hyperview section in that import the h3d file and then run simulation of the contact forces and note down the max and min forces at the particular nodes.
4.Then switch the windows to the hyper2d graph and import the t01 file and then plot the graphs include the internal energy and the rigidwall forces and the contact energy.
5.After all the plots of graphs completed note down the mass and energy errors in the crash tube_0001 file and then the mass error for this case is 0 and the max energy error is that -3.9%.
6.compare the results of the internal energy and the rigid wall forces and contact forces.
7.Note down the simulation time and the no of cycles required to complete the simulation .
simulation time:384.10 sec
no of cycles:94688
fig shows the import of the model
fig shows the create of the TH/part in the output block section.
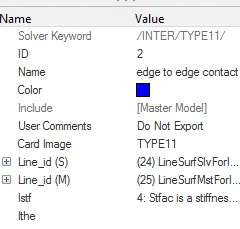
fig shows the change of contact type7 to type11
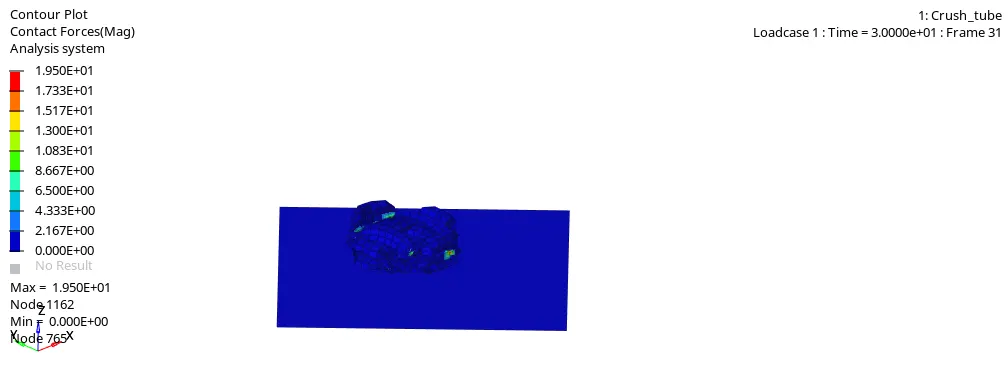
fig shows the contact force will bw max of 1.950E+01 at node1162 and min of 0 at node 765.
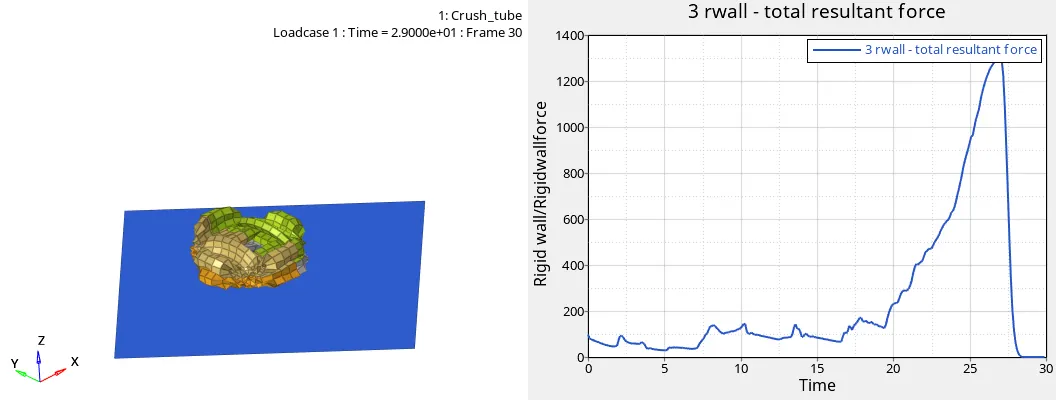
fig shows the variation of rigid wall resulatant force with time
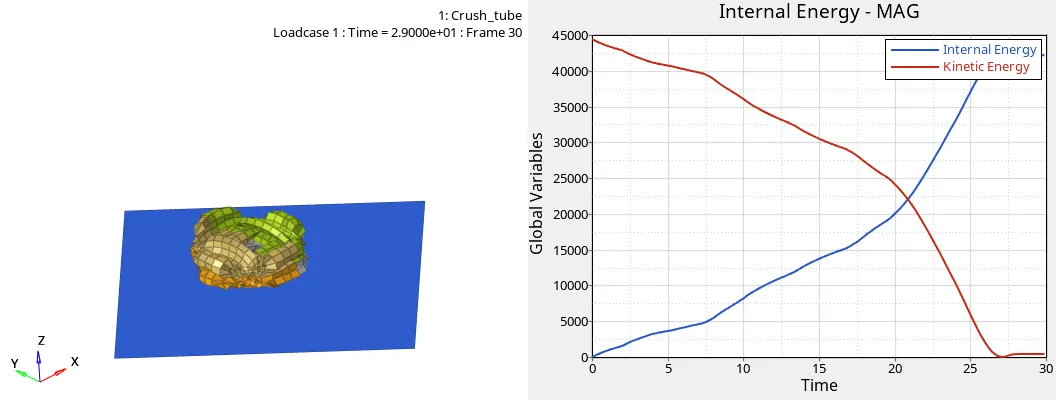
fig shows the internal energy increases with increase of time and kinetic energy decreases with increase of time .Increase of interanl energy is due to the component undergoes deformation leads to the strain energy (as change of its shape and size).
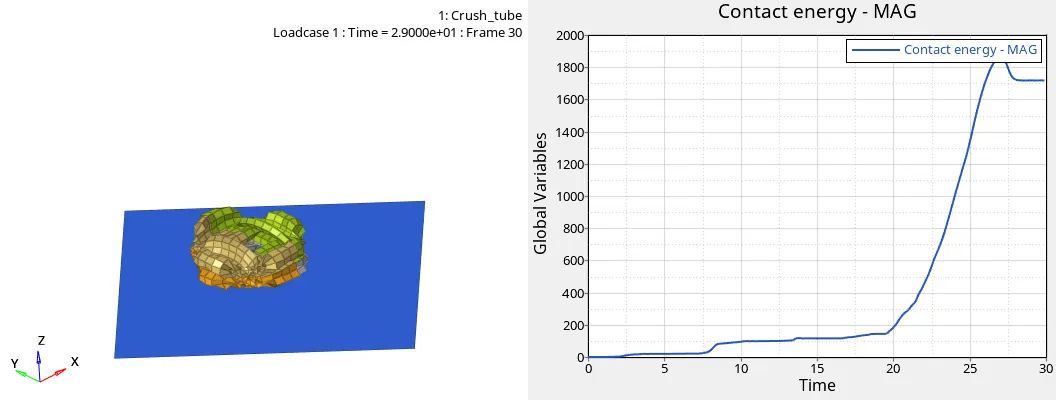
fig shows the variation of contact energy with time
case4: Remove both notches and remove boundary condition on rigid body node then run.
1.Import the crash tube model as crash tube_0000.rad file and then go to the radioss option and set export as all and include connectors and in the option tab make -nt 4 ( no of threads) to speed up the simulation.
2.Remove the notches (dent regions) by using the f7 option (align node) to remove dent region and to remove the boundry condition in load collectors switch off the 6 degress of freedom and geometry.
3.create the TH/part in the outblock section and then select the all the components in that TH/part section.
4.After the set of all click the radioss button and run the simulation and then switch the windows to hyperview section in that import the h3d file and then run simulation of the contact forces and note down the max and min forces at the particular nodes.
5.Then switch the windows to the hyper2d graph and import the t01 file and then plot the graphs include the internal energy and the rigidwall forces and the contact energy.
6.After all the plots of graphs completed note down the mass and energy errors in the crash tube_0001 file and then the mass error for this case is 0 and the max energy error is that -3.1%.
7.compare the results of the internal energy and the rigid wall forces and contact forces.
8.Note down the simulation time and the no of cycles required to complete the simulation .
simulation time:285.32sec
no of cycles:80992
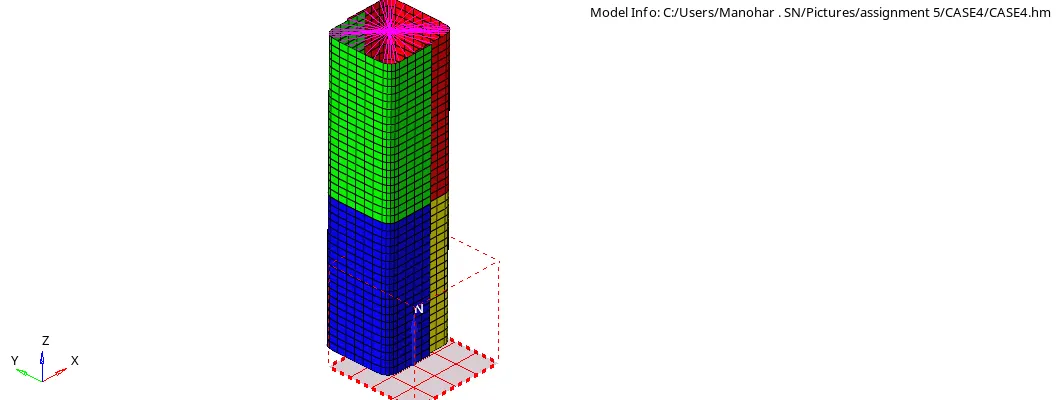
fig shows the model witout notches(dent regions)
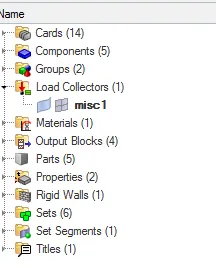
fig shows the remove of boundry conditions
fig shows the create of the TH/part in the output block section.
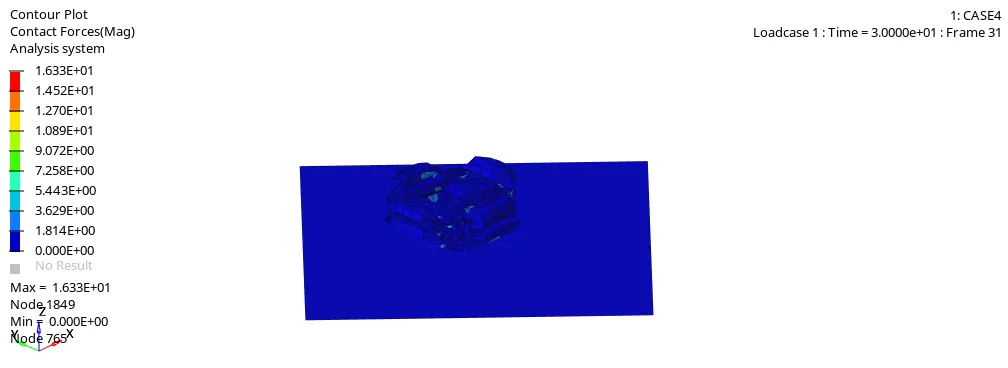
fig shows the contact forces is max 1.633e+01 at node 1849 and min 0 at node 765.
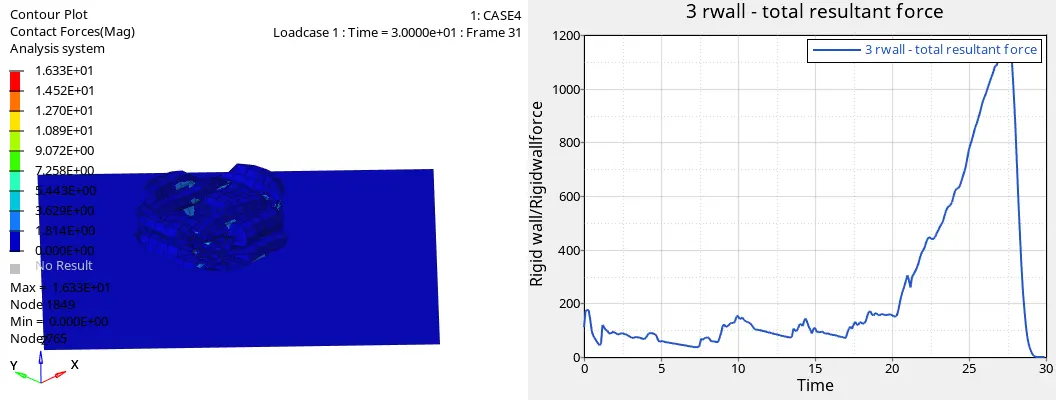
fig shows the rigid wall forces (resultant forces) varies with time.
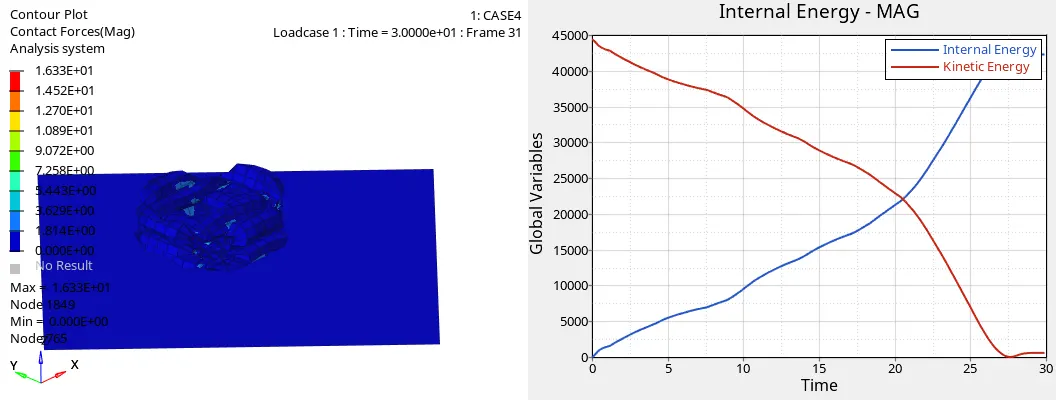
fig shows the internal energy increases with increase of time and kinetic energy decreases with increase of time .Increase of interanl energy is due to the component undergoes deformation leads to the strain energy (as change of its shape and size).
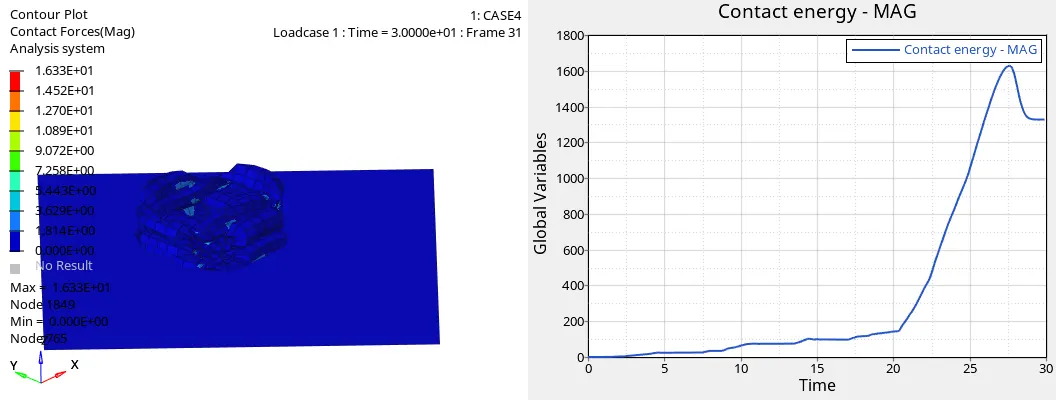
fig shows that contact energy varies with time
case5: Create a new notch in the middle ,select the whole section and run.
1.Import the crash tube model as crash tube_0000.rad file and then go to the radioss option and set export as all and include connectors and in the option tab make -nt 4 ( no of threads) to speed up the simulation.
2.create the new notch (dent region) in the middle by using the translate option(shift+f4 option) or the f7 option using align node option.
3.create the TH/part in the outblock section and then select the all the components in that TH/part section.
4.After the set of all click the radioss button and run the simulation and then switch the windows to hyperview section in that import the h3d file and then run simulation of the contact forces and note down the max and min forces at the particular nodes.
5.Then switch the windows to the hyper2d graph and import the t01 file and then plot the graphs include the internal energy and the rigidwall forces and the contact energy.
6.After all the plots of graphs completed note down the mass and energy errors in the crash tube_0001 file and then the mass error for this case is 0 and the max energy error is that -0.2%.
7.compare the results of the internal energy and the rigid wall forces and contact forces.
8.Note down the simulation time and the no of cycles required to complete the simulation
simulation time:374.31sec
no of cycles:102206
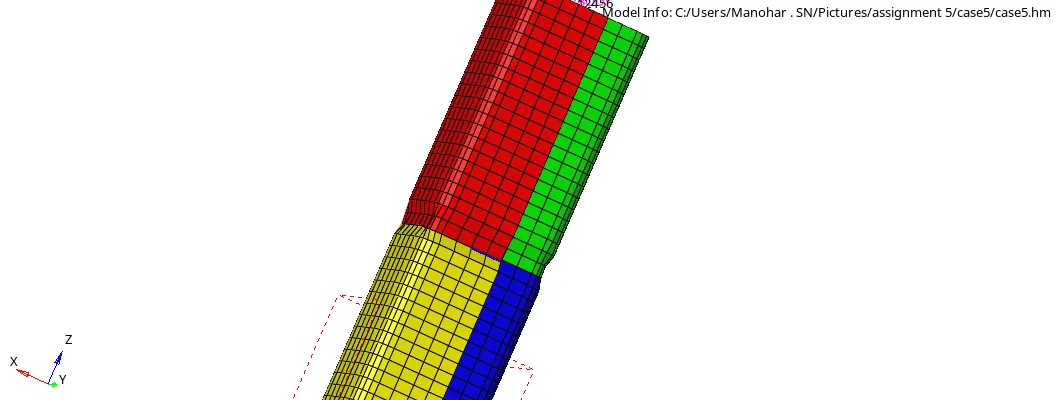
fig shows the creating of notch at the middle
fig shows the create of the TH/part in the output block section.
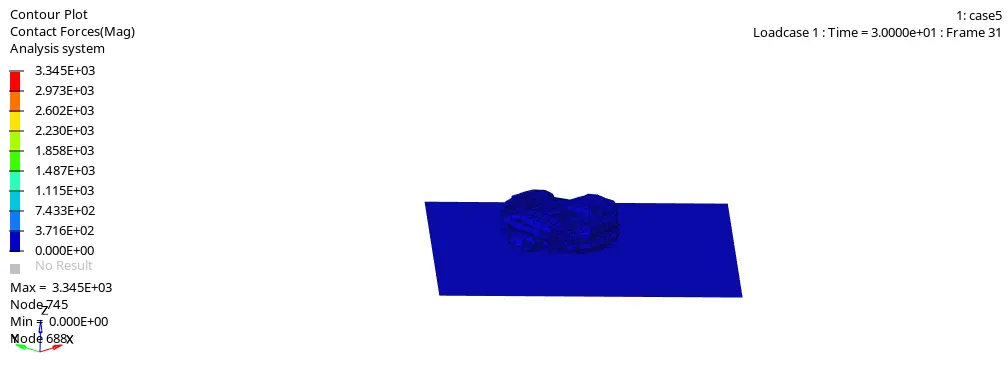
fig shows the contact forces is max of 3.345E+03 at node745 and min 0 at node 688
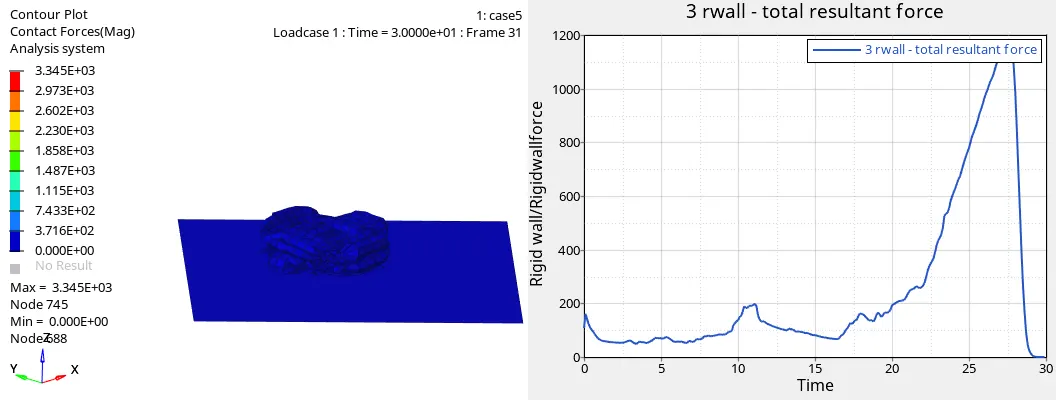
fig shows the rigid wall (resultant forces) varies with time
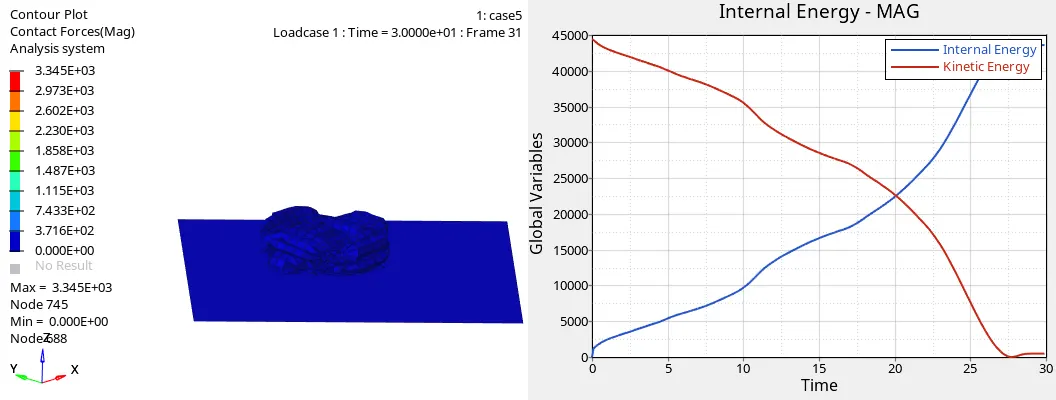
fig shows the internal energy increases with increase of time and kinetic energy decreases with increase of time .Increase of interanl energy is due to the component undergoes deformation leads to the strain energy (as change of its shape and size).
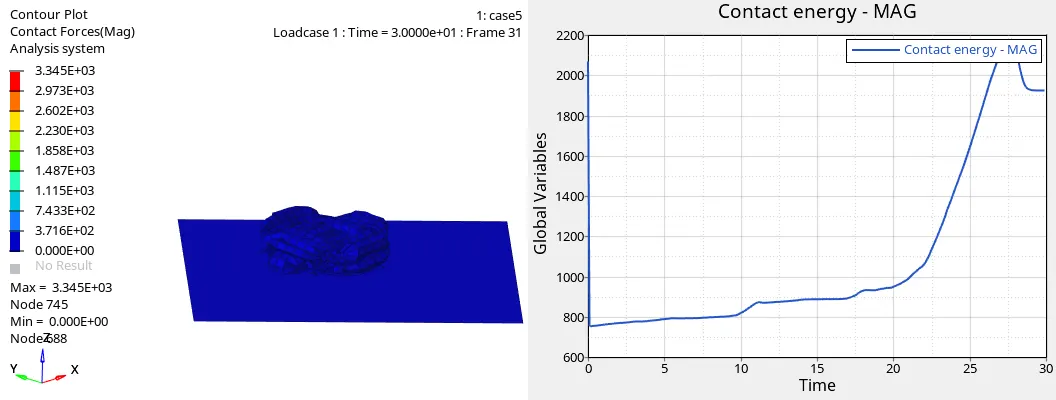
fig shows the contact energy varies with time
case6: Create a new notch with nodes only from opposing 2 faces and run
1.Import the crash tube model as crash tube_0000.rad file and then go to the radioss option and set export as all and include connectors and in the option tab make -nt 4 ( no of threads) to speed up the simulation.
2.create the new notch in opposing 2 faces by using the translate option(shiftF4 option)
3.create the TH/part in the outblock section and then select the all the components in that TH/part section.
4.After the set of all click the radioss button and run the simulation and then switch the windows to hyperview section in that import the h3d file and then run simulation of the contact forces and note down the max and min forces at the particular nodes.
5.Then switch the windows to the hyper2d graph and import the t01 file and then plot the graphs include the internal energy and the rigidwall forces and the contact energy.
6.After all the plots of graphs completed note down the mass and energy errors in the crash tube_0001 file and then the mass error for this case is 0 and the max energy error is that -3.9%.
7.compare the results of the internal energy and the rigid wall forces and contact forces.
8.Note down the simulation time and the no of cycles required to complete the simulation
simulation time:289.44sec
no of cycles:69845
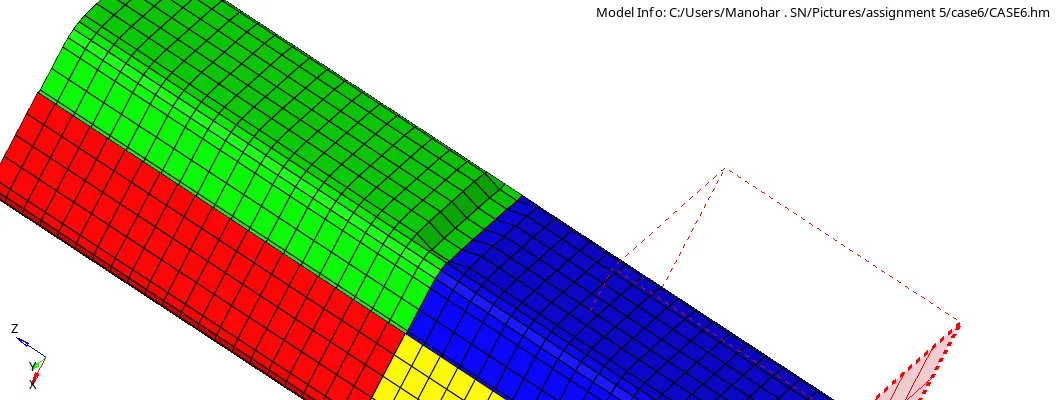
fig shows the notch created on the opposing two faces
fig shows the create of the TH/part in the output block section.
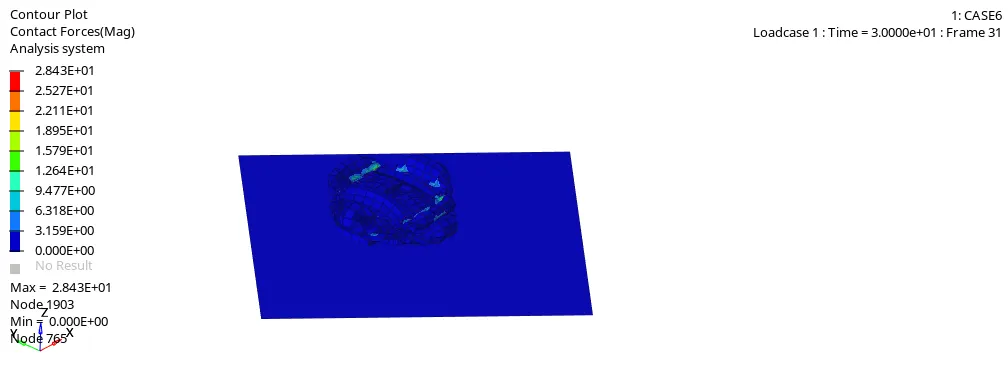
fig shows the contact forces is of max 2.843E+01 at node 1903 and min of 0 at the node 765
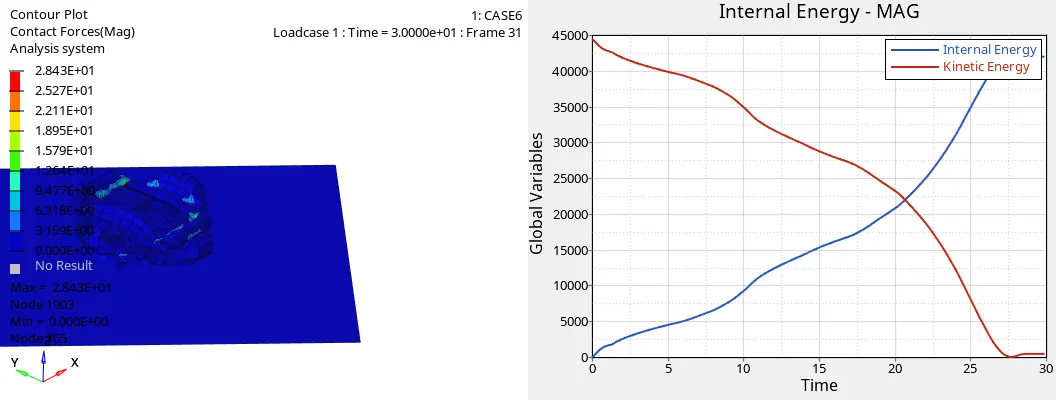
fig shows the internal energy increases with increase of time and kinetic energy decreases with increase of time .Increase of interanl energy is due to the component undergoes deformation leads to the strain energy (as change of its shape and size).
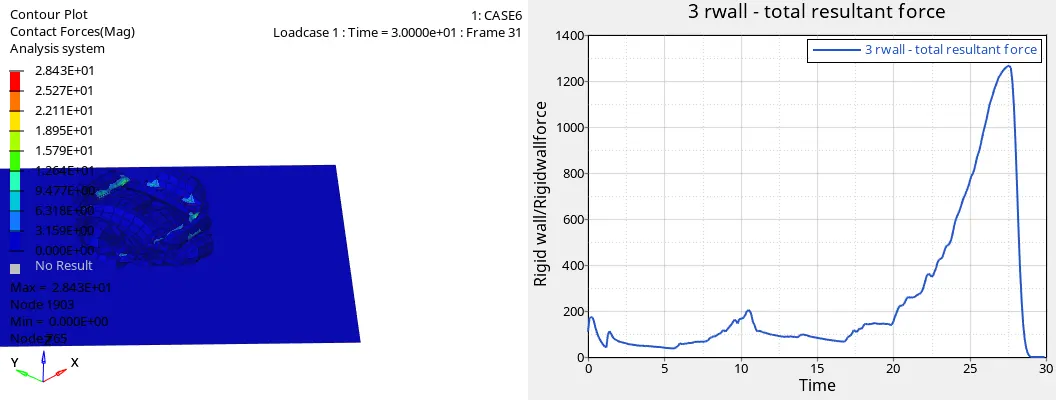
fig shows the rigid wall (resultant forces) varies with time
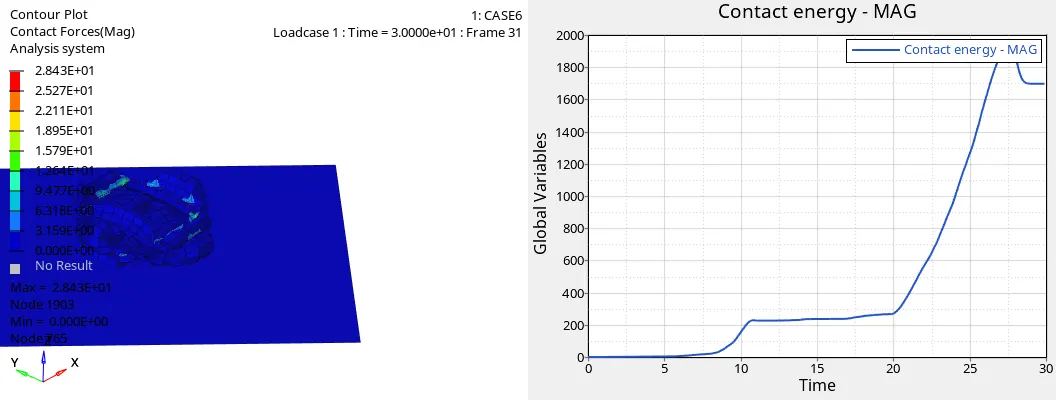
fig shows the contact energy varies with time
comparision of results
simulation time and no of cycles
| cases | simulation time(sec) | no of cycles |
| case1 | 284.25 | 83469 |
| case2 | 276.80 | 83469 |
| case3 | 384.10 | 94688 |
| case4 | 285.32 | 80992 |
| case5 | 374.31 | 102206 |
| case6 | 289.44 | 69845 |
Energy errors
| cases | mass error(%) | energy error(%) |
| case1 | 0 | -3.8 |
| case2 | 0 | -3.8 |
| case3 | 0 | -3.9 |
| case4 | 0 | -3.1 |
| case5 | 0 | -0.2 |
| case6 | 0 | -3.9 |
contact forces
| cases | min (force) | max (force) |
| case1 | 0 | 9.382E+01 |
| case2 | 0 | 9.382E+01 |
| case3 | 0 | 1.950E+01 |
| case4 | 0 | 1.633E+01 |
| case5 | 0 | 3.345E+03 |
| case6 | 0 | 2.843E+01 |
- Notch effects on the both the simulation time and the no of cycles that changes when compared to the include notches in case1,2,3, so that change in simulation time and the no of cycles changes as indicated in the table shown above and also it effects on the energy errors that is also changes when compare to case1,2,3.
- Notch also effects on the contact force due to the deformation and the strain energy that stored as compared to case1,2,3 the contact energy is small and due to remove of the notches so changes of the contact energy takes place.
- The internal energy increases with increase of time and kinetic energy decreases with increase of time .Increase of internal energy is due to the component undergoes deformation leads to the strain energy (as change of its shape and size).
conclusion:
In these assignment learnt about the interfaces ie type 7 and type11 and type24 and also learnt about the comparision of results energy error and mass errors and different plots including the rigid walls forces, contact forces,internal energies and notches and their effects on results.