Assignment 4-RADIOSS Material Laws Challenge
Objective
To perform a simulation of a rigid sphere hitting a plate with all the cases given in the question.
Case 1
The simulation was performed with out making any changes to the given file. The objective of the simulation was to perform with both the failure plastic strain(EPS_P_Max) and fail_Johnson failure card enabled.
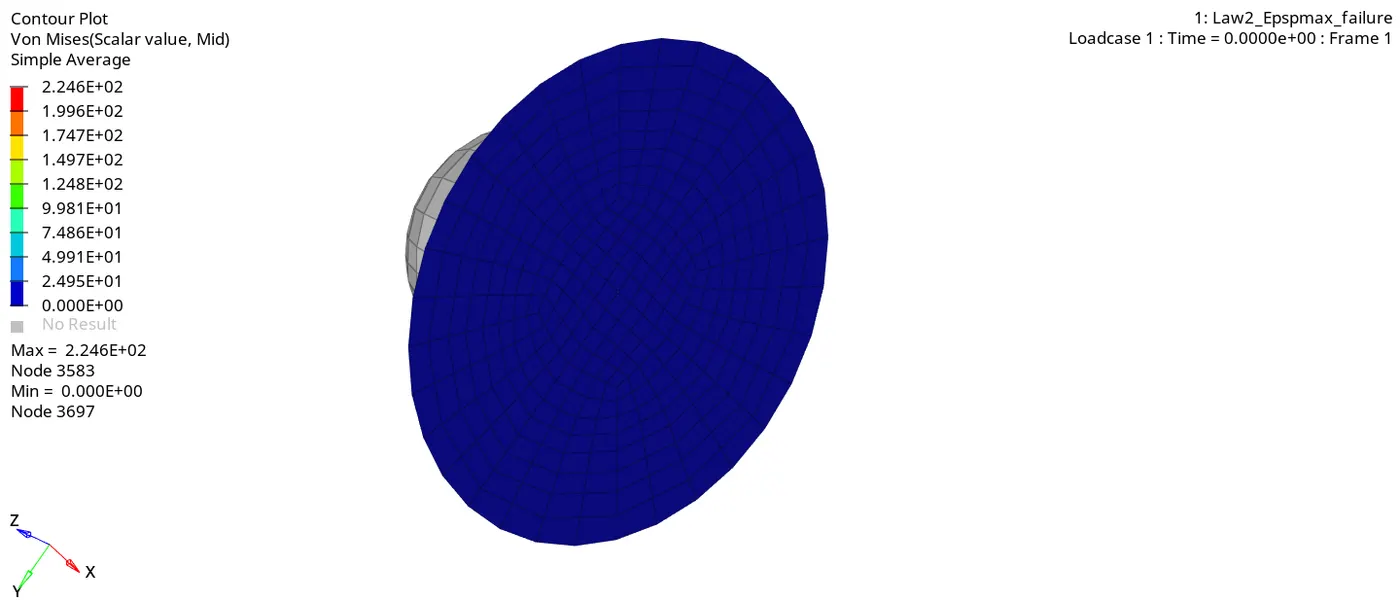
The case 1 is having EPS_P_Max values and fail-johnson model is enabled which is a ductile failure mode. The fail-Jhonson failure model calculates the plastic strain using five parameters, D1 D2 D3 D4 and D5. The vales for D1 D2 D3 are calculated in the in laboratory conditions by performing loading conditions such as pure tension, pure shear or pure compression.
Here the failure is defined by the Ixfem value. A value of 0 will lead to the failed element getting deleted and 1 will make the element fail by crack propogation. Dadv value can be varried from 0 to 1 which enhance the crack propogation.
Here the elements are deleted as the ixfem was defined as 0. The maximum stress generated on the node 3583.
Energy plot
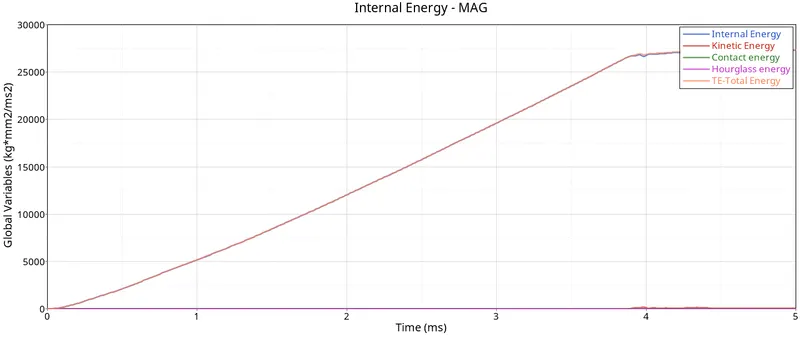
From the energy plot it can be seen that kinetic and internal energy increases, after some time there is a dip in internal energy. This is because the hole was punched by the rigid ball and elements was thrown away from the plate thus decreasing the internal energy.
Resultant force vs time
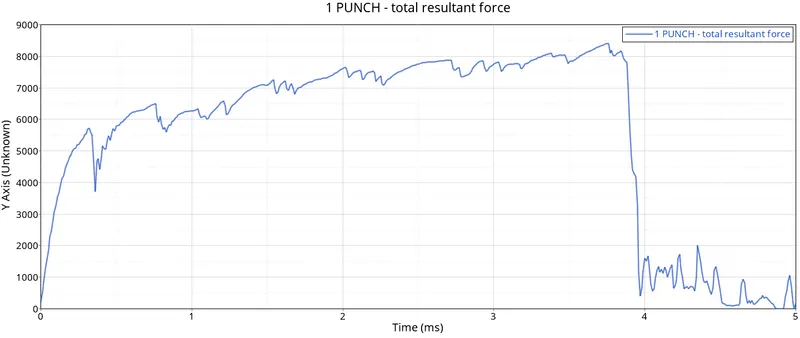
From this plot its seen that there is an increase in rigid wall force during the impact. Fluctions are seens as a result of element deletation. After some time there is a steep decrease in the force value.
Case2
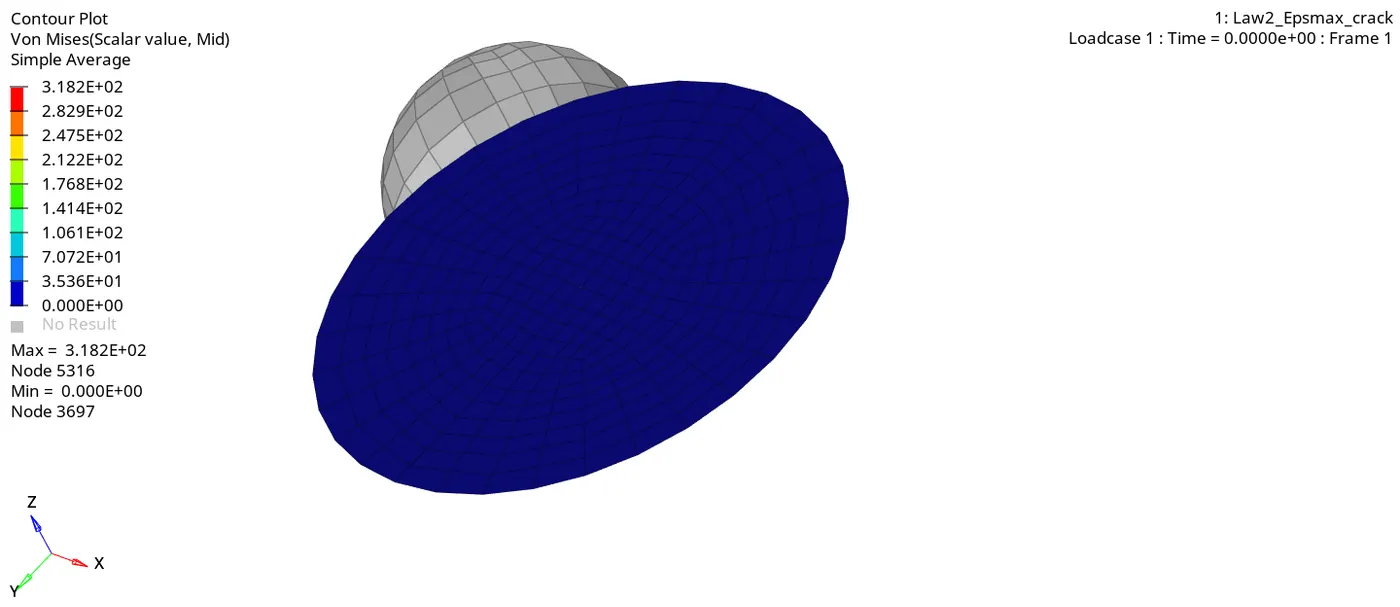
In case 2 the Ixfem value was changed to 1 so that it enables to fail the element by crack propogation.Here the elements are not getting deleted instead a crack was propogated when it reaches the failure strain values.
Energy graph
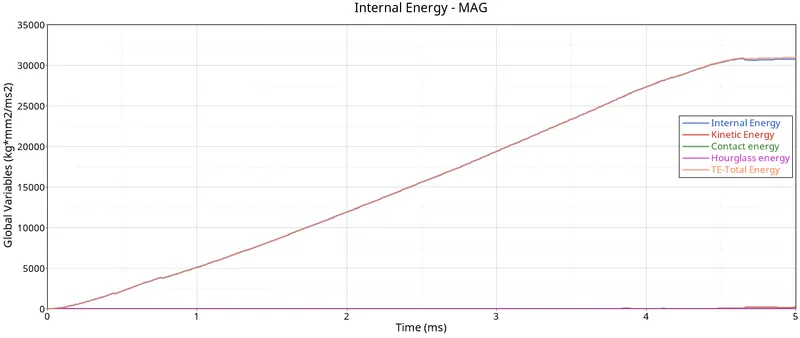
From the graph its seen that there is delay in element deletation. Here also we can see a dip in internal energy.
Resultant force vs time
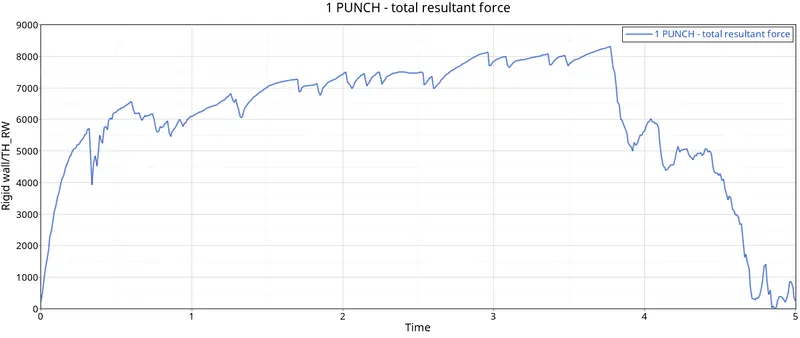
From the graph its observed that when the sphere strikes the plate, resultant force rises and after sometime there is a dip in the force plot. The is not happening in much steeper manner as that of case 1. This is beacuse of the crack propogation developed.
Case 3
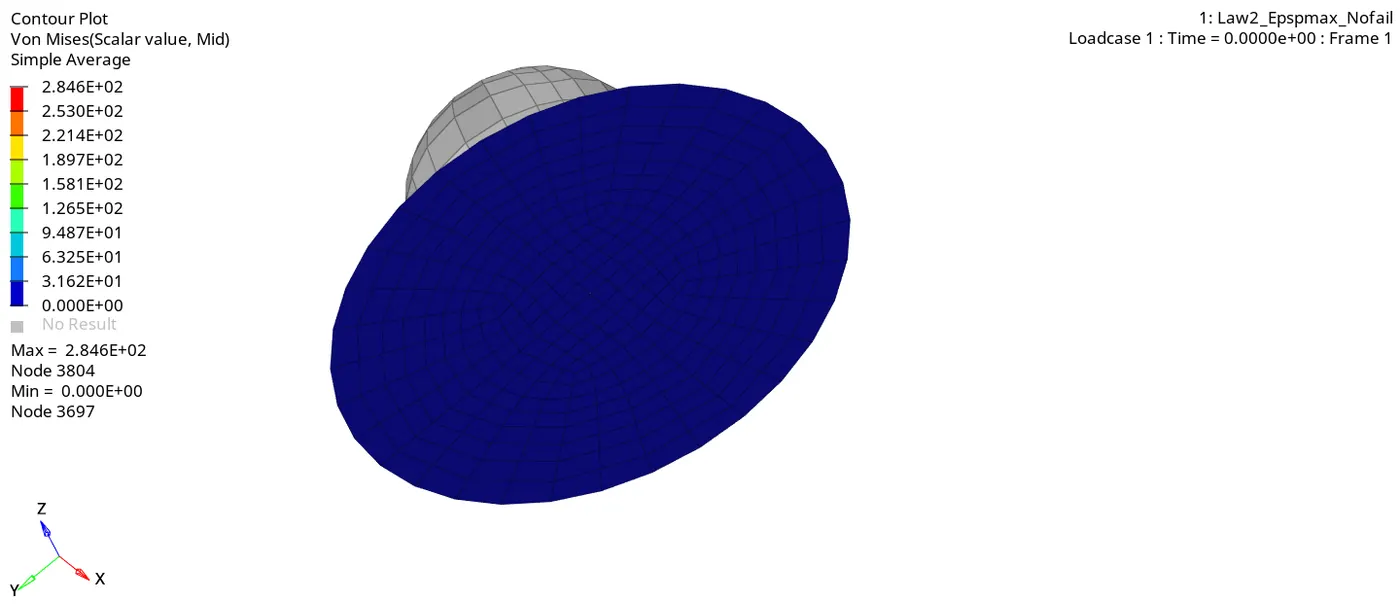
In case 3 the simulation was performed by removing the failure johnson card. Here the element will fail according to the Eps_p_Max defined in the material card.
Energy graph
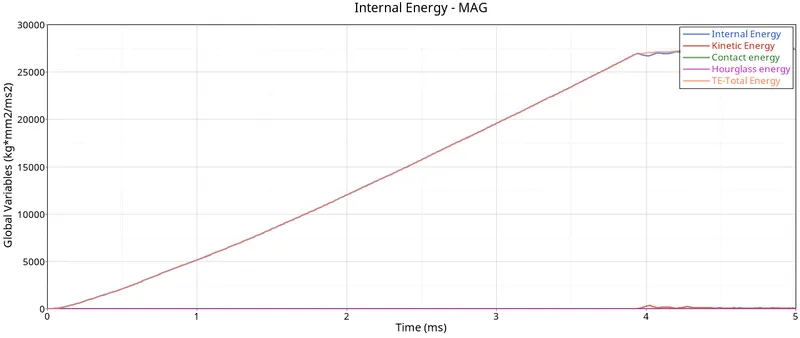
From the graph ots observed that the total energy and internal energy increases rises and after some there its constant. Also as that of the other cases there is a dip in internal energy due to the breaking of the element because of the Eps)max defined.
Resultant force vs time
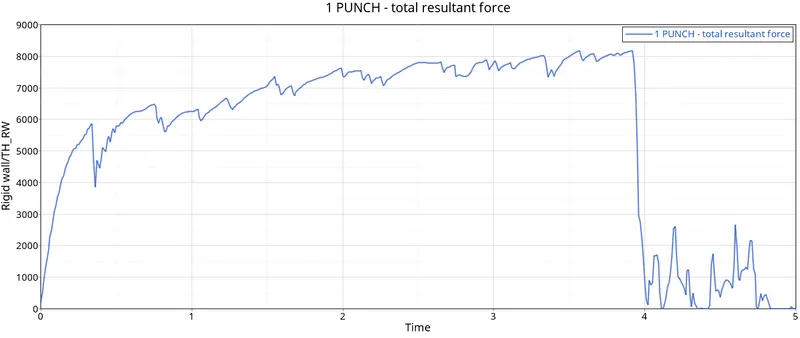
Here also was can see that the force value increases initially and after some time its decreases steeply. Here there are alot of elements braeaking off from the plate.
Case 4
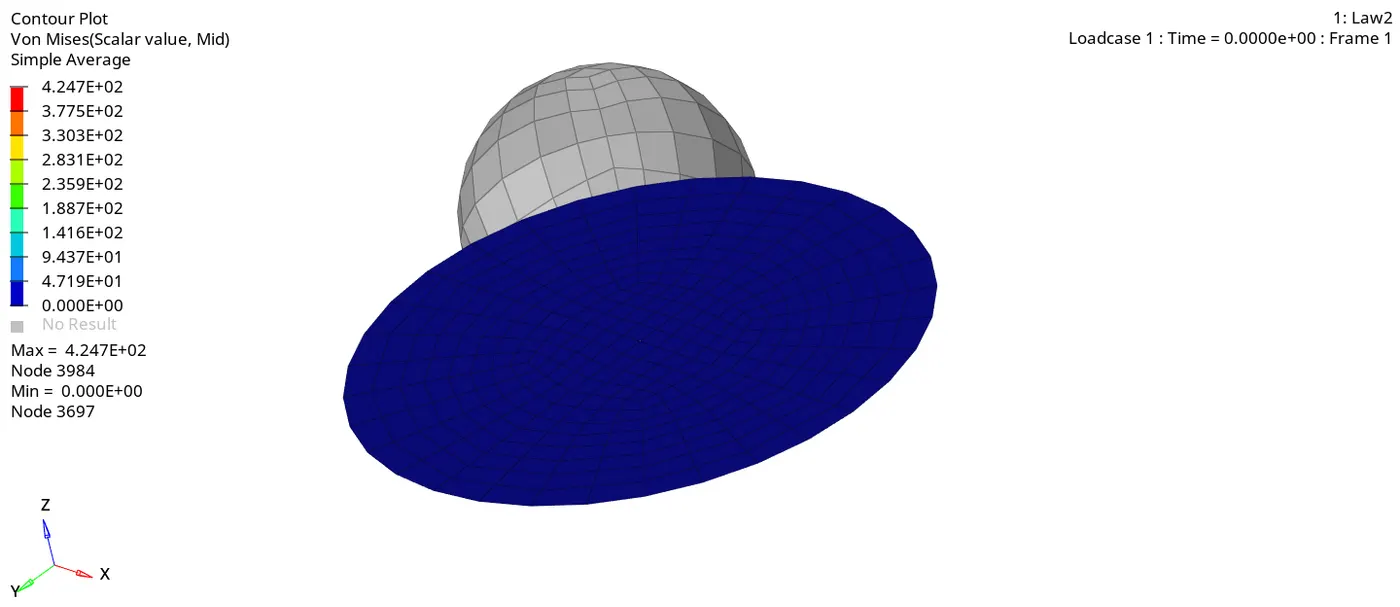
In case 4 simulation was performed by removing both the failure plastic strain and fail johnson failure card. With this there is no failure parameters defined for the plate and it can withstant inifinite strain.
Energy plot
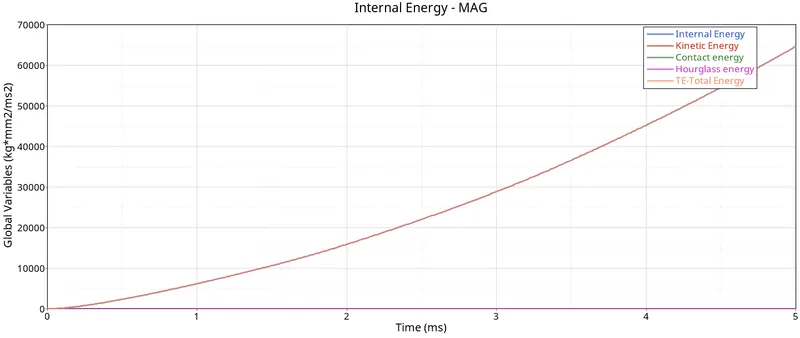
Here we can observe that the total and the internal energy increases and the increase is in a non linear manner. The hourglass energy is kept well with in the range.
Resultant force vs time
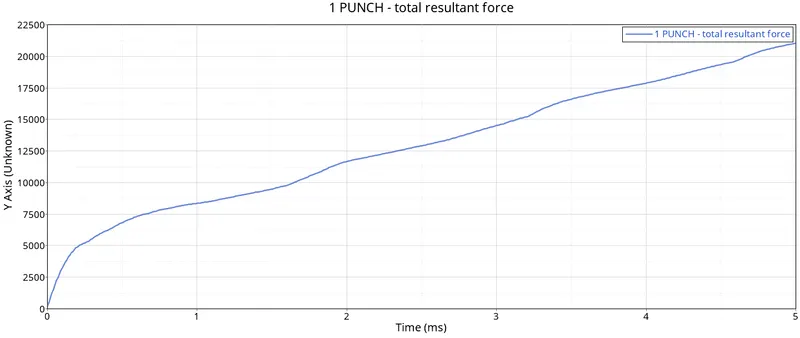
Here the force was found to be increasing continuously through out the simulation.
Case 5
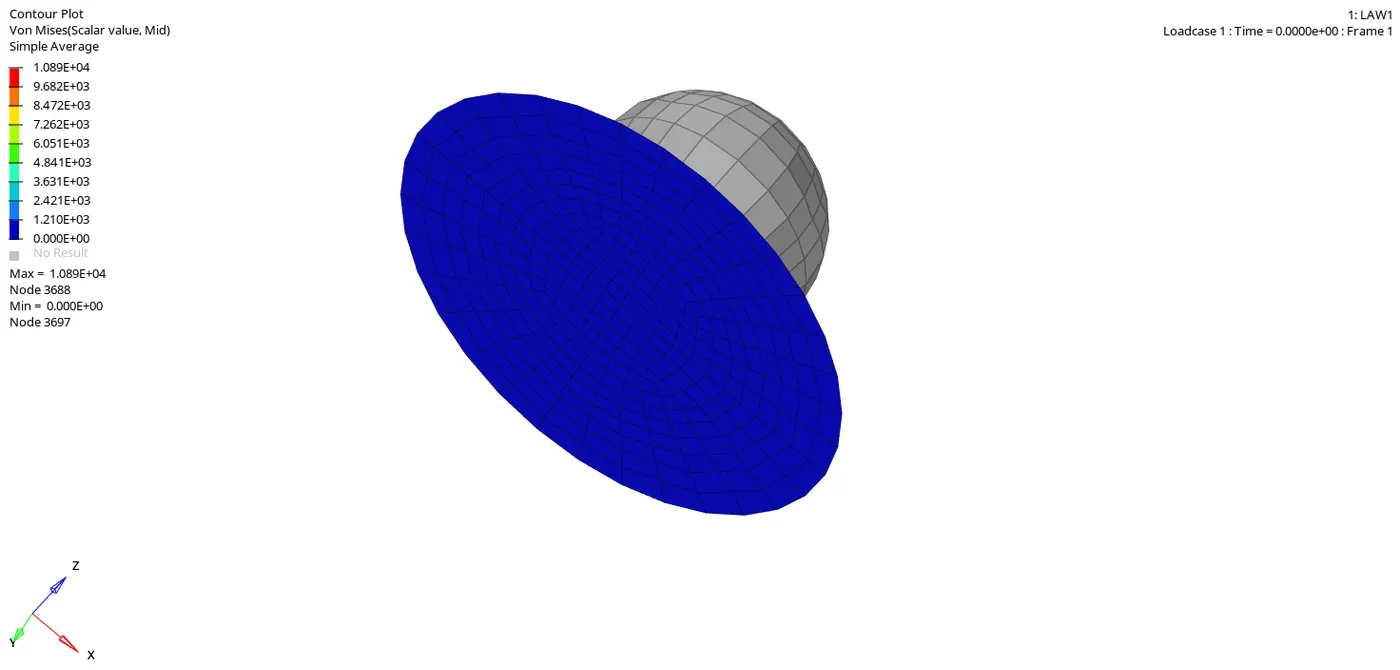
In case 5 simulation was performed after changing the material to Law 1 by keeping the same value for youngs modulus, density and poissons ratio. With this we are having an elastic material and will undergo elastic deformation during the simulation. Here there is no deleted or cracked elements.
Energy plot
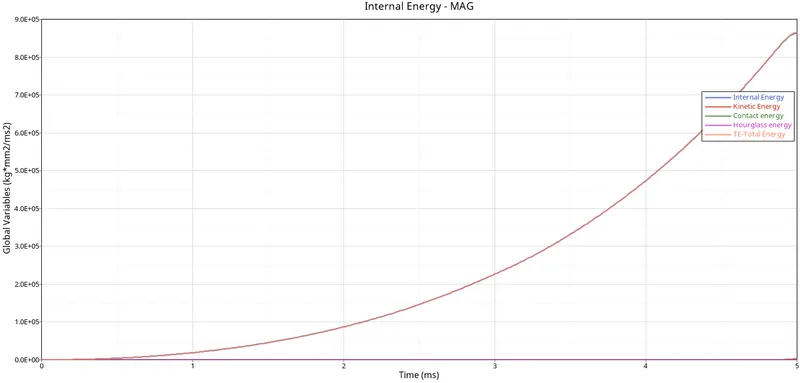
Here we can observe that the total and the internal energy increases and the increase is in a non linear manner. The hourglass energy is kept well with in the range.
Resultant force vs time
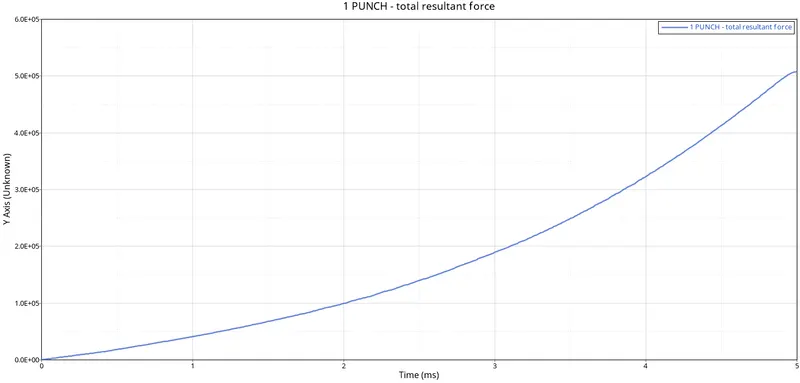
From the graph its observed that the force is increasing in an exponential manner.
Case 6
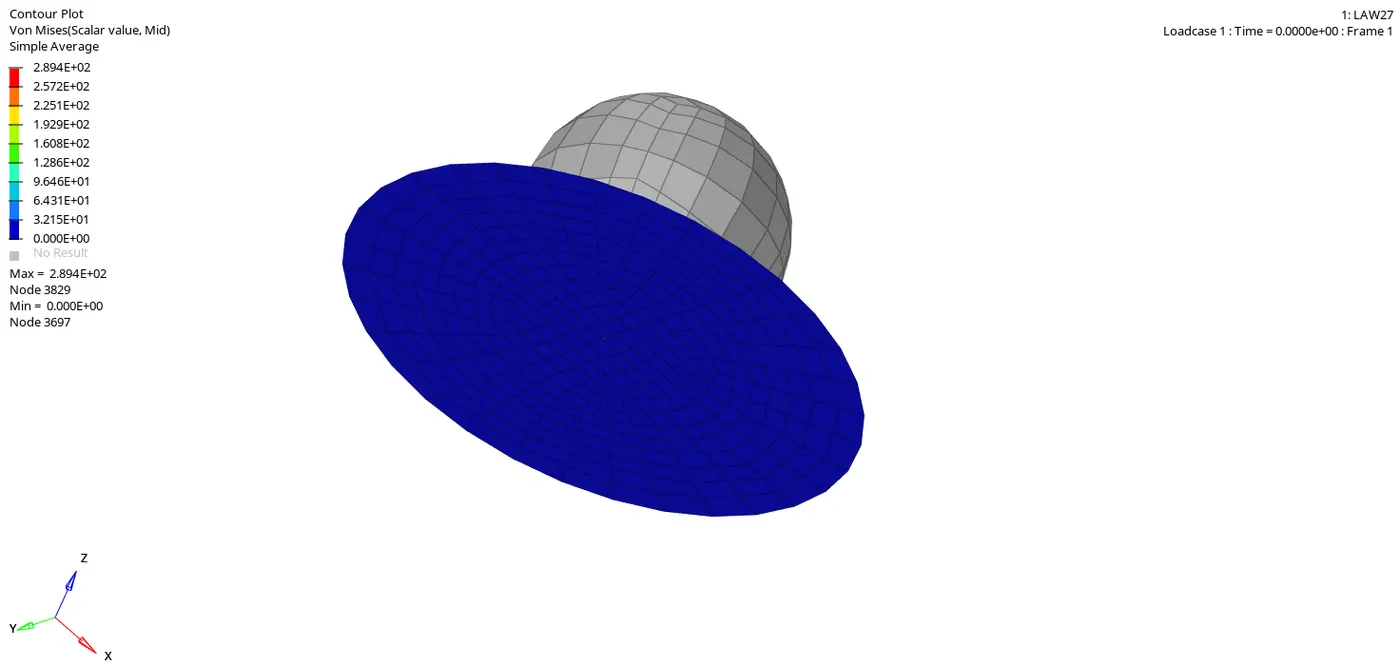
Here the simulation was performed using material law 27. This is an isotropic elasto-plastic jhonson cook material card with a brittle failure model. This law can be applied to only for the shell. Here the also we can see elements are cracking during the simulation and it breaks.
Energy graph
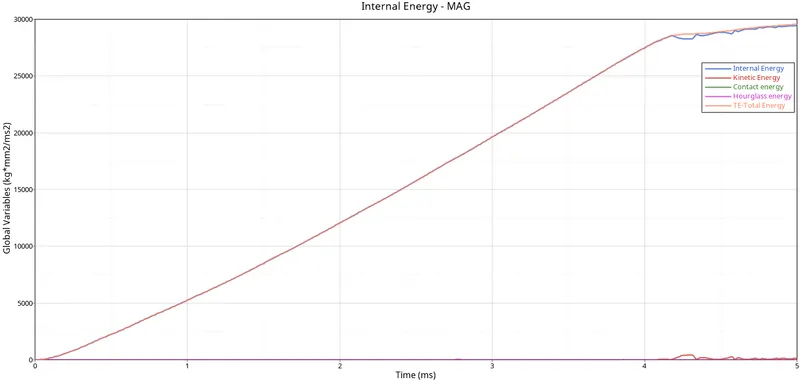
Here the total energy and kinetic energy increases initially and the as that of the previous cases it doesnot flatten out.
Resultant force vs time
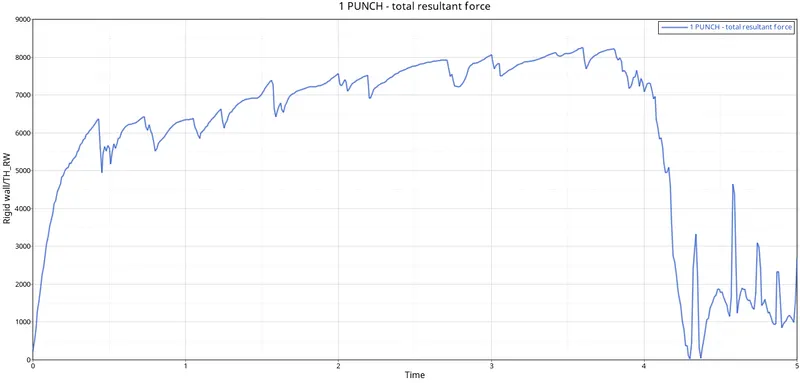
The resultant force graph looks similar to that of case 1.
Case 7
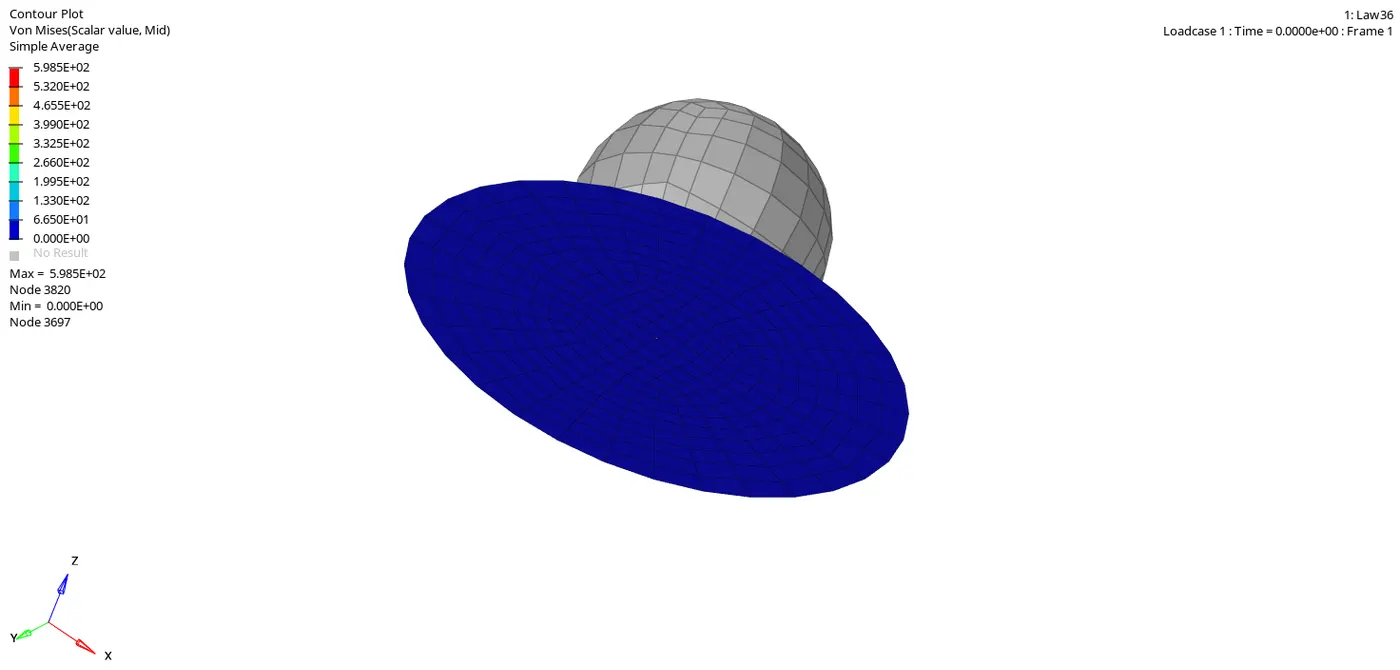
Here the simulation was performed after changing the material card to law 36 (Plas_tab). This is a law which defines an isotropic elasto plastic material using a user defined function for work hardening portion of the stress strain cure. Here a user defined fuction for different strain rates can be used. Here also the elements are getting deleted.
Energy graph
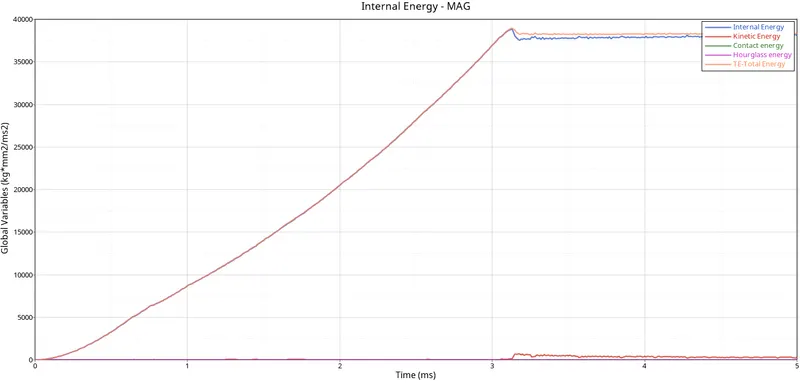
Here also as in the case 1 the internal energy increases and dip dips after reaching to a particular. Again these dip is due to the delation of the element.
Resultant force vs time
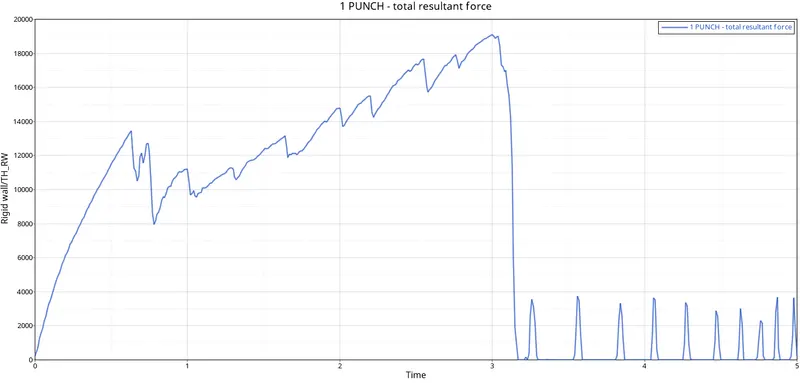
From the figure these is a rise in the force value and these are due to strain hardening and it declines steeply after some time.
______________________
File: https://drive.google.com/drive/folders/1cHco7VJRfUv-mEAjI5sjFM69TB_Lhuq4?usp=sharing