Assignment 3-2D Element Formulation Challenge
Objective:
Comparison of results with base simulation and improved shell element properties
1.Using the crash beam file from the previous assignment, change the run time to 55 ms.
2. Change the number of animation steps during simulation to a minimum of 25 and a maximum of 60.
Run the base simulation without any modification to element properties.
4. At the end of the simulation, do the energy error and mass error checks and determine whether the results would be acceptable.
5. If acceptable, plot rigid wall forces, internal energy, hourglass energy, contact energy, the total energy of the simulations.
6. Change all the shell elements properties to recommended properties, save this as separate, rad files, and run the simulation.
7. Follow steps 5 and 6.
8. Create a brief report comparing all the results from steps 5 and 6 for both simulations.
9. Comment whether there is any change in the results and why there is any change in the result.
Procedure:
1. Import the given Rad file (Starter file - Element_Formulation-Shell-3_assignment_0000) in the Hypermesh of Radioss profile.
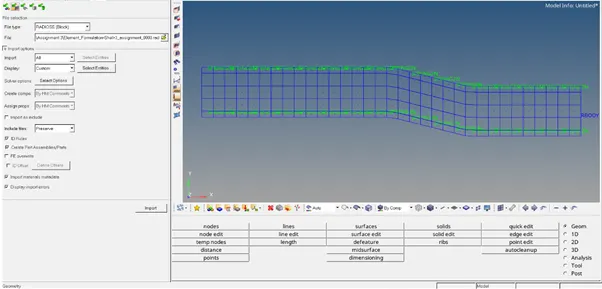
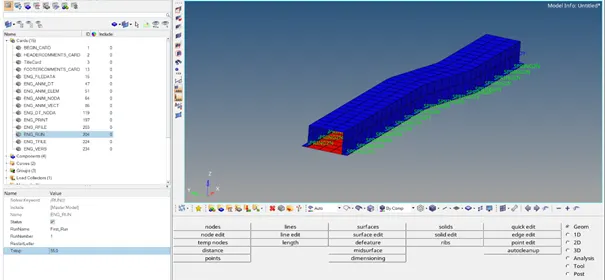
2. Assign the time step value in the card “ENG_RUN” as Tstop = 55 ms.
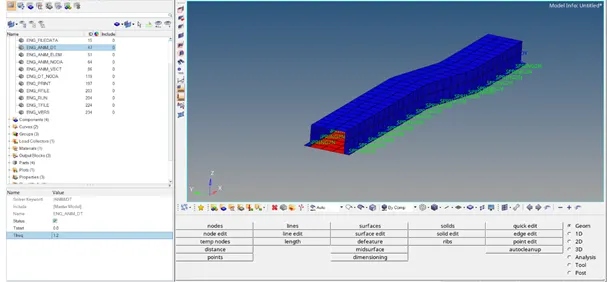
3.Assign the animation step min 25 and max 60, Hence 45 is taken. So Tfreq = Time step/ No. of Animation steps = 55 / 45 = 1.2 in “ENG_ANIM_DT” card.
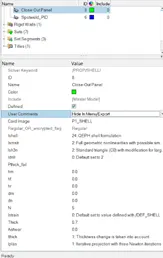
4. For CASE 2, Change the shell element properties as per recommended values.
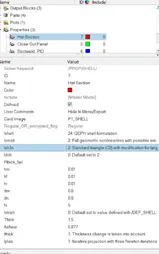
5.In Analysis panel, select Radioss and save the input file (with the above modifications) in separate folders (CASE 1 & CASE 2) (to save the animation files), mentioning the option = “-nt 4”

6.Then run the input file, by selecting Radioss to perform the simulation.
7.Check the folders (CASE 1 & CASE 2) whether the simulation files have been saved.
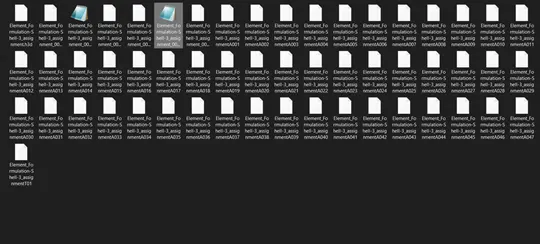
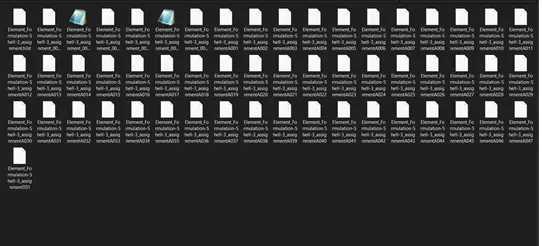
8.Check the mass error and energy error from the 0001.out file
Accepted error values are Energy = -15% to 5%, Mass = ± 2%
Case 1:
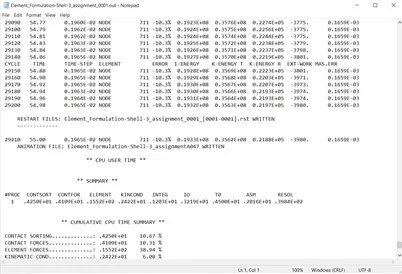
Energy Error: -10.3%
Mass Error: 0.1659*e-3
Case 2:
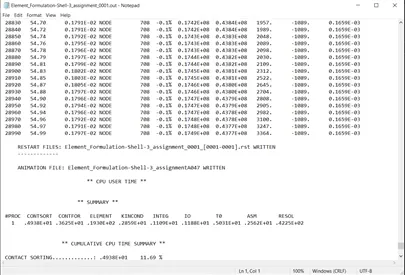
Energy Error: -0.1%
Mass Error: 0.1659*e-3
Both the errors in both cases are within acceptable limits.
9.Open the Hyperview to view the simulation (closing the Hyperworks solver view, automatically opens the Hyperview for the simulation with model and results.) and then load the model and results (.h3d) file and click apply.
10. Simulate the model by choosing displacement / Von mises stress in the result.
11.Switch to HyperGraph 2D to plot the desired graph and open the T01 data file.
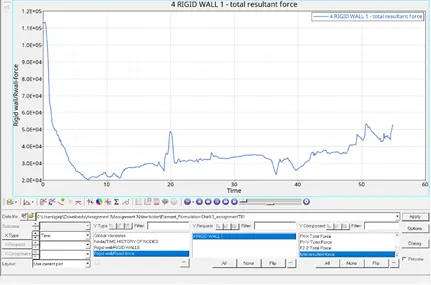
12.Plot the Rigid wall force graph
Case 1
Case 2
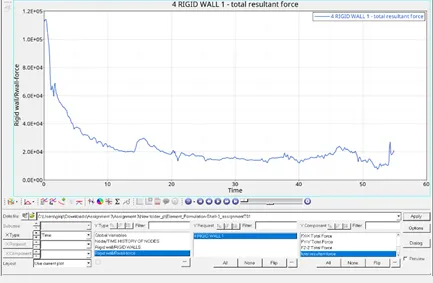
13.In both cases, force at the rigid wall is maximum during the starting point and then decreases, leads the force to the adjacent elements of the rail. But the case 2 is a little more consistent when compared to case 1.
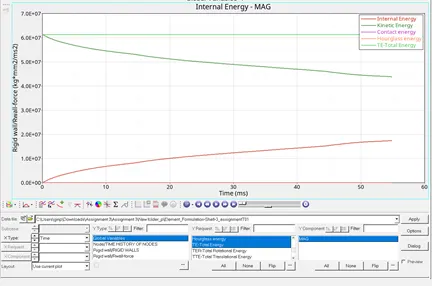
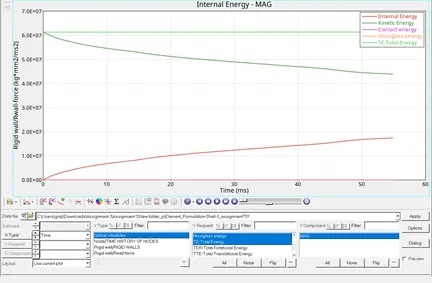
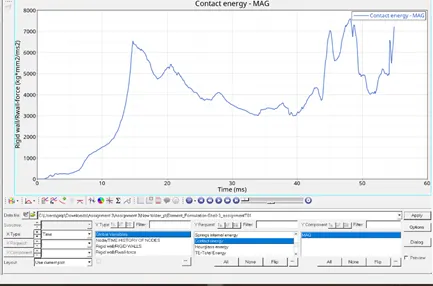
Plot the energy curves for the simulation, namely Internal Energy, Kinetic Energy, Total Energy, Hourglass energy, and Contact energy.
Case 1:
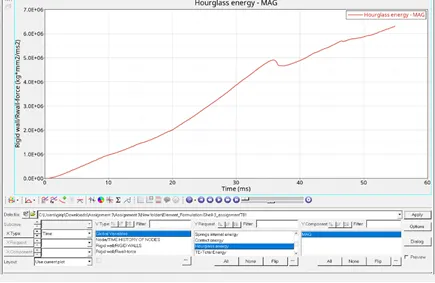
Hourglass Energy:
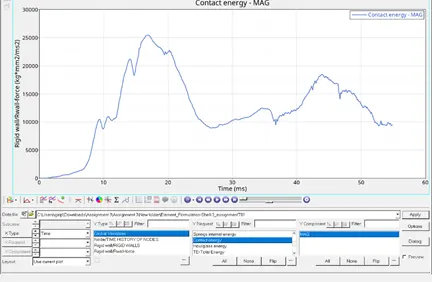
Contact Energy:
Case 2:
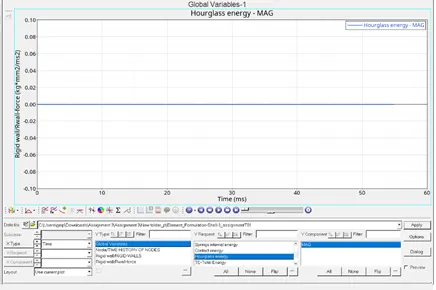
Hourglass Energy:
Contact Energy:
Internal Energy:
Internal energy in the simulation is due to the Force and displacement. Initially, since the displacement is zero, the energy curve also starts from the origin, then the displace of the elements increases, so the energy curve also increases proportionally. This is similar to both cases.
Kinetic Energy: 1/2mv2
Since the energy is the directly proportional square of the velocity, energy is maximum initially because of the applied velocity of the component and then the curve drops as the velocity of the component also decrease. This is similar to both cases.
Contact Energy
The graph shows that there is no contact between the elements of the rail component and the rigid wall initially and then the curve reaches the maximum as the deformation in the component make contact between the elements due to the crash and then decreases and increases accordingly due to the contact of the elements.
Hourglass energy
In case 1, due to deformation of the elements because of the strain induced by lack of integration, hourglass energy increases
In case 2, As we followed the recommended values of the properties, hourglass energy is constant & nil.
Conclusion:
By running both the simulation, Case 2 with the recommended values (QPEH Q24 element formation), results are more accurate and have very little Energy error (-0.1%), when compared to case 1 (-10.3%) also the hourglass energy is nil.
Hourglass Energy
Deformation of elements in the component, but the not computed strain energy causes Hourglass deformation.
Normally, to avoid such deformation – stiffness can be added to the material.
Damping force can be added, when the component is experiencing high velocity.
Increase the integration of the elements.
Improve the mesh of the component.