Study and comparison of powertrains of the pure electric vehicle and hybrid vehicle.
Aim:
Study and comparison of powertrains of the pure electric vehicle and hybrid vehicle by using powertrain blockset.
Objectives:
01. To study the HEV Reference Application with WOT drive cycle.
02. To study and compare the simulated results of hybrid and pure electric powertrains.
Introduction:
Electric vehicle:
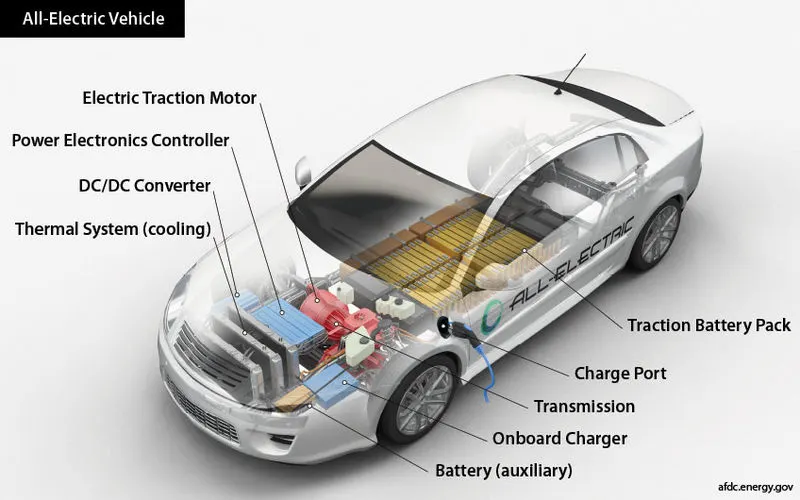
Figure01: Model of an Electric Vehicle.
An electric vehicle (EV) is a vehicle that uses one or more electric motors or traction motors for propulsion. An electric vehicle may be powered through a collector system by electricity from off-vehicle sources, or may be self-contained with a battery, solar panels, fuel cells or an electric generator to convert fuel to electricity. EVs include, but are not limited to, road and rail vehicles, surface and underwater vessels, electric aiecraft and electric spacecraft.
EVs first came into existence in the mid-19th century, when electricity was among the preferred methods for motor vehicle propulsion, providing a level of comfort and ease of operation that could not be achieved by the gasoline cars of the time. Modern internal combustion engines have been the dominant propulsion method for motor vehicles for almost 100 years, but electric power has remained commonplace in other vehicle types, such as trains and smaller vehicles of all types.
Commonly, the term EV is used to refer to an electric car. In the 21st century, EVs have seen a resurgence due to technological developments, and an increased focus on renewable energy and the potential reduction of transportation's impact on climate change and other environmental issues. Project Drawdown describes electric vehicles as one of the 100 best contemporary solutions for addressing climate change.
Hybrid vehicle:
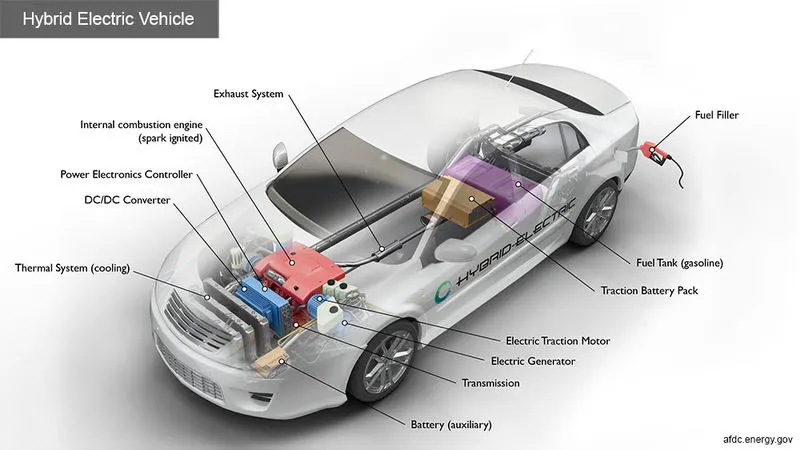
Figure02: Model of a Hybrid Electric Vehicle.
A hybrid vehicle is one that uses two or more distinct types of power, such as submarines that use diesel when surfaced and batteries when submerged. Other means to store energy include pressurized fluid in hydraulic hybrids.
The basic principle with hybrid vehicles is that the different motors work better at different speeds; the electric motor is more efficient at producing torque, or turning power, and the combustion engine is better for maintaining high speed (better than a typical electric motor). Switching from one to the other at the proper time while speeding up yields a win-win in terms of energy efficiency as such that translates into greater fuel efficiency.
Powertrain:
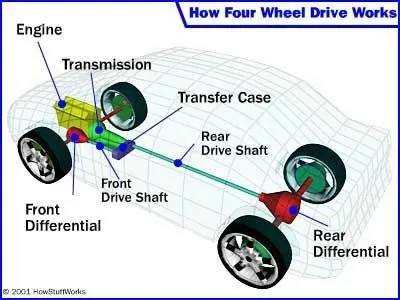
Figure03: Model of a powertrain of typical vehicle.
The powertrain consists of the power source (e.g. the engine) and all of the components that convert the engine's power into movement of the vehicle (e.g. the transmission, driveshafts, differential and axles); whereas the drivetrain does not include the power source and consists of the transmission, driveshafts, differential and axles.
Powertrain Blockset:
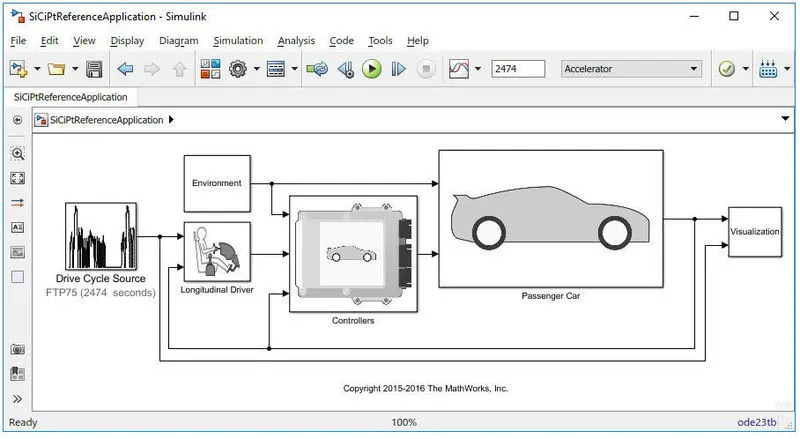
Figure04: GUI of a powertrain blockset in Matlab.
Powertrain Blockset provides fully assembled reference application models of automotive powertrains, including gasoline, diesel, hybrid, and electric systems. It includes a component library for simulating engine subsystems, transmission assemblies, traction motors, battery packs, and controller models. Powertrain Blockset also includes a dynamometer model for virtual testing. MDF file support provides a standards-based interface to calibration tools for data import.
Powertrain Blockset provides a standard model architecture that can be reused throughout the development process. You can use it for design tradeoff analysis and component sizing, control parameter optimization, and hardware-in-the-loop testing. You can customize models by parameterizing components in a reference application with your own data or by replacing a subsystem with your own model.
Hybrid Electric Vehicle:
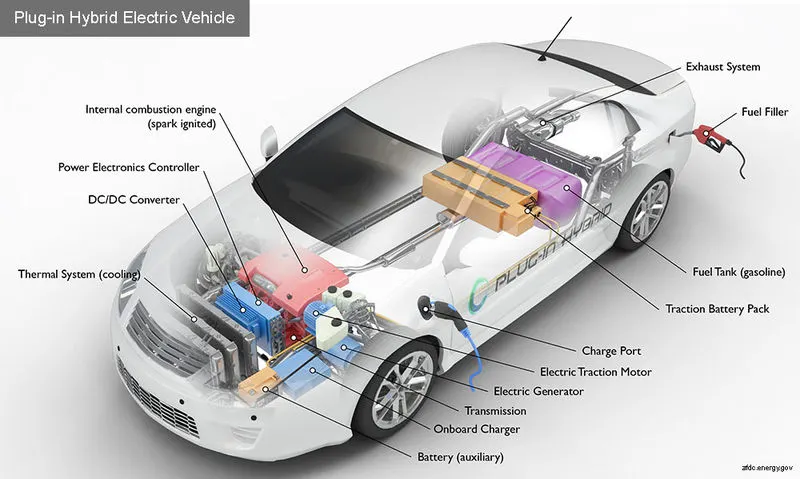
Figure05: Model of a plug-in Hybrid Electric Vehicle.
A hybrid electric vehicle (HEV) is a type of hybrid vehicle that combines a conventional internal combustion engines (ICE) system with an electric propulsion system (hybrid electric drivetrain). The presence of the electric powertrain is intended to achieve either better fuel economy, than a conventional vehicle or better performance. There is a variety of HEV types and the degree to which each function as an electric vehicle (EV) also varies. The most common form of HEV is the hybrid electric car, although hybrid electric trucks (pickups and tractors) and buses also exist.
Modern HEVs make use of efficiency-improving technologies such as regenerative brakes which convert the vehicle's kinetic energy to electric energy, which is stored in a battery or supercapacitor. Some varieties of HEV use an internal combustion engine to turn an electric generator which either recharges the vehicle's batteries or directly powers its electric drive motors; this combination is known as a motor-generator Many HEVs reduce idle emissions by shutting down the engine at idle and restarting it when needed; this is known as a start-stop system. A hybrid-electric produces fewer tailpipe emissions than a comparably sized gasoline car since the hybrid's gasoline engine is usually smaller than that of a gasoline-powered vehicle. If the engine is not used to drive the car directly, it can be geared to run at maximum efficiency, further improving fuel economy.
Problem Statement:
01. What is the difference between mapped and dynamic model of engine, motor and generator? How can you change model type?
02. How does the model calculate miles per gallon? Which factors are considered to model fuel flow?
03. Run the HEV ReferenceApplication with WOT drive cycle. Change the grade and wind velocity in the environment block. Comment on the results.
04. Keeping all other parameters same, compare the simulated results of hybrid and pure electric powertrains.
Solution:
01. What is the difference between mapped and dynamic model of engine, motor and generator? How can you change model type?
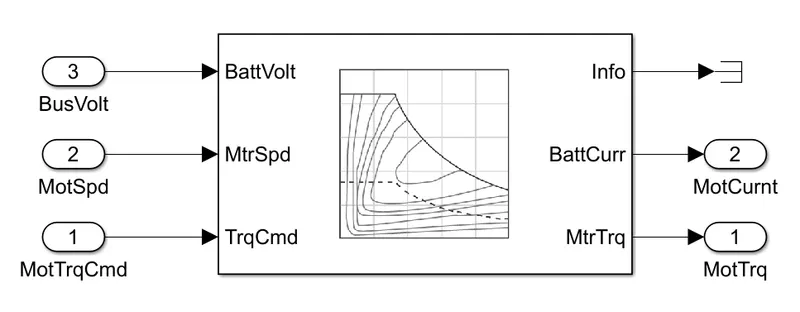
Figure06: Mapped Model.
In mapped models the data is presented in the form of steady-state look-up tables, data that is taken into the consideration for analysis is purely based on therotical calculations.The model takes speed or torque of the engine or the motor and generates the required output torque based on the look-up tables.The time required for the simulation is very less whereas the results of the simulation are not accurate.
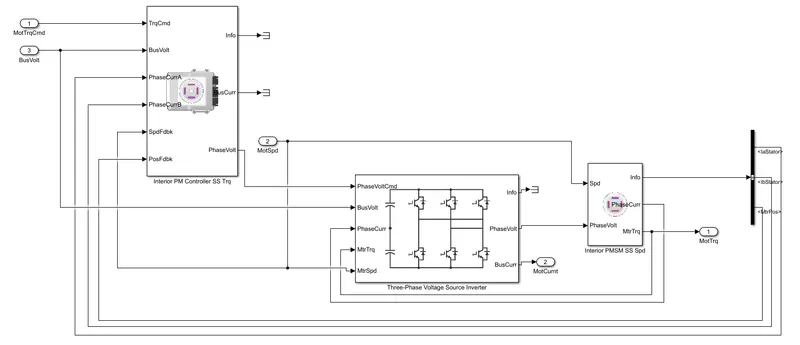
Figure06: Dynamic Model.
In dynamic models the data that is taken into the consideration for analysis is actual data based on the experiments.The model breakdowns the engine behavior into engine characteristics that are separated into lower-level components.The model takes the feedback from the output in order to cope up with the reference values of the parameter under consideration.The time required for the simulation is very long but the results of the simulation are accurate values.
Let's try to understand the concept of motor and generator:
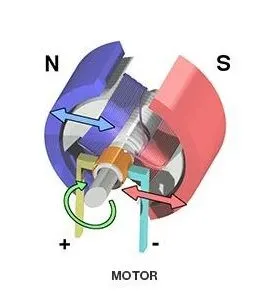
Figure08: Electric motor.
An electric motor is a machine that converts electrical energy to mechanical energy.Electric motor follows Fleming’s left-hand rule.The working principle of a motor is based on the current-carrying conductor that experiences a force when it is kept in the magnetic field.The shaft of an electric motor is driven by a magnetic force which is developed between the armature and field.In a motor, current is supplied to the armature winding.In a motor, current is supplied to the armature winding.
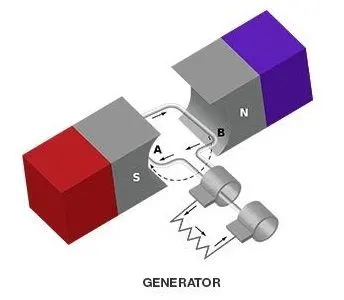
Figure09: Generator.
An electric generator is a machine that converts mechanical energy to electrical energy.Electric generator follows Fleming’s right-hand rule.The working principle of generator is based on electromagnetic induction.The shaft of an electric generator is connected to the rotor which is driven by a mechanical force.In a generator, current is produced in the armature winding.In power stations, generator is used to generate electricity.
Following are the steps to change the type of model from mapped model to dynamic model or vice-versa:
Double click on the passenger car block to open it.Inside the passenger car block there will be an electric plant block.Double click on the electric block to open and view the contents inside.Now we can find motor block.Inside the motor block we can see the model is set as a mapped model.Now to change the model just 'Right-click' anywhere in the blank space.Now go to 'Varient'.Select 'Label model active choice'.Now we can select the type of model required for analysis 'mapped model' or 'dynamic model'.
02.
Miles Per Gallon (MPG):
The term miles per gallon simply represents the total distace travelled by the vehicle per gallon of the fuel.For the calculating MPG following parameters are taken into consideration:
Vehicle speed.Fuel volume flow.Battery power.
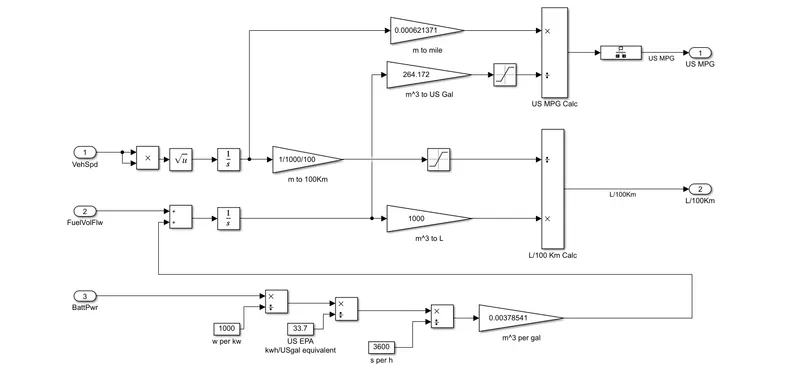
Figure10: Flow diagram for the calculations of the MPG.
Let's try to understand what's happening with the factors under consideration.
A.
Vehicle Speed:
First block multiplies or divides the input parameters.Second block performs operations of the square root functions.Both of these calculates the RMS value of the input so that we can get the positive values of the given input because vehicle speed cannot be negative.In third block the vehicle speed is integrated to determine the future possiblities of the system.The fourth converts the vehicle speed into 100 km from meters and simmultaneously before this the same input signal is converted to miles for the calculation of the MPG.Further this signal goes for the calculation of the MPG where it is divided by US gallon.Fifth block of the saturation limits the values between the lower and upper limits simply to nourish the input signal and same signal is further given for the calculation of litres of volume of fuel for per 100 km of distance.
B.
Fuel Volume Flow:
In first block the fuel volume flow is added with the battery power (m^3/gallon).In second block it is integrated.The third block is used to convert the m^3 into US gallon and further it is used for dividing the vehicle speed (1st input parameter) to get the final value for the MPG.Simultaneously the integrated m^3/gal value of Fuel volume flow is converted into litres to calculate the litres of fuel consumed per 100 km.
C.
Battery Power:
The input value is converted into KW.In second block it is converted into kwh/US gal equivalent just by dividing it by 33.7.Further in third block the battery power is considered in seconds and same value is then converted into m^3/gal in the fourth block.And output of the fourth block is added in the Fuel volume flow in the very first of the parameter.
03. Run the HEV Reference Application with WOT drive cycle. Change the grade and wind velocity in the environment block. Comment on the results.
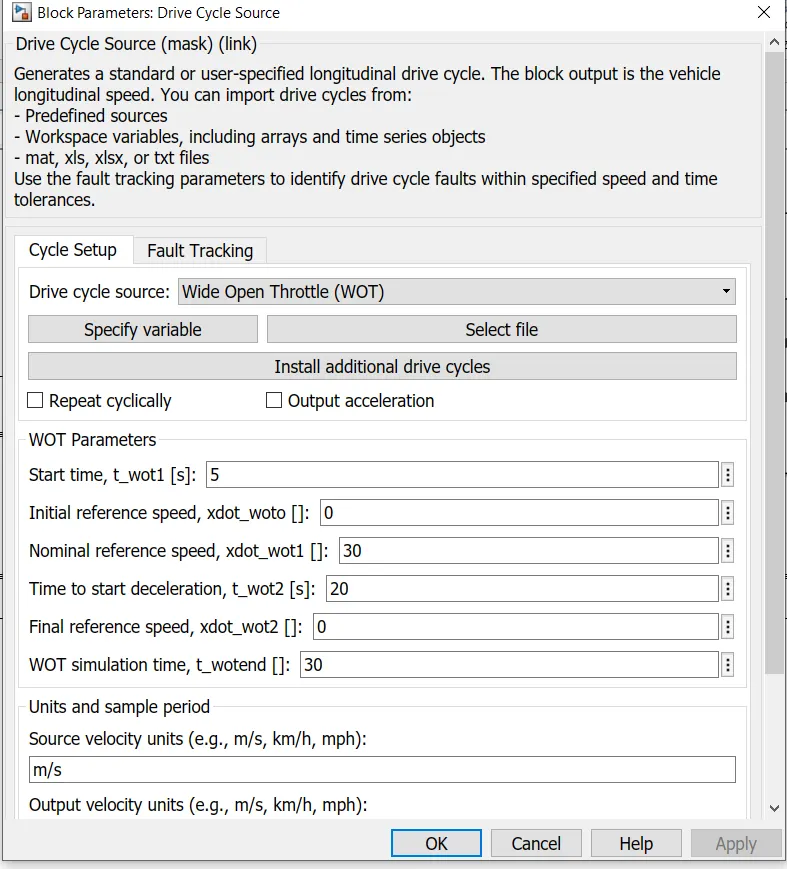
Figure11: Block for Drive Cycle parameters.
As shown in the figure10 is the block for the parameters of a drive cycle. For drive cycle as we know starting time, final time, initial speed and final speed are the basic and important parameters to be taken into the consideration. As study proceeds Time to start acceleration, Initial reference speed, Time to start deceleration and Final reference speed are the parameters which can be easily given for cycle setup. From drive cycle source we can easily select the type of drive cycle from the dropdown menu or we can prepare our own drive cycle in the excel and use it for analysis.
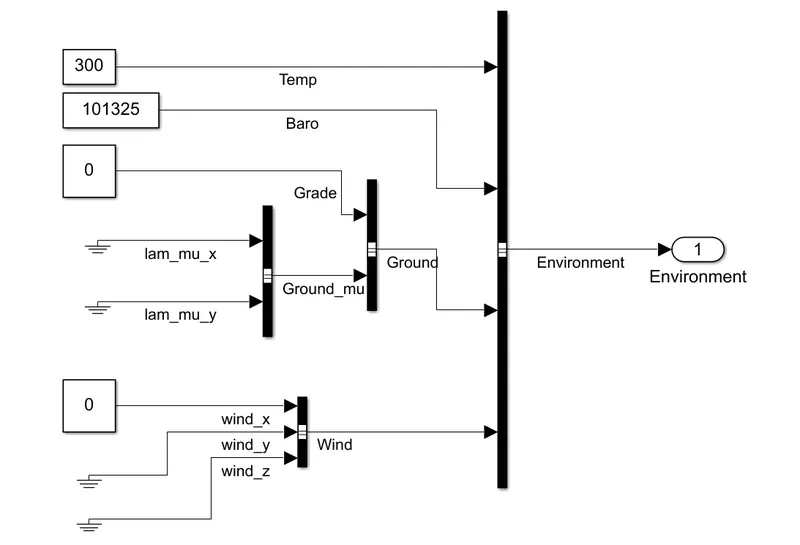
Figure12: Inside setup of an Environmental where values of 'Grade' and 'Wind' are kept as zero for the analysis.
In environment block we can set the values of the environmental factors that can affect the performance of the vehicle.
Temperature of air, Pressure, Grade and Velocity of wind are common factors that are taken into consideration.
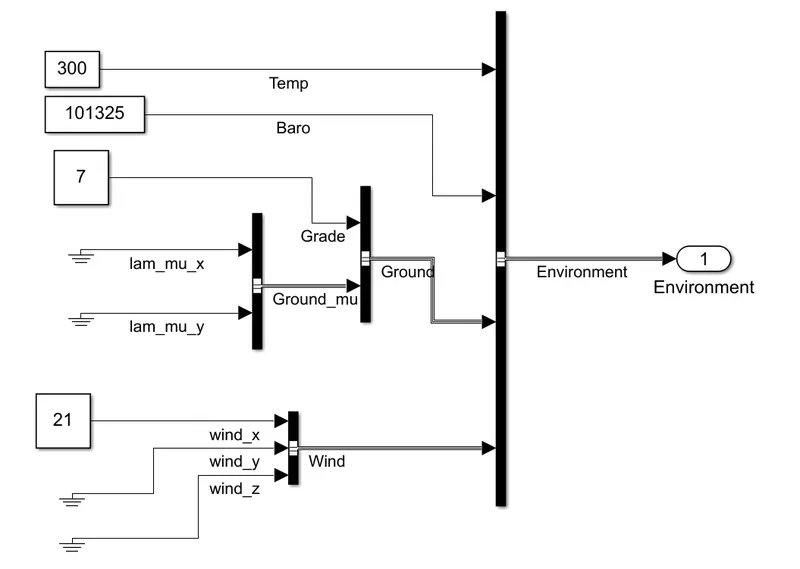
Figure13: Inside setup of an Environmental where values of 'Grade' and 'Wind' are kept as 7 and 21 respectively.
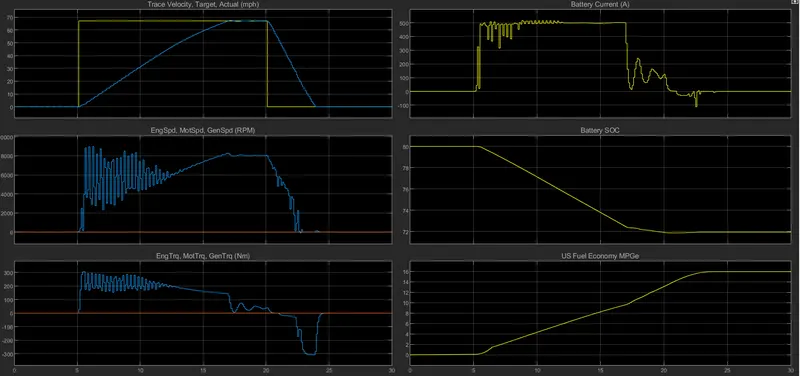
Figure14: Simulation results for the drive cycle where 'Grade' and 'Wind' are kept as zero.
A.
Trace velocity, Target, Actual (mph):
Blue line represents Actual performance of the vehicle and Yellow line represents the ideal performance of the vehicle.It can be seen that battery has the capacity to produce the required magnetude of current required to produce the power required to achive the top speed of the vehicle.The vehicle reaches the top speed at 17th second that is because engine requires time to produce power required for sudden acceleration.The vehicle runs at reference speed for few seconds after achieving it and starts decelerating after braking.Sudden braking takes the vehicle to rest i.e. zero velocity within minimum time possible.In actual practice vehicle cannot go to the speed of 30 mph directly from rest position.
B.
Engine speed, Motor speed, Generator speed:
For initial acceleration (1-2 seconds) speed (power) requirements are less compared to torque requirements therefore spped of an engine is comparively less initially. Later it increases as the power requirements increases to achive the reference speed.While we are continuously accelerating the vehicle, the plot for the engine speed shows many fluctuations during this phase to cope up with the loads of the power and torque simultaneously. Once the vehicle has reached nearly the reference speed the fluctuation reduces and becomes constant while the vehicle is at constant reference speed.Further during the decelerating the speed of an engine reduces accordingly as the power requirements falls.
C.
Engine Torque, Motor Torque, Generator Torque:
The torque requirements are lower in magnetude but are continuously fluctuating during the acceleration .Once the vehicle reaches it's reference speed and starts running at it the magnetude of the torque starts falling due to lower requirements of the torque.during deceleration the motor acts as a generator where the mechanical energy is converrted into the electrical enegy to recharge the battery.
D.
Battery Current:
During the initial phase of the acceleration the current requirements are low but as the cycle progresses the current requirements increases.During this acceleration phase the the fluctuations occurs in the magnetude of the battery current.During the constant reference speed of the vehicle the value of the battery current remains constant.Whereas during the decelerating the value of the battery currrent falls due to lower requirements of the power.During the instant braking of the vehicle the negative values of the battery current represents the recharging condition of the battery system.
E.
Battery State of Charge (SOC):
During the acceleration of the vehicle where the power requirements are higher the SOC of the battery rapidly decreases.As the vehicle starts decelerating the SOC starts improving due to recharging of the battery for a very small period of time.
F.
Fuel Economy MPGe:
Once the vehicle starts running during it's initial speed the behavior of the fuel economy seems positive beacuse of the lower speeds as the vehicle is operating within economy mode.But in progression as the power requirements increases the fuel economy of the vehicle decreases.As just before when the vehicle was trying the achieve it's reference speed the vale of the fuel economy got affected lower higher requirements of the power.But it did'nt continue falling because later vehicle was maintained at the constant reference speed.
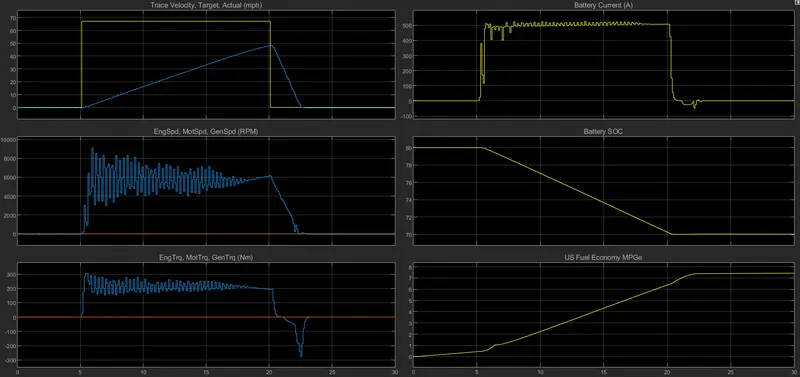
Figure15: Simulation results of drive cycle where values of 'Grade' and 'Wind' are kept as 7 and 21 respectively.
A.
Trace velocity, Target, Actual (mph):
Vehicle is not reached at it's top reference speed that's because the gradeability and the wind velocity are going to produce the resisting forces and to overcome this forces vehicle will require more power which indirectly affects performance of the vehicle thus failing to achieve the reference speed within given period of time.During the deceleration vehicle slows down quickly and comes to rest.
B.
Engine speed, Motor speed, Generator speed:
During the initial phase of the acceleration lower speed of the engine states the lower requirements of the power but as the acceleration progresses the engine speed requirements also increases.Here the vehicle fails to achieve the top reference speed thus throughout the period of a cycle the acceleration is required which leads to the continuous fluctuations in the speed of an engine durong acceleration.During the decelerating the fluctuation gets decreases and the speed of the engine also decreases.
C.
Engine Torque, Motor Torque, Generator Torque:
During the acceleration of the due the grade and wind velocity the vehicle fails to achieve the reference speed due to which continuous acceleration is requied which results in the fluctuations in the engine torque.As the vehicle nearly achieves the reference speed the fluctuatins in the motor torque reduces.During the decelerating the battery of the vehicle gets charged which shows the negative values of the engine torque but for very short period of time.
D.
Battery Current:
Initially current requirements are less but as the speed of the vehicle increases the requirements of the battery current increases.During acceleration battery current fluctuates a lot but once the reference constant speed is achieved the fluctuation s in the battery current becomes zero.During deceleration the battery current falls.Wheewas during braking the battery current shows a positive change as the battery gets charged.
E.
Battery State of Charge (SOC):
SOC of the battery falls rapidly during the acceleration.
F.
Fuel Economy MPGe:
The vehicle operates within the economy mode at lower speeds thus results in improving the fuel economy of the vehicle.
04. Keeping all other parameters same, compare the simulated results of hybrid and pure electric powertrains.
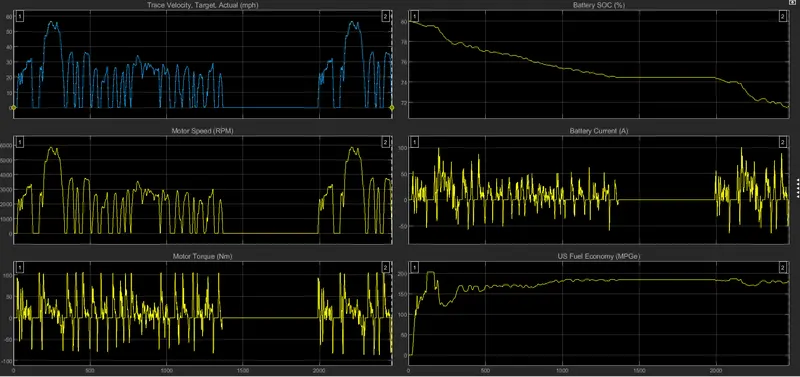
Figure16: Simulation results of Pure Electric Powertrain for Drive cycle FTP75.
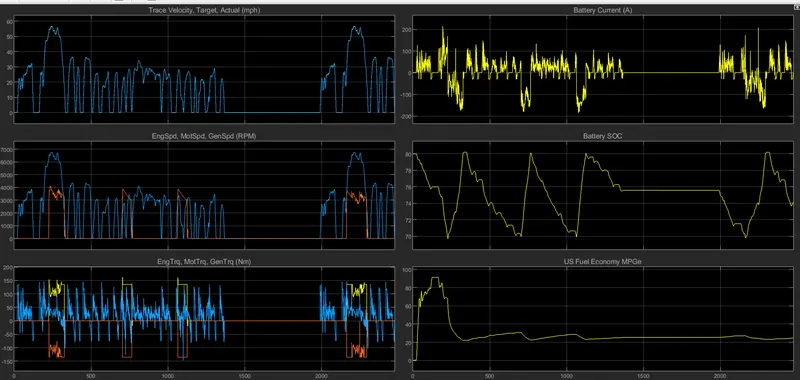
Figure17: Simulation results of Hybrid Electric Powertrain for Drive cycle FTP75.
A.
Trace velocity, Target, Actual (mph):
The results for both HEV and Pure EV are same. It's simply the plot of the drive cycle FTP75 where both actual performance of the vehicle matches with the ideal performance for the the models of the vehicle.In both of the cases 57 mph is the top speed achieved by the vehicle during the span of a drive cycle for both actual and ideal performance of the vehicle.
B.
Engine speed, Motor speed, Generator speed (RPM):
For pure electric vehicle plot is shown but only for the speed of the motor because in pure electric vehicle no combustion engines are used whereas electric motor is used as power converter.The speed of the motor varies in praportion with the power requirements of the vehicle. As the speed of the vehicle increases power requirement increases and as the speed of the vehicle decreases power requirements also decreases.57000 are the approximate RPM of the motor of an EV when it is at it's top speed.Plot for the simulation results of PEV shows the graph where motor and operates as per the requirement of the power to deliver the accepted performance. So as the speed of a vehicle increases power requirement increases which results in the same pattern of the plot as the output for given motor as that of the drive cycle.In PEV we have only one component and that is motor.Whereas in HEV we have three components Engine, Motor and Generator.In HEVs the engine (Blue line) is the main source of the power and whenever during the operation vehicle has to power up motor comes into the action to fulfill the power and torque requirements of the vehicle. As we can see in the plot we can observe wherever the vehicle needs the power to achieve top speed or to achieve maximum speed possible within shortest period of time electric motor (Orange line) cope up with the engine to enhance the performance by providing the necessary power as the output.And therefore the speed of an engine and the motor varies according to the speed of the vehicle.
C.
Engine torque, Motor torque, Generator torque:
In case of HEV the torque of the engine (Blue line) shows the positive increasing values during acceleration of the vehicle whereas the engine torque decreases during the deceleration of the vehicle. And the engine torque remains the zero while the vehicle’s speed is zero.The motor torque (yellow line) shows the positive values as the motor comes into the action wherever the vehicle needs extra power for the instantaneous acceleration.The generator torque (Orange line) shows the negative values whenever the motor will came into the action because the generator will not be able to generate the charge that is required to charge the battery as it becomes passive.Whereas in case of pure electric vehicle the results shows the torque values for motor itself and those values increases and decreases indirect proportion with the speed of the vehicle.
D.
Battery current (A):
In both HEV and PEV the battery current increases (shows positive values) as the speed or power requirements of the vehicle increases (during acceleration) and decreases (shows negative values) as the speed or power requirements of the vehicle decreases (during deceleration).
E.
Battery (SOC):
The battery keeps on losing its state of the charge as the cycle proceeds. Where there are less power requirements there the plot becomes stable but it cannot be improved as in case of HEV.In HEV the SOC of the battery is maintained between the upper and lower limits of the SOC of the battery to keep the battery always prepared for the instantaneous performance requirements.In such cases whenever the battery falls below the critical level the generator comes into action to restore the charge into the battery.
F.
Fuel Economy (MPGe):
Fuel economy of an EV is inversely proportional to the speed of the vehicle as the speed increases the fuel economy decreases and as the speed decreases the fuel economy of the vehicle starts being stable and becomes stable at zero speed.Whereas in HEV whenever the generator will come into action the fuel economy of the vehicle seems improving and plot shows the positive change.
Conclusion:
The Hybrid vehicle allows the battery to compensate the required power by the vehicle and generators helps to charge the battery at faster rate which allows the vehicle to travel over the long distancesIn electric vehicle the power requirements are satisfied by using battery only therefore the overall range of the vehicle gets compensated.The wind velocity and the grade degrades the performance of the vehicle as the power requirements are increased which results in the more consumptiion of the battery power.