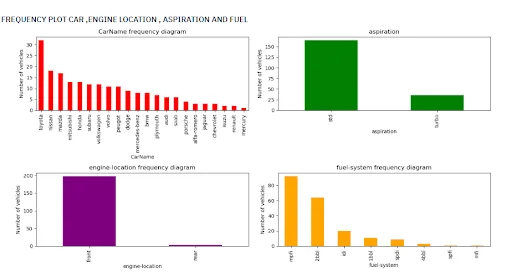
Descriptive Analysis and Regression Analysis
In this project, you will perform descriptive analysis on given data regarding cars. Using the data, you will have to classify cars based on various parameters and analyze the pric…
Become an AI engineer and enable machines to mimic human intelligence with the Python for machine learning course. Skill-Lync's Artificial Intelligence and Machine Learning course will teach different methods like K-means clustering to clean data and analyse them by performing descriptive and regression analysis.
Machine Learning Fundamentals In Depth is an online course from Skill-Lync: 12 weeks, 15 hours of content and 2 industry projects.
More and more industries are relying on machine learning to develop systems that function on their own through repetitive learning. As machine learning is widespread across a variety of domains and industries, it has become a standard prerequisite for engineers striving to work in the industry. This course will offer aspiring engineers a solid understanding of the fundamental machine learning algorithms.
You will learn about...
In addition to the theory taught in this course, you will get hands-on exposure to the use of Python for machine learning applications. This course culminates with industry level projects focused on real-time application of machine learning concepts.
Who can enrol in this course?
Engineering graduates and working professionals with a background in similar fields can take this course.
To see random forests and model evaluation applied to mechanical data, work through our two free projects with code: jet-engine remaining life from NASA C-MAPSS data and bearing fault detection on CWRU vibration data. Both are part of our guide to AI and ML for mechanical engineers.
This week, you will learn about
This week, you will learn about
This week, you will learn about
This week, you will learn about
This week, you will learn about
This week, you will learn about
This week, you will learn about
This week, you will learn about
This week, you will learn about
This week, you will learn about
This week, you will learn about
This week, you will learn about
Our projects are designed by experts in the industry to reflect industry standards. By working through our projects, Learners will gain a practical understanding of what they will take on at a larger-scale in the industry. In total, there are 2 Projects that are available in this program.
In this project, you will perform descriptive analysis on given data regarding cars. Using the data, you will have to classify cars based on various parameters and analyze the pric…
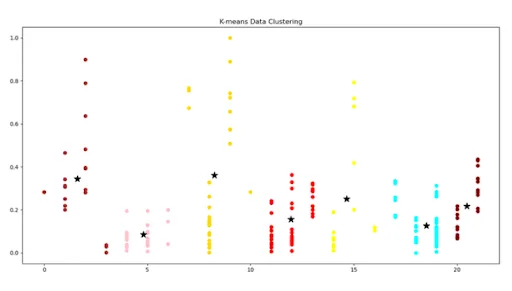
In this project, you will have to clean a data set regarding cars and implement the clustering algorithm using K-Means. You will then have to explain the results and find the optim…
Video stories from learners of related computer science programs, from Skill-Lync's YouTube channel.
by the Skill-Lync team
Plants, test rigs and simulation tools now produce more numbers than anyone can read, and machine learning finds patterns in them. Machine learning (ML) means a program that learns a rule from example rows of data, instead of being handed the rule. For a mechanical engineer it shows up in three jobs: warning of failures, standing in for slow simulations, and inspecting parts.
None of this replaces engineering judgement. A model only knows the rows it was shown, which the next two answers show with numbers. The hub AI and ML for mechanical engineers lists more free projects with code.
Linear regression finds the straight line that sits closest to your points, by making the total of the squared vertical gaps as small as possible. In a tensile test the slope of stress against strain is Young's modulus, so a regression can learn it from the readings. Week 3 of the course covers linear regression, one-hot encoding, the cost function and gradient descent.
Here are six readings from an elastic tensile test of a steel bar. The numbers are assumed values, invented for this lesson, not a measured test. Strain is in microstrain (1 microstrain is a stretch of one part in a million), stress in MPa.
The model is . Least squares picks and to minimise the sum of over the six readings. The cost function is that sum. Gradient descent reaches the same answer by walking downhill on the cost, a little at a time, like finding the bottom of a valley in fog by feeling the slope under your feet. NumPy's lstsq jumps straight to the bottom.
import numpy as np
strain = np.array([200, 400, 600, 800, 1000, 1200.0])   # microstrain
stress = np.array([41, 81, 125, 163, 206, 243.0])       # MPa
A = np.column_stack([strain, np.ones_like(strain)])
(m, c), *_ = np.linalg.lstsq(A, stress, rcond=None)
fit = m * strain + c
r2 = 1 - ((stress - fit) ** 2).sum() / ((stress - stress.mean()) ** 2).sum()
print(f"stress = {m:.4f} x strain + {c:.2f}, R2 = {r2:.4f}")
print(f"E = {m * 1000:.0f} GPa; at 1500: {m * 1500 + c:.0f} MPa; at 3000: {m * 3000 + c:.0f} MPa")
It prints:
stress = 0.2033 x strain + 0.87, R2 = 0.9995
E = 203 GPa; at 1500: 306 MPa; at 3000: 611 MPa
A slope of 0.2033 MPa per microstrain is 203 GPa. Design codes use 200 to 210 GPa for structural steel, according to a Bentley RAM Structural System help page that lists values by code, so the fit is sensible. R² of 0.9995 says the line explains 99.95% of the variation in the stress readings. It does not say the line is right outside the data.
That is the catch. Ask the line for 3,000 microstrain and it answers 611 MPa. Real steel yields long before that, and the line knows nothing about yielding. A model is only trustworthy inside the range of its training data, the same reason SimAI reports a confidence level.
You fit a model on some rows (the training set) and score it on rows it has never seen (the test set). Overfitting is when a model memorises the training rows, noise included, and does worse on new rows. It is like a student who learns last year's answer key and fails a new paper. The course has lessons titled "Understanding Training and Test Data in Linear Regression" and "Understanding Overfitting and Underfitting in Machine Learning".
Take the same six assumed tensile readings. Fit on the first four and keep the last two hidden. Compare a straight line (degree 1) with a cubic curve (degree 3). A cubic has four free numbers, so it can pass through four points exactly.
import numpy as np
strain = np.array([200, 400, 600, 800, 1000, 1200.0])
stress = np.array([41, 81, 125, 163, 206, 243.0])
for deg in (1, 3):
    p = np.polyfit(strain[:4], stress[:4], deg)      # fit on the first 4 rows
    train = np.abs(np.polyval(p, strain[:4]) - stress[:4]).max()
    test = np.abs(np.polyval(p, strain[4:]) - stress[4:]).max()
    print(f"degree {deg}: worst train error {train:.1f} MPa, worst test error {test:.1f} MPa")
It prints:
degree 1: worst train error 2.0 MPa, worst test error 3.0 MPa
degree 3: worst train error 0.0 MPa, worst test error 62.0 MPa
The cubic scores a perfect 0.0 MPa on the data it saw, so on the training set alone it looks like the winner. On the hidden rows it is off by 62.0 MPa, and it predicts stress falling from 185 to 181 MPa as the bar stretches further. The line is wrong by at most 3.0 MPa. The simple model wins because the data really is a line plus a little noise.
The rule: never judge a model on the rows it trained on. Hold some rows back, and prefer the simplest model that does the job.
Clustering groups rows that look alike when nobody has labelled them. K-means asks you for the number of groups, , then repeats two steps: give each point to its nearest centroid (the centre of a group), then move each centroid to the average of its points. Week 9 covers k-means and the elbow curve. Project 2 clusters a cars data set with it.
Eight assumed points, say a vibration reading on one axis and a temperature rise on the other, for eight machines. We choose and start from a deliberately poor guess, with both centroids in the lower left: A (1, 2) and B (2, 1).
pts = {"A": (1, 2), "B": (2, 1), "C": (2, 3), "D": (6, 8),
       "E": (7, 9), "F": (8, 8), "G": (5, 5), "H": (9, 10)}
cent = [pts["A"], pts["B"]]                  # a deliberately poor start
for it in (1, 2, 3):
    groups = [[], []]
    for name, (x, y) in pts.items():
        d = [(x - cx) ** 2 + (y - cy) ** 2 for cx, cy in cent]
        groups[d.index(min(d))].append(name)
    cent = [(sum(pts[n][0] for n in g) / len(g), sum(pts[n][1] for n in g) / len(g)) for g in groups]
    print(it, ["".join(g) for g in groups], [(round(x, 2), round(y, 2)) for x, y in cent])
sse = sum((pts[n][0] - cx) ** 2 + (pts[n][1] - cy) ** 2 for g, (cx, cy) in zip(groups, cent) for n in g)
print("sum of squared distances:", round(sse, 1))
It prints:
1 ['ACDEFGH', 'B'] [(5.43, 6.43), (2.0, 1.0)]
2 ['DEFGH', 'ABC'] [(7.0, 8.0), (1.67, 2.0)]
3 ['DEFGH', 'ABC'] [(7.0, 8.0), (1.67, 2.0)]
sum of squared distances: 26.7
Walk through iteration 1. Every point except B is nearer to A than to B, so B sits alone and the other seven form one group. The centroid of that group is the average of their x values, , and of their y values, .
That centroid has now moved into the middle of the upper group. In iteration 2, A and C are closer to B's group, so they switch. The new centroids are for D, E, F, G, H and for A, B, C. Iteration 3 changes nothing, so the algorithm has converged. The sum of squared distances is 26.7.
The catch: k-means can settle in a poor answer from an unlucky start, so people run it several times and keep the lowest sum. It also needs you to choose . The elbow curve plots the sum of squared distances against and you pick the bend where adding a group stops helping much.
A classifier puts each row into a category, such as good part or defective part. Count its four kinds of outcome in a confusion matrix, then compute precision (of the parts it flagged, how many were truly defective) and recall (of the truly defective parts, how many it caught). Weeks 4 to 8 cover classifiers. Week 6 covers evaluating them.
Assumed example: 1,000 parts, of which 40 are defective (4%). The model flags 50 parts and 30 of those are truly defective. So true positives = 30, false positives = 20, false negatives = 10 and true negatives = 940.
tp, fp, fn, tn = 30, 20, 10, 940
precision = tp / (tp + fp)
recall = tp / (tp + fn)
f1 = 2 * precision * recall / (precision + recall)
accuracy = (tp + tn) / (tp + fp + fn + tn)
print(f"accuracy {accuracy:.3f}, precision {precision:.2f}, recall {recall:.2f}, F1 {f1:.3f}")
print(f"always say good: accuracy {960 / 1000:.3f}, recall 0")
It prints:
accuracy 0.970, precision 0.60, recall 0.75, F1 0.667
always say good: accuracy 0.960, recall 0
Accuracy of 97.0% sounds excellent, but a lazy model that calls every part good scores 96.0% and catches no defect at all. When defects are rare, accuracy hides the problem. Precision 0.60 means 4 in 10 flags are false alarms. Recall 0.75 means one defect in four slips through. is one number that balances both.
A single decision tree is a chain of yes/no questions, such as "is vibration above 6 mm/s?". A random forest grows many trees, each on a random resample of the rows (bootstrapping), and takes a majority vote. The scikit-learn documentation says it fits trees on various sub-samples and uses averaging to improve accuracy and control over-fitting. Say five independent trees are each right 70% of the time. The majority is right when at least 3 of 5 are, which is 83.7%. Real trees are correlated, so the gain is smaller, but the direction holds.
It is a 12-week Python course in 12 modules: probability and statistics, then regression, classification, clustering and neural networks. The LMS lists 35 lessons and about 15 hours of video, plus two feedback forms. All lessons are locked until you enrol, so we only quote their titles.
Two projects, both on car data: a descriptive and regression analysis (cleaning the data, a correlation matrix, then regression) and k-means clustering with an elbow curve. Some lesson titles mention mechanical engineers directly, such as "Introduction to Machine Learning and AI using Python for Mechanical Engineering".
New to Python? Python for Mechanical Engineers is a 4-hour course. This course is part of the Post Graduate Program in Data Analytics and Data Science and the Post Graduate Program in Data Science and Machine Learning.
Mostly through longer programs, and mostly as data analyst roles, not ML engineer roles. As of 22 Nov 2026, none of Skill-Lync's 3,905 placement records names this course in its program field. The two programs it belongs to do show up, and two cuts of the data tell the story.
Read this with care. It is a self-reported learner sample, mostly 2021 to 2023 starting offers, not a forecast. Data titles in it come almost entirely from the 24-week programs, not from a 15-hour course. For a mechanical engineer this course is better read as a way to add ML to design, CAE or maintenance work than as a route to a new job title on its own.
| Course | Length | Projects | Tools | Fee |
|---|---|---|---|---|
| Machine Learning Fundamentals In Depth (this page)15 h: regression to PCA and neural nets in Python | 12 weeks, 15 h | 2 | Python | ₹40,000 |
| Python for Mechanical EngineersNew to Python? A 4 h start for mechanical work | 4 weeks, 4 h | 2 | Python | ₹40,000 |
| Statistics and Probability for Data Sciences22 h on probability and statistics for data | 12 weeks, 22 h | 2 | Jupyter Notebook | ₹40,000 |
| Introduction to Machine Learning Algorithms and their Implementation in PythonLonger ML course in Python, 40 h | 12 weeks, 40 h | 2 | Python | ₹40,000 |
| Advanced Deep Learning using PythonNext step: deep learning in Python, 22 h | 12 weeks, 22 h | 2 | Python | ₹40,000 |
| PG Program in Data Science and Machine LearningFull program: 151 h over 24 weeks | 24 weeks, 151 h | 12 | Python, MySQL, Anaconda, SQLite, Jupyter Notebook | ₹2,75,000 |
Lengths, projects and fees are taken from each course page on 22 Nov 2026; fees are the Premium plan in INR, including all charges.
Become job ready with our comprehensive industry focused curriculum for freshers & early career professionals
Engineering students and graduates, including mechanical engineers, can take this course. It starts from probability and statistics and uses Python, so you do not need prior machine learning experience.
Yes, this is a 100% online course.
Artificial Intelligence is involved in making systems that can work like humans. Machine Learning is a subset of AI where the machine is allowed to learn on its own from provided data sets.
The fee for your country is shown in the pricing section on this page, and the plan lists what it includes.
As of 22 Nov 2026, Skill-Lync placement records hold 75 data, ML or AI job titles, 69 of them from the 24-week data programs this course belongs to. Median disclosed pay is 4.0 LPA (n = 63). It is a self-reported learner sample, not a promise of a job or a salary. The guide on this page has the full breakdown.
Yes, after completing this best AI ML course, you shall be given a course completion certificate. The top 5% of the scorers shall be given a merit certificate alongside the course completion certificate.
Yes, you can clear your queries with email and forum support.
A counsellor will walk you through the syllabus, projects and fee options — and tell you honestly if another course suits you better.