
Core and Advanced Python Programming
English Dictionary App
You will have to create an English Dictionary App that responds with definitions of English words according to the given input.

With this program, you can gain the industry-level expertise needed to become a data scientist.
As data and statistics run operations across all industries, data scientists with a practical understanding of programming, statistics, and databases are in demand. This program is designed to give engineers the skills they need to secure job roles in the industry.
By enrolling in this program, you will
After completing this program, you will have the skills needed to apply for the following job roles:
You can also pursue higher education in the following domains:
In this week, students will learn about
In this week, students will learn about
In this week, you will learn about
In this week, students will learn about
In this week, students will learn about
In this week, students will learn about
In this week, students will learn about
In this week, students will learn about
In this week, students will learn about
In this week, students will learn about
In this week, you will get a hands-on understanding of the following
In this week, you will get a hands-on understanding of the following
Tableau software allows businesses to clearly visualize, analyze, and report large data sets. In the industry, Tableau is a business intelligence tool used to make decisions supported by data. In order to develop effective dashboards and data visuals that can be studied and interpreted, learners must understand the UI and basic features.
This week will cover
The Tableau workspace has features such as shelves, cards, the Data Pane, Analytics Pane, toolbars, and menus. Each of these features has a specific function that learners must understand how to use when working with Tableau.
This week will cover
As not all types of data are the same, Tableau supports 7 different data types, which can be sorted and grouped according to requirements. In order to present and organize data visually, learners should understand the features of Tableau related to data types and sorting.
This week will cover
There are six different filters available for users on Tableau, each with their own unique function. By using filters, datasets can be condensed to illustrate concise information, thus improving the efficiency of dashboards. Data in a table can also be analyzed through performing table calculations. These features are essential for learners, as they can be used to develop efficient and concise dashboards.
This week will cover
Spreadsheets with data can be transformed into visually interactive dashboards that present the information. Dashboards can be combined with spreadsheets to tell a story and narrate performance through measured parameters. By learning the best practices, learners can design and develop effective dashboards and stories for businesses.
This week will cover
Tableau workbooks can be shared, exported, and published as required. As many individuals may work on a dashboard together, it is important for learners to understand how distribution and publishing work.
This week will cover
Tableau is also used to perform data blending and data joining. Through joining, data in tables and sheets from the same source can be combined. Data blending lets users combine data from different sources. It is important for learners to understand joins and blending as both are often required in the industry.
This week will cover
When analyzing data on Tableau, Relationships let you combine data from different tables. It is important for learners to understand how to work with multiple sets of data for effective analysis and visualization.
This week will cover
Before data is used in business intelligence, it goes through data preparation. This involves collecting, combining, and systematically organizing the dataset before it gets processed. It is important for learners to understand the parameters considered when preparing data.
This week will cover
When working with large sets of data, Tableau lets users perform advanced calculations and analytics to draw accurate inferences. It is important for learners to understand how to perform advanced calculations using Tableau to meet industry standards.
This week will cover
Nested LOD is an advanced topic in Tableau that lets users assess data sets in-depth. Users can also build maps using Tableau, and understand the related data. As certain data sets may require mapping functions, and analysis in-depth, it is important to know about these concepts.
This week will cover
Through dynamic designs, values in dashboards can automatically change when related data is modified. As it is common for data sets to have changing values, knowing how to work with dynamic designs is an essential skill for learners.
This week will cover
Our projects are designed by experts in the industry to reflect industry standards. By working through our projects, Learners will gain a practical understanding of what they will take on at a larger-scale in the industry. In total, there are 8 Projects that are available in this program.
You will have to create an English Dictionary App that responds with definitions of English words according to the given input.
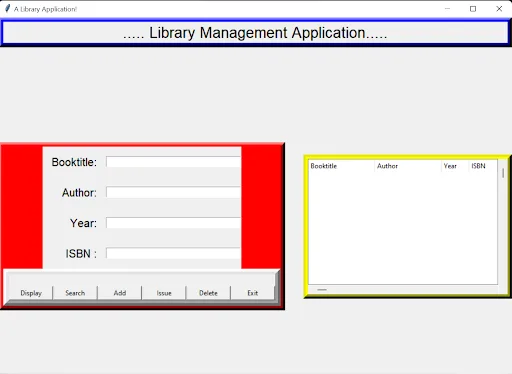
You have to develop a Library Book Management System based on given inputs. The Management System will be implemented with the front-end GUI developed using Tkinter and the backend…
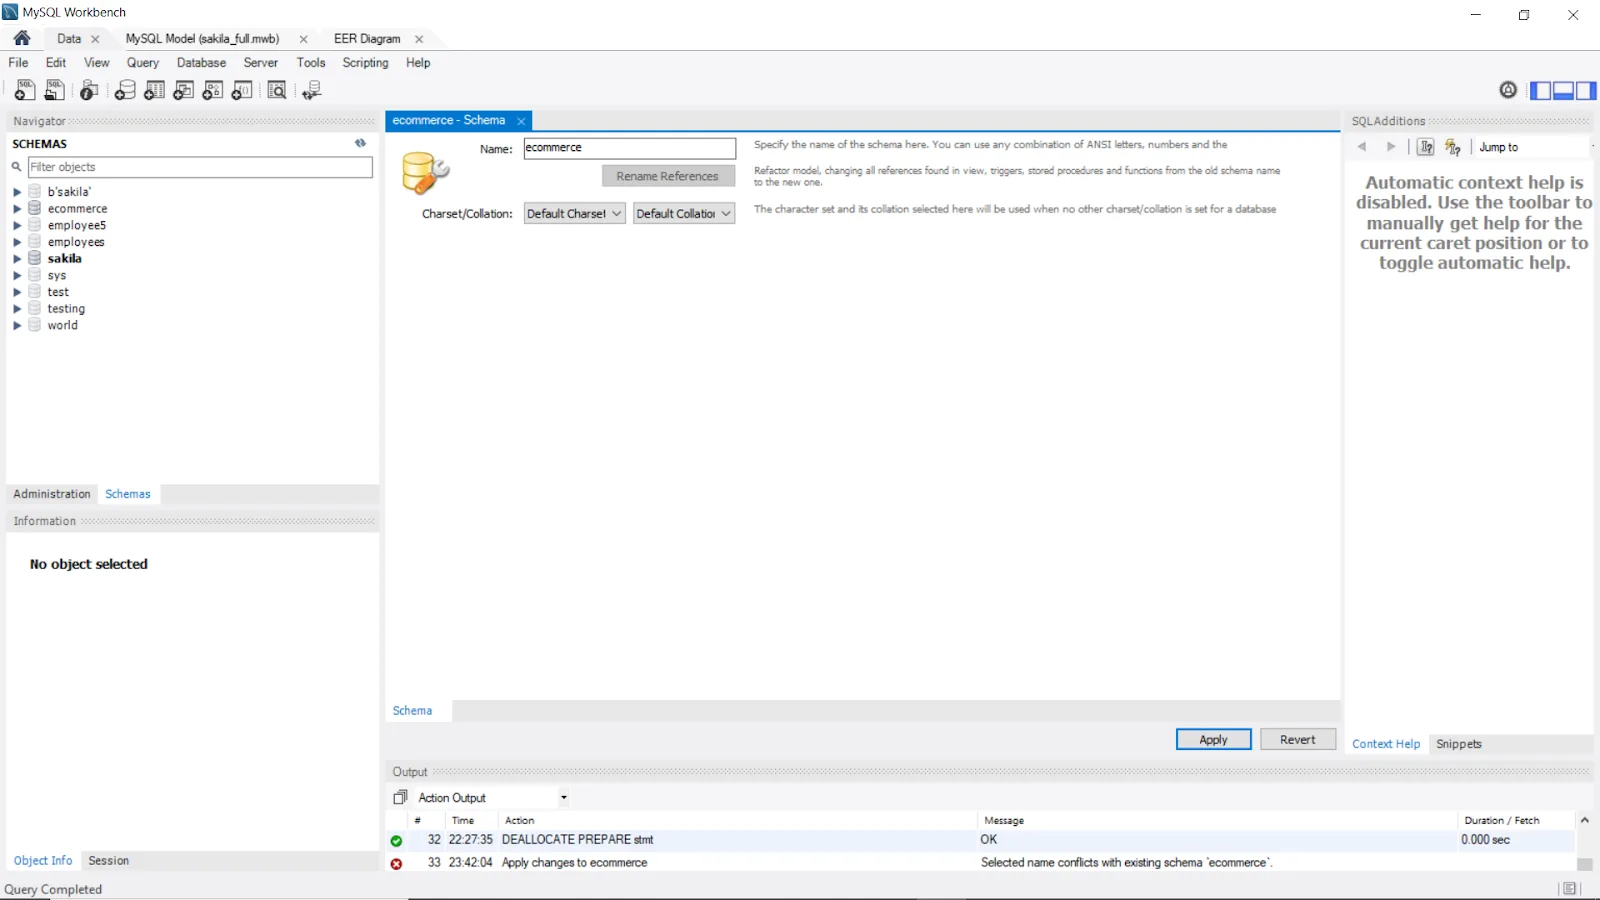
In this project, students are expected to analyze user behavior in a C2C E-Commerce business. Analyzing the user’s database will help understand the business perspective. The…
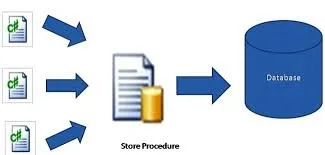
In this project, students are expected to analyze the career choices of alumni from an institution based on given data.

For this project, learners are to do the following: The objective is to find the insurance premium and give the patients' details. The data, which contains various parameters such …
For this project, learners are to do the following: Analyze the quality of two types of fermented drinks. The student will perform descriptive and inferential statistics on the dat…
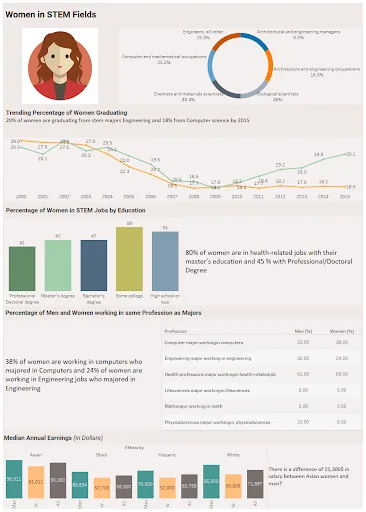
Learners are required to develop a dashboard on Tableau with a given data set. The data set will have data about the women who graduated (year of graduation, number of employed wom…
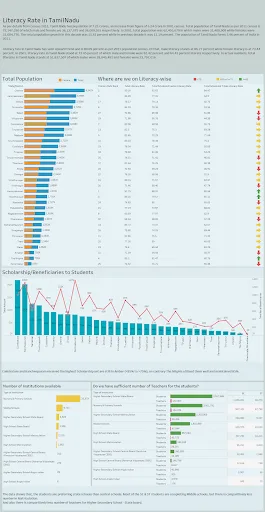
Learners are required to develop a dashboard titled “Literacy Rate in Tamil Nadu” showing the female literacy population when compared to the total. It should depict th…
Become job ready with our comprehensive industry focused curriculum for freshers & early career professionals
A counsellor will walk you through the syllabus, projects and fee options — and tell you honestly if another course suits you better.