Week 9 - Senstivity Analysis Assignment
OBJECTIVE:
- To determine the 10 most sensitive reactions of GRI -3.0 mechanism.
- To determine the sensitivity with respect to temperature.
- Output the reactions in decreasing order of sensitivity
THEORY:
In a reaction mechanism, multiple intermediate reactions take place to get the final output. These intermediate reactions affect the rate of the entire mechanism. These reactions depend on operating conditions and can be controlled to reach the desired state. In order to control these reactions, the operating conditions and other parameters can be adjusted. These parameters have the direct impact on the rate of reaction. Further this impact can be studied by the sensitivity analysis where we get the relationship between input and output parameters of the system. Higher the sensitivity, greater is the impact of change in the parameter to the output. Let’s assume x to be the input parameter and y to be the output and if the x is incremented by x+dx then change output is deviated by dy . Thus the sensitivity can be written as :
Sensitivity = `dy/dx`
Hence, with the help of sensitivity we can change the input to get desired output.
CODE:
- We will initialise the gas instance from the gri 30 mechanism file and set the temperature at 1500K, 1atm and the specie concentration as per the stoichiometric coefficients.
- Create an ideal gas constant pressure reactor for the gas instance and will further create a reactor network. Moreover we will set the tolerances for the solvers.
- Initialise a solution array to store the thermodynamic state of gas at each time step. Thus we will initialise the time step.
- As the solution marches through each time step thermodynamic states of the solution are appended in the solution variable. Sensitivity of each reaction is thus calculated and the 10 maximum results are stored.
- The top 10senstivity data is sorted and top 10 values are displayed.
The code can be seen below:
'''
program for sensitivity
'''

import matplotlib.pyplot as plt
import cantera as ct
import numpy as np


gas = ct.Solution('gri30.cti')
#initial variables
T = 1500
P = ct.one_atm
gas.TPX = T,P,{'CH4':1,'O2':2,'N2':7.52}

r = ct.IdealGasConstPressureReactor(gas)

sim = ct.ReactorNet([r])
# extracting reactor equations and its numbers

reactions = gas.reaction_equations()
n = gas.n_reactions

N = 10  #number of reactions to be used for sensitive calculation

for i in range(n):
	r.add_sensitivity_reaction(i)


#tolerances
sim_rtol = 1e-6
sim_atol = 1e-15
sim_rtol_sensitivity = 1e-6
sim_atol_sensitivity = 1e-6

sT_max = [0]*n

states = ct.SolutionArray(gas,extra='time')
reac_num = np.arange(1,n+1)

for t in np.arange(0,2e-3,5e-6):
	sim.advance(t)
	states.append(r.thermo.state,time = t*1e3)
	for j in range(n):
		sT = sim.sensitivity('temperature',j)
		if abs(sT)>=abs(sT_max[j]):
			sT_max[j] = sT

s_abs = np.abs(sT_max)

#sorting the reactions
reactions = [a for b, a in sorted(zip(s_abs,reactions),reverse = True)]
reac_num = [a for b, a in sorted(zip(s_abs,reac_num),reverse = True)]
sT_max = [a for b, a in sorted(zip(s_abs,sT_max),reverse = True)]

#assigning teh sensitive reactions
max_r = reactions[0:N]
max_n = reac_num[0:N]
max_s = sT_max[0:N]

#table_creations
print("The top %d Most Temperature Sensitive Recations :"%(N))
print("------------------------------------------------------------------")
print("%1s %11s %1s %8s %1s %11s %1s" % ('|','REACTION ID','|','REACTION','|','SENSITIVITY','|'))
print("------------------------------------------------------------------")
for i in range(N):
	print("%7d %10s %26s %4s %10.4f"%(max_n[i],'|',max_r[i],'|',sT_max[i]))
print("------------------------------------------------------------------")

#plot
#time vs temperature
plt.subplot(2,2,1)
plt.plot(states.time,states.T)
plt.xlabel('time in ms')
plt.ylabel('temperature k')

# time vs OH mole fraction
plt.subplot(2,2,2)
plt.plot(states.time,states('OH').X)
plt.xlabel('time in ms')
plt.ylabel('OH Mole Fraction')

# time vs H mole fraction
plt.subplot(2,2,3)
plt.plot(states.time,states('H').X)
plt.xlabel('time in ms')
plt.ylabel('H Mole Fraction')

# time vs CH4 mole fraction
plt.subplot(2,2,4)
plt.plot(states.time,states('CH4').X)
plt.xlabel('time in ms')
plt.ylabel('CH4 Mole Fraction')
plt.tight_layout()

#graph showing 10 sensitive reactions
plt.figure(2)
plt.barh(max_r,max_s,0.4,color='brown')
plt.xlabel('sensitivity')
plt.ylabel('reactions')
plt.title('Top 10 temperature sensitive reactions of grimech 3.0')
plt.gca().invert_yaxis()
plt.grid()
plt.tight_layout()
plt.show()
RESULTS:
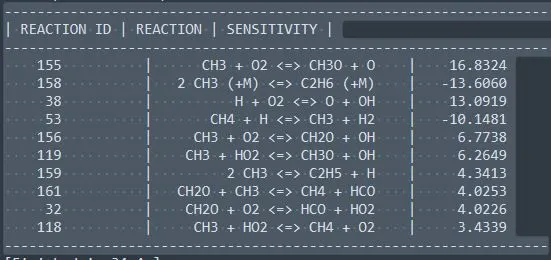
The top 10 most sensitive reactions can be seen below:
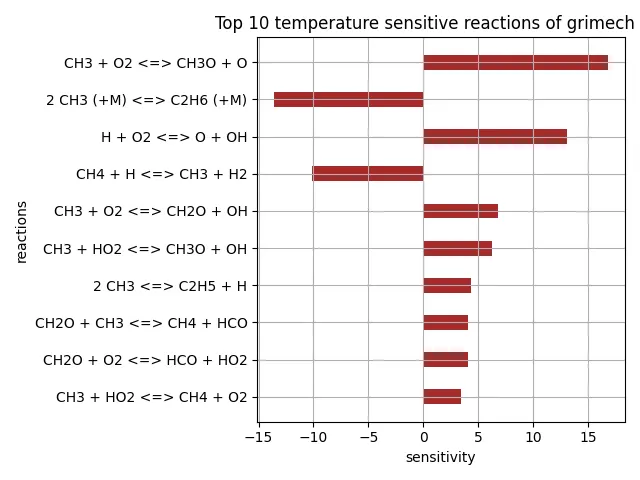
The plot for the sensitivities can be seen below:
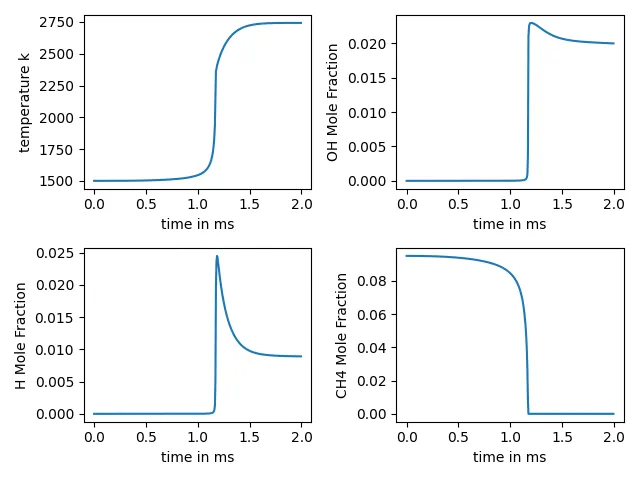
The change in concentration with respect to time for the above reactions can be seen below:
OBSERVATIONS:
- From the above reactions the sensitivities can be noticed. The positive sensitivity of reaction means that the rate of reaction will increase with increase in temperature and vice-versa for the negative sensitivities.
- The second figure shows the change in molar concentration of species with respect to time as the simulation marches forward in time further the ignition delay can also be notices in the first subplot of the figure.