Week 9 - Senstivity Analysis Assignment
Week 9 – Sensitivity Analysis using Cantera
Aim: - Determination of sensitivity factor for GRI Mechanism using Reactor Network in Cantera.
Objective: -
- To study the importance of sensitivity analysis.
- To program the code for sensitivity analysis of GRI mechanism.
- To construct a code in such a way that it shows the reaction strings in order of greatest sensitivity to least sensitivity.
- To construct a parametric code for sensitivity analysis.
- To plot the result for ignition delay in time with respect to temperature of reaction.
Introduction: -
In typical combustion mechanism of natural gas there are numerous other reactions are taking place with respect to temperature and time. Some reaction has the huge effect on the ignition delay and some don’t. In order to tune the reaction, it is important to find which reaction has the most sensitivity towards the auto-ignition and ignition delay. Sensitivity analysis is performed to determine the effect of reaction parameters such as concentration of species, pressure and temperature. The main focus of the sensitivity analysis is on the rate of change of temperature with respect to molar fraction of species which are include in the reactions. The sensitivity coefficients are either positive or negative and each of them have its own meaning. It is known that several reaction effects ignition delay depending upon the molecular reactions in which hydrocarbons are involved. The positive sensitivity coefficient of the particular reaction tells lower ignition delay time period which means auto-ignition time for such reaction is less. Similarly, negative sensitivity coefficient of the particular reactions tells about increase in ignition delay time. To tune the reaction either sensitivity coefficient need to be reduced or increased depending upon the combustion phenomenon.
To determine the sensitivity of the reaction the cantera used reactor network object which calculates the state such as temperature, pressure and concentration of species includes in the reaction. For a single reactor it is important to create series of reactor network to calculates the required data for the user.
Coding Approach: -
The code start with important module which are used for mathematics, cantera object oriented programming and for plotting the results. Then from the GRI mechanism the gas object is used which reflects the combustion of natural gas phenomenon and its corresponding reactions. For iterating the reaction, it need to have initial conditions which are provided as temperature and pressure respectively. Considering the reaction as Ideal gas constant pressure reactor mechanism, the reactor network has been created. The reaction from the network is stored in the reactions variable which can be used later for iterations. For reaction to be incorporated for sensitivity analysis a variable called ‘n’ is created which defined the reactions. The id of reaction has to be known hence another variable called ‘r_id’ is created. As it is required to find out 10 most sensitive reactions from the combustion phenomenon the variable ‘N’ is created and it is programmed as parameter which can be change according to user requirement for getting most of reaction from mechanism. To find out the sensitivity of each reaction which are put in variable ‘n’ a loop is created which read all the reaction and will find its sensitivity. For the convergence purpose absolute and relative tolerances for solution and sensitivity has been provided respectively. The maximum temperature need to be extracted which will have achieved during the reaction and stored in variable called ‘st_max’. To get the temperature, pressure and molar concentration of species from the reaction variable called ‘states’ is used which will further use ‘SolutionArray’ class to calculate these variables. After that time for the solution is provided from the variable called ‘t’ in code. To find out the state variable respective to time domain a loop is created in which ‘advance’ method is used for time integration function in reaction network. To store the maximum temperature achieved in each of the reaction another loop is created inside first time loop. This two loops work simultaneously for the extraction of state variable with respect to time and temperature as mentioned above. For getting out the results from the code the absolute value temperature is extracted. Three variable are created to define reaction names, reaction ID number and sensitivity coefficient which are ‘r_name’, ‘r_id_number’, and ‘s_coeff’ respectively. To see the results, various printing techniques are used to see the sensitivity coefficient in output panel also bar graph of sensitivity index is created following with plots of temperature with respect to ignition delay and molar concentration of ‘CH4’, ‘O2’ and ‘H’ with respect to time in milliseconds. The code for sensitivity analysis is shown below:
"""
Week 9 - Sensitivity Analysis
To program the sensitivity coefficients for GRI Mechanism
Written By: Shubham Chaudhari
Date: 19/7/2021
"""


import sys
import numpy as np
import cantera as ct
import matplotlib.pyplot as plt

# Providing Initial Conditions for reaction
from numpy.core import linspace

gas = ct.Solution('gri30.xml')
temp = 1500
pres = ct.one_atm
gas.TPX = temp, pres, {'CH4': 1, 'O2': 2, 'N2': 7.52}

# Creation of Reactor Network
r = ct.IdealGasConstPressureReactor(gas)
sim = ct.ReactorNet([r])
reactions = gas.reaction_equations()

# Extraction of Reaction From GRI Mechanism
n = gas.n_reactions
r_id = linspace(1, n, n).astype(int)
# Number of Sensitivity Reactions
N = 10
for i in range(n):
    r.add_sensitivity_reaction(i)

# Defining Actual & Absolute Error for Convergence
sim.rtol = 1e-6
sim.atol = 1e-15
sim.rtol_sensitivity = 1e-6
sim.atol_sensitivity = 1e-6

# Creating Array for Maximum Temperature of Sensitivity
st_max = [0] * n

# Initializing states for storing solution of reaction as array
states = ct.SolutionArray(gas, extra=['t'])


# First Loop for finiding out states varibles
for t in np.arange(0,2e-3,5e-6):
    sim.advance(t)
    states.append(r.thermo.state, t=t*1e3)

    # Second Loop for Storage of Max Temperature of Sensitivity for Each Reactions

    for j in range(n):
        st = sim.sensitivity('temperature', j)
        if abs(st) >= abs(st_max[j]):
            st_max[j] = st

# Taking Reaction and Reaction ID for Sensitivity Coefficients
reactions = [r for s, r in sorted(zip(np.abs(st_max), reactions), reverse=True)]
r_id = [r for s, r in sorted(zip(np.abs(st_max), r_id), reverse=True)]
st_max = [st for abs_st, st in sorted(zip(np.abs(st_max), st_max), reverse=True)]

# Top 10 Sensitivity Reactions
r_name = reactions[0:N]  # Reaction Names
r_id_number = r_id[0:N]  # Reaction ID Numbers
s_coeff = st_max[0:N]    # Sensitivity Coefficients

# Printing out results
print("Top %d temperature sensitive reactions are:" % (N))
print('-------------------------------------------------------------------------')
print("%8s %4s %22s %8s %12s" % ('Reaction ID', 'I', 'Reaction Name', 'I', 'Sensitivity Coefficient'))
print('-------------------------------------------------------------------------')
for i in range(N):
    print("%7d %8s %26s %4s %14f" % (r_id_number[i], 'I', r_name[i], 'I', s_coeff[i]))

plt.figure(1)
plt.barh(r_name, s_coeff)
plt.xlabel('Sensitivity Coefficients')
plt.title('Sensitivity Index for %d Reactions' % (N))
plt.tight_layout()

plt.figure(2)
plt.subplot(2, 2, 1)
plt.plot(states.t, states.T)
plt.xlabel('Time in ms')
plt.ylabel('Temperature in Kelvin', fontweight='bold')
plt.subplot(2, 2, 2)
plt.plot(states.t, states('H').X)
plt.xlabel('Time in ms')
plt.ylabel('Mole Fraction H', fontweight='bold')
plt.subplot(2, 2, 3)
plt.plot(states.t, states('O2').X)
plt.xlabel('Time in ms')
plt.ylabel('Mole Fraction O2', fontweight='bold')
plt.subplot(2, 2, 4)
plt.plot(states.t, states('CH4').X)
plt.xlabel('Time in ms')
plt.ylabel('Mole Fraction CH4', fontweight='bold')
plt.tight_layout()
plt.show()
Results
Plot 1: -
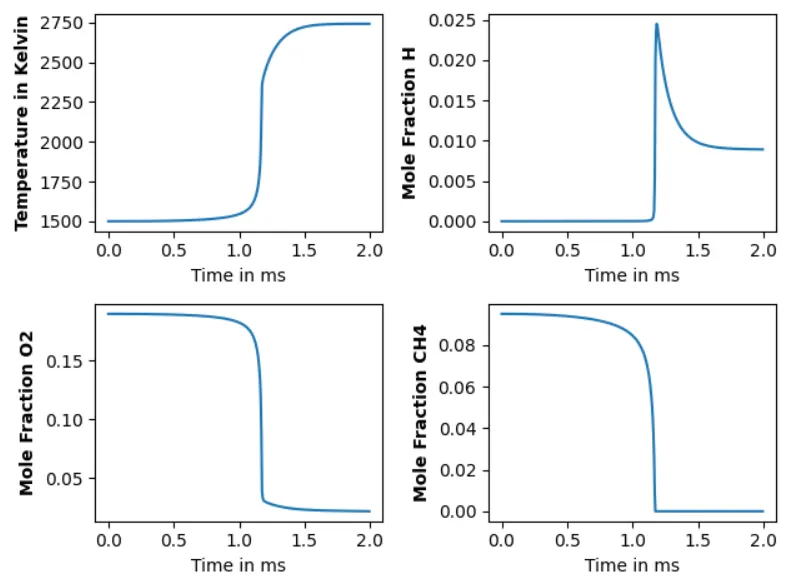
From above plot it can be seen that, the ignition delay for the fuel and air mixture at a temperature of 1500 Kelvin and 1 atmospheric pressure is around 1.1 miliseconds. Similar to that time the mole fraction of oxygen and CH4 is getting reduced as it was comsumed in the burning process whereas the mole fraction of monoatomic hydrogen is increased which further mixed with other species to form emissions.
Plot 2: -
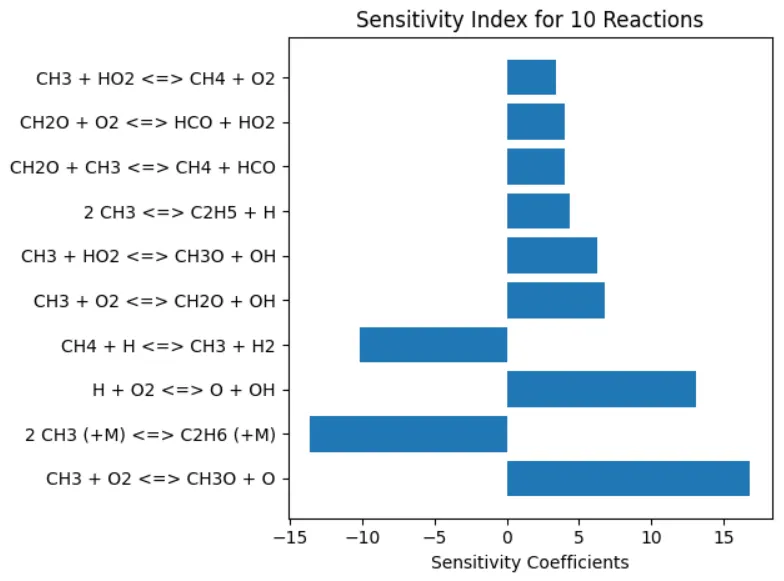
From the above bar graph it can be seen that, most of the reaction from 10 of them having positive sensitivity index which tells lowering of ignition delay timing. The most highest of all reaction is `CH_3 + O_2 harr CH_3O + O`. As it was already stated that positive sensitivity coefficient reduce the ignition time whereas negative sensitivity coefficient increase the ignition delay time.
Plot 3: -
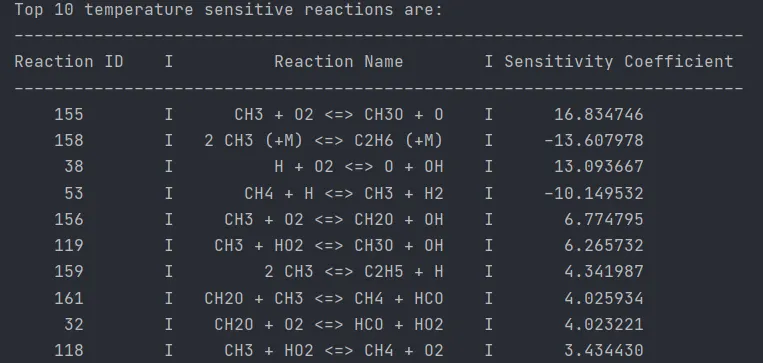
From above console output it can be seen that, this reaction are most temperature sensitive reactions from GRI mechanism. The sensitivity coefficient are not normalized in this code.