Week 9 - Senstivity Analysis Assignment
AIM
* To write code that takes all the reactions of GRI30 mechanism file and hence calculate 10 most sensitive reactions.
* Sensitivity of the reactions are calculated with respect to temperature.
INTRODUCTION
If we consider any reaction, let us consider the stoichometric combustion of methane`CH_4 + 2(O_2+3.76N_2) = CO_2+2H_2O+7.52N_2`. The end products of this reaction is not directly formed, there are lot of intermediary species that are formed and lot of elementary reactions that takes place and hence all the intermediary species and elementary reactions that takes place are called the reaction mechanism. In simple words we can say that the path followed by the reactants before it gets converted into products.
All the intermediary reactions and the different species that are formed effects the rate of reaction, apart from this the conditions such as temperature, pressure under which these reaction takes place also effects the rate of reaction.
Sensitivity analysis is the process to get the relationship between the parameters and output of the model. Higher the sensitivity greater will be the impact of the parameter on the output of the model.
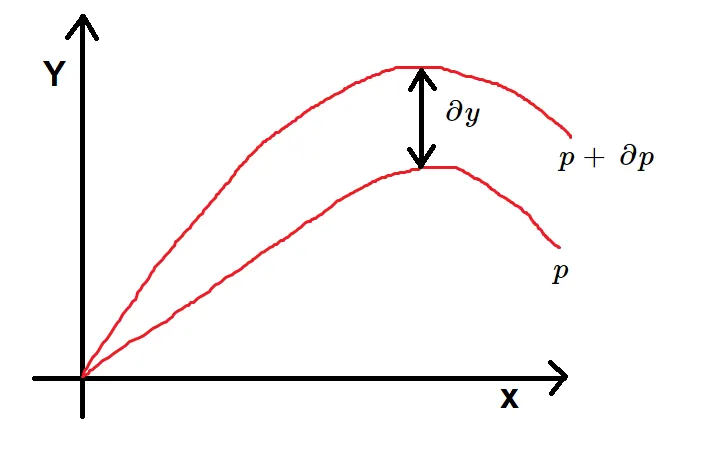
Consider a function `Y = f(X,p)`, X is the input and p is the indepenent parameter. The 2 plots shown below shows the variation of the `Y` when the parameter is changed from `p` to `p + delp`, this change in the value of parameter results in the change in the output by `dely`. The sensitivity of Y with respect to parameter p is defined as`
Sensitivity = `(dely)/(delp)`
Logic :
* Sensitivity of all the reactions in GRI30 mechanism file is calculated with respect to temperature and hence it is neccesary that the GRI mechanism file is given as i/p to the Solution class and hence an instance of the solution class called gas is defined.
* The initial temperature is set at 1500 K and pressure is set at 1 atm. Apart from this the mole fraction of reactants are set as per the stoichometric combustion equation of methane.
* A array with name Sen_max is created so as to store the max sensitivity value of each reaction at each time step. All the max sensitivity values are initially set with a value of zero.
* A ideal gas constant pressure reactor is used and the gas object is passed as an i/p to the reactor, also a reactor network called sim is defined so as to solve for the governing equations.
* All the reactions of the GRI 3.0 mechanism file is extracted and all the reactions are included in the sensitivity analysis. Sensitivity analysis of each reaction w.r.t temperature is calculated using the following command.
* Reactor network sim is advanced through time, from a start time of 0 sec to 2e-3 sec in the steps of 5e-6.
* At every time step the sensitivity of reactions in the GRI mechanism file is computed and a if loop is defined to check for the max sensitivity value.
* Reactions are sorted on the decreasing order of sensitivity and it is zipped with respective reaction id.
* Top 10 sensitivity values of the reaction is tabulated.
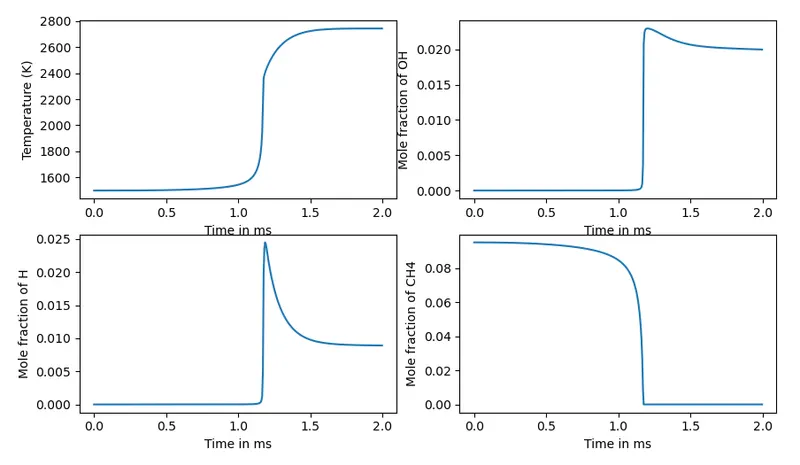
* Temperature, mole fraction of `OH, H, CH_4` are ploted.
codes:
import numpy as np

import sys

import matplotlib.pyplot as plt

import cantera as ct

gas = ct.Solution('gri30.xml')

T = 1500 # Initial temperature in K

P = 101325 # Initial pressure in Pa

gas.TPX = T,P,{'CH4':1,'O2':2,'N2':7.52}

N = gas.n_reactions; # Extracting number of reaction from gri30 mechanism file

r_id = np.linspace(0,N,N).astype(int)

reactions = gas.reaction_equations()

Sen_max = [0]*N # Initializing an array that stores max sensitivity value

r =  ct.IdealGasConstPressureReactor(gas)

sim = ct.ReactorNet([r])

for i in range(N):

	r.add_sensitivity_reaction(i)

sim.rtol = 1.0e-6

sim.atol = 1.0e-15

sim.rtol_sensitivity = 1.0e-06

sim.atol_sensitivity = 1.0e-06

states = ct.SolutionArray(gas, extra = ['t'])  # Extra variable t is defined

for t in np.arange(0,2e-3,5e-6): # Defining a for loop to advance through time

	sim.advance(t)

	for j in range(N): # Defining a for loop such that temperature sensitivity of all N reactions are computed

		sens_react = sim.sensitivity('temperature', j)

		if np.abs(sens_react) >= np.abs(Sen_max[j]):

			Sen_max[j] = sens_react

	states.append(r.thermo.state, t=1000*t)


# Zipping and sorting reactions, reaction id, max_temp_sensitivity value
reactions = [r for s,r in sorted(zip(np.abs(Sen_max),reactions), reverse = True)]

r_id = [r for s,r in sorted(zip(np.abs(Sen_max),r_id), reverse = True)]

Sen_max = [st for abs_st,st in sorted(zip(np.abs(Sen_max),Sen_max), reverse = True)]


# Extracting 10 most sensitive reactions from sorted list
r_plot = reactions[0:10]

r_id_plot = r_id[0:10]

s_plot = Sen_max[0:10]


# Displaying the top 10 reactions in a table format
print("Top 10 sensitivity reaction")

print("-------------------------------------------------------------------")

print("%8s %4s %18s %12s %12s" %('Reaction ID', '|', 'Reaction','|','Sensitivity'))

print("-------------------------------------------------------------------")

for i in range(10):
	print("%7d %8s %26s %4s %10.4f" % (r_id_plot[i],'|', r_plot[i] , '|', s_plot[i]))

print("-------------------------------------------------------------------")


plt.figure(1)
plt.subplot(2,2,1)
plt.plot(states.t, states.T)
plt.xlabel('Time in ms')
plt.ylabel('Temperature (K)')
plt.subplot(2,2,2)
plt.plot(states.t, states('OH').X)
plt.xlabel('Time in ms')
plt.ylabel('Mole fraction of OH')
plt.subplot(2,2,3)
plt.plot(states.t, states('H').X)
plt.xlabel('Time in ms')
plt.ylabel('Mole fraction of H')
plt.subplot(2,2,4)
plt.plot(states.t, states('CH4').X)
plt.xlabel('Time in ms')
plt.ylabel('Mole fraction of CH4')
plt.show()
Running the above codes gives us the following table and the plots as shown below,
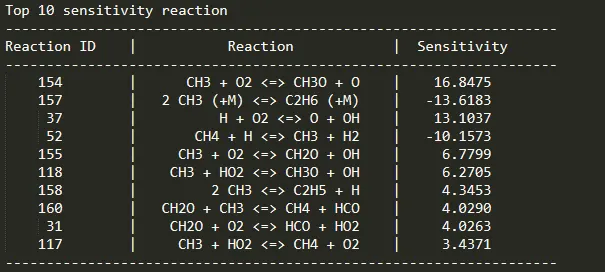
* From the above table it can be seen that for 2 reactions the sensitivity value is -ve, and for other reactions it is positive. Those reactions for which the sensitivity values are positive if we increase the temperature the reaction rates of those reactions will increase and for those reactions which has sensitivity value -ve increasing the temperature will decrease its reaction rate.