Week 9 - Senstivity Analysis Assignment
Given Data
Temperature=1500
Pressure=1atm
CH4 combustion
To Find:
combustion sensitivity analysis methane combustion
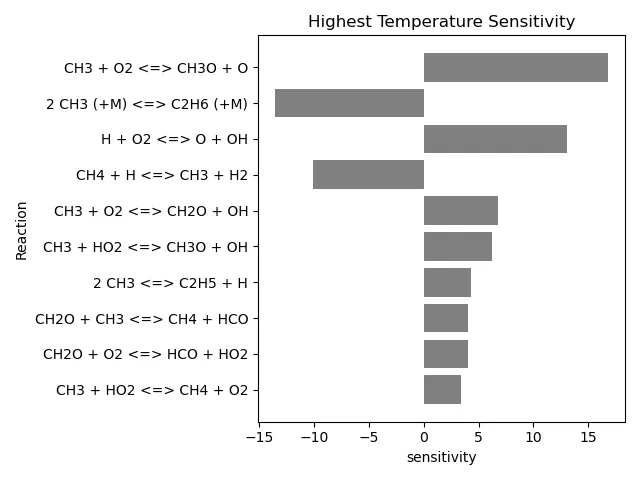
10 most sensitive reactions
Temperature function of 10 reactions vs sensitivity
Solution:
Theory
Sensitivity Analysis
the sensitivity analysis is a standard approach to investigate the influence of chemical species and elementary reactions in kinetic models on the combustion quantities of interest, such as ignition delay times and exhaust gas compositions
sensitivity coefficients, which represent the relationship between input and output variables of a system, provide on one hand essential information for model construction, modification, and simplification and, on the other hand, are of major relevance for uncertainty analyses of numerical simulations.
The obtained sensitivity coefficients, which represent the relationship between input and output variables of a system
Python/Cantera lib code:
"""
constant pressure, adabatic kinetics simulation using sensitvity analysis
"""

import sys
import numpy as np
import cantera as ct
import matplotlib.pyplot as plt

gas=ct.Solution('gri30.xml')
T=1500
P=ct.one_atm
species={'CH4':1 ,'O2':2, 'N2':7.52}

gas.TPX=T,P,species
r=ct.IdealGasConstPressureReactor(gas,name='R1')
sim=ct.ReactorNet([r])

#help(r)

#Extracting the reaction equations & there number of reaction
reactions=gas.reaction_equations()
n=gas.n_reactions

r_id=np.linspace(1,n,n)

#most 10 sensitive analysis
N=10

# reaction to be display
ST=[1]*n
# enable sensitivity with repective to the rates of the first 10 reaction
# reactions (reactions 0 through 9)
for i in range(n):
	r.add_sensitivity_reaction(i)

# tolences for the solution of sensitivity  coefficent
sim.rtol=1.0e-6 # relative solution should lesser change below this number
sim.atol=1.0e-15 # absolute solution should lesser change below this number

sim.rtol_sensitivity=1.0e-6 # relative sensitivity should lesser change below this number
sim.atol_sensitivity=1.0e-6 # absolute sensitivity should lesser change below this number

# storing property function of time
states= ct.SolutionArray(gas,extra=['t'])
t=np.arange(0,2e-3,5e-6)

#Solving for time function Temperature species

for t in np.arange(0,2e-3,5e-6):
	sim.advance(t)
	states.append(r.thermo.state,t=1000*t)

# soliving sensitivity for temperature
	for j in range(n):
		s=sim.sensitivity('temperature',j)

# soliving reaction number
		if np.abs(s)>np.abs(ST[j]):
			ST[j]=s
Tf_max=states.T
dt=states.t
max_T=max(Tf_max)

# extraction value of maximum sensitivity,reaction & id in zi.
reac=[a for b,a in sorted(zip(np.abs(ST),reactions),reverse=True)]
rid=[a for b,a in sorted(zip(np.abs(ST),r_id),reverse=True)]
ST_max=[a for b,a in sorted(zip(np.abs(ST),ST),reverse=True)]

# Assigning n maximum senstivity
#storing maximum N reactions
n_reac=reac[0:N]
n_rid=rid[0:N]
#storing maximum N Sensitivity
n_sens=ST_max[0:N]

# extraction of mole fractions
C_OH=states('OH').X
C_CH4=states('CH4').X
C_H=states('H').X

# to find indices for maximum Tf_max
i_Tmax = [i for i in range(len(Tf_max)) if Tf_max[i] == max(Tf_max)]
# to find indices for maximum C_OH function
i_OHmax = [i for i in range(len(C_OH)) if C_OH[i] == max(C_OH)]
# to find indices for maximum C_H function
i_Hmax = [i for i in range(len(C_H)) if C_H[i] == max(C_H)]


#creating plotting table for N sensitivity case1
print("Top %d Temperature sensitivity :"%(N))
print("-------------------------------------------------------------------------")
print("%8s %4s %18s %12s %12s" %('Reaction ID','|','Reactions','|','Sensitivity'))
print("-------------------------------------------------------------------------")
for l in range(N):
	print("%7s %8s %26s %4s %10.4f" %(n_rid[l],'|',n_reac[l],'|',n_sens[l]))
print("-------------------------------------------------------------------------")
print('Maximum Temperature value:',Tf_max[i_Tmax],'k')
print('time at which maximum temperature:',dt[i_Tmax],'ms')
print('concentration of OH:',C_OH[i_Tmax])
print('concentration of CH4:',C_CH4[i_Tmax])
print('concentration of H:',C_H[i_Tmax])
print('maximum concentration of OH',C_OH[i_OHmax])
print('time at which maximum OH:',dt[i_OHmax],'ms')
print('concentration of CH4:',C_CH4[i_OHmax])
print('concentration of H:',C_H[i_OHmax])
print('Temperature at maximum H:',Tf_max[i_OHmax],'k')
print('maximum concentration of H',C_H[i_Hmax])
print('time at which maximum H:',dt[i_Hmax],'ms')
print('concentration of CH4:',C_CH4[i_Hmax])
print('concentration of H:',C_H[i_Hmax])
print('Temperature at maximum OH:',Tf_max[i_Hmax],'k')
print('-------------------------------------------------------------------------')

#plotting
#bar sensitivity vs max(N) Reaction
plt.figure(1)
plt.barh(n_reac,n_sens,color='gray')
plt.gca().invert_yaxis()
plt.title('Highest Temperature Sensitivity')
plt.xlabel('sensitivity')
plt.ylabel('Reaction')
plt.tight_layout()
plt.savefig('reaction_vs_sensitivity.png')
plt.grid(color='c', linestyle='--', linewidth=0.2)

#ploting Temperature,concentration of OH,concentration of H,concentration of CH4 vs time
plt.figure(2)
plt.suptitle('Sensitivity Analysis of Methain',fontsize=16)
plt.subplot(2,2,1)
plt.plot(dt,Tf_max,color='red')
plt.grid('ON')
plt.xlabel('Time (ms)',fontsize=13)
plt.ylabel('Temperature (k)',fontsize=13)
plt.subplot(2,2,2)
plt.plot(dt,C_OH,color='green')
plt.xlabel('Time (ms)',fontsize=13)
plt.ylabel('OH Mole Fraction',fontsize=13)
plt.grid('ON')
plt.subplot(2,2,3)
plt.plot(dt,C_CH4,color='gray')
plt.xlabel('Time (ms)',fontsize=13)
plt.ylabel('CH4 Mole Fraction',fontsize=13)
plt.grid('ON')
plt.subplot(2,2,4)
plt.plot(dt,C_H,color='blue')
plt.xlabel('Time (ms)',fontsize=13)
plt.ylabel('H Mole Fraction',fontsize=13)
plt.grid('ON')
plt.tight_layout()
plt.savefig('sunction_of_flame_wrt_time1.png')

plt.show()
Graph
Top 10 concentration Vs Sensitivity
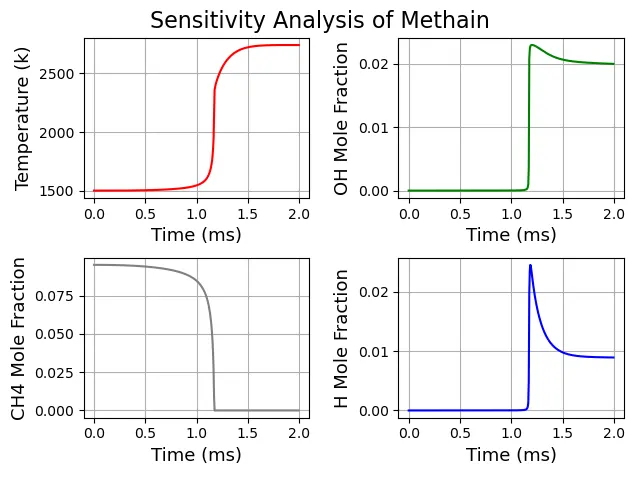
Time Vs Temperature, the concentration of CH, CH4,H
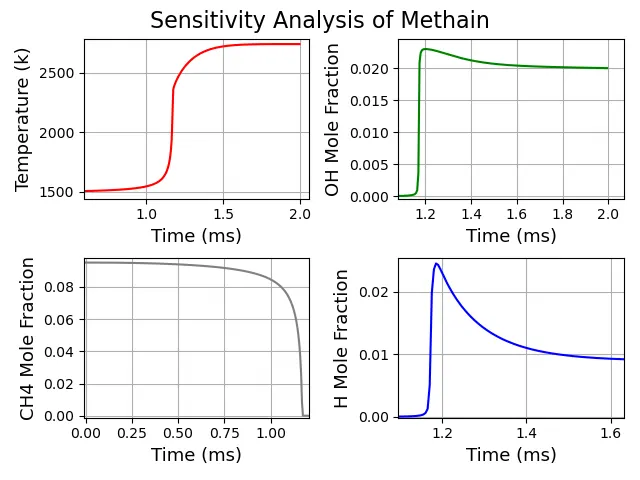
Detail view
Top 10 Temperature sensitivity :
-------------------------------------------------------------------------
Reaction ID | Reactions | Sensitivity
-------------------------------------------------------------------------
155.0 | CH3 + O2 <=> CH3O + O | 16.8475
158.0 | 2 CH3 (+M) <=> C2H6 (+M) | -13.6183
38.0 | H + O2 <=> O + OH | 13.1037
53.0 | CH4 + H <=> CH3 + H2 | -10.1572
156.0 | CH3 + O2 <=> CH2O + OH | 6.7799
119.0 | CH3 + HO2 <=> CH3O + OH | 6.2705
159.0 | 2 CH3 <=> C2H5 + H | 4.3453
161.0 | CH2O + CH3 <=> CH4 + HCO | 4.0290
32.0 | CH2O + O2 <=> HCO + HO2 | 4.0263
118.0 | CH3 + HO2 <=> CH4 + O2 | 3.4371
-------------------------------------------------------------------------
Maximum Temperature value: [2742.85765632] k
time at which maximum temperature: [1.9] ms
concentration of OH: [[0.02005725]]
concentration of CH4: [[1.71472616e-15]]
concentration of H: [[0.00893676]]
maximum concentration of OH [[0.02297978]]
time at which maximum OH: [1.2] ms
concentration of CH4: [[7.0182632e-16]]
concentration of H: [[0.02292461]]
Temperature at maximum H: [2448.98757501] k
maximum concentration of H [[0.02450448]]
time at which maximum H: [1.185] ms
concentration of CH4: [[9.03894441e-16]]
concentration of H: [[0.02450448]]
Temperature at maximum OH: [2404.36592213] k
-------------------------------------------------------------------------
Conclusion:
Sensitivity is zero means there no reaction started equilibrium does not depend on reaction rate.
for maximum concentration, Temperature is varied which is shown above.
from the above analysis, it has been concluded that temperature is a function of concentration reaction changes according to vary temperature we can play with reaction.
where at CH4 at maximum Temperature is fully converted the fuel to combustion so the concentration is at a negligible level
Source:
https://www.tandfonline.com/doi/full/10.1080/13647830.2018.1495845