Week 9 - Senstivity Analysis Assignment
- Aim :
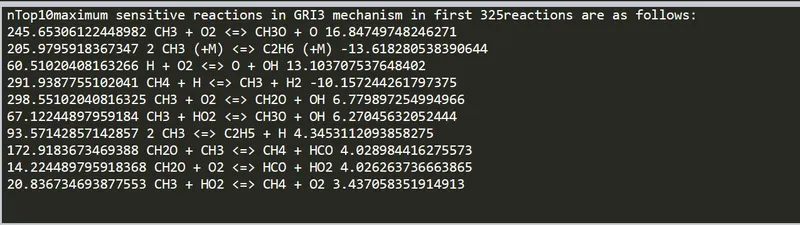
- To write a code that takes all the reactions from the GRI mechanism and calculates 10 most sensitive reactions.
- To show the reaction strings in the order of greatest sensitivity to the least sensitivity.
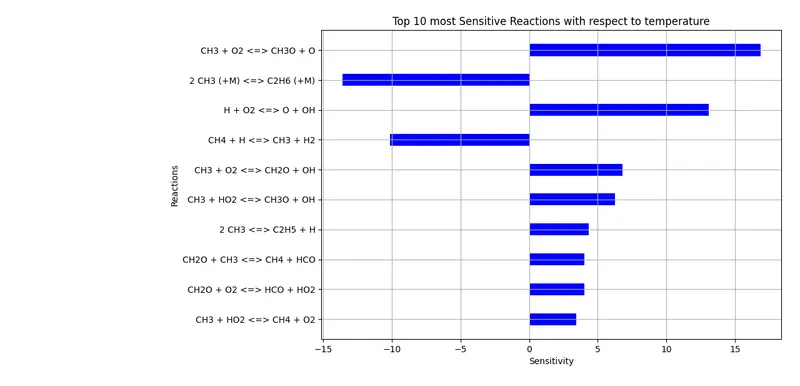
- To plot a graph of sensitivities vs the reactions.
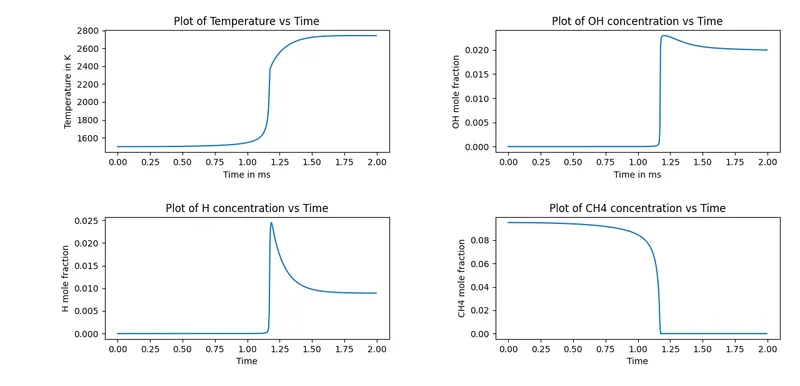
- To plot a graph of concentrations of species vs temperature.
- Theory :
As studied earlier, when a combustion reaction takes place there are numerous intermediate reactions that take place before reactants completely convert into products. We also know how tmeperature, pressure and specis concentration affects ignition delay. These intermediate reactions are also affected by same paramters and due to this some reactions take place at very high rate and some take place at really low rate. Upon varying these paramters we get to know which reaction is sensitive to which parameter. A reaction that is affected by small changes in parameters can be called as highly sensitive and a reaction which isn't affected by significant changes in paramters can be called as insensitive.
Sensitivity analysis is used to identify the parameters that affect a computed solution the most. It has proven invaluable in combustion studies, where the number of parameters is typically large. The sensitivity coefficient Si is defined as
`S_i =A_i/y.(dely)/(delA_i)`
where y is the solution to a simulation L(y)=0, and Ai is the ith parameter on which the solution depends.
Sensitivity analysis is necessary to calculate the emissions that occur after combustion of specific fuel. By varying the temperature, presssure, fuel composition, etc. we can find out the suitable working conditions which give least amount of emissions possible.
- Steps involved in coding :
- Import numpy, matplotlib and cantera module.
- Create gas object in solution class.
- Define values of temperature and pressure.
- Use 'gas.TPX' command and define values of temperature, pressure and mole fractions of species.
- Create a reactor object named 'r' using 'ct.IdealGasConstPressureReactor' command.
- Define reactor network named sim.
- Use 'gas.n_reactions' to extract number of reactions from gri30.xml file.
- Define reaction numbers and reactions.
- Create an array for sensitivity analysis.
- Add all the reactions from 'r' for sensitivity analysis.
- Define tolerances.
- Create a solution array called states to store properties at each time step.
- Create a time loop for 2 mili-seconds with time-step of 5e-6 seconds.
- Use 'sim.advance(t)' command to run simulation for 2 miliseconds.
- Append states to store all the values.
- Calculate maximum sensitivity of reactions and store them in 's_max' array.
- Store absolute valuesof sensitivity.
- Sort and zip the values according to absolute value of sensitivity.
- Extract 'n'(in this case 10) most sensitive reactions.
- Print the reactions and thier sensitivities.
- Plot sensitivities and species concentration.
- Code :
import sys
import numpy as np
import cantera as ct
import matplotlib.pyplot as plt

#Creating Gas object and defining initial conditions

gas = ct.Solution('gri30.xml')
T = 1500
P = ct.one_atm
gas.TPX = T, P, 'CH4:1, O2:2, N2:7.52'

#ReactorNetwork

r = ct.IdealGasConstPressureReactor(gas, name='R1')
sim = ct.ReactorNet([r])

N = gas.n_reactions

reaction_number = np.linspace(1,N)
reactions = gas.reaction_equations()
s_max = [0]*N

for i in range(N):
	r.add_sensitivity_reaction(i)

#Tolerances

sim.rtol = 1e-6
sim.atol = 1e-15

sim.rtol_sensitivity = 1e-6
sim.atol_sensitivity = 1e-6

states = ct.SolutionArray(gas, extra = ['t'])

#Time loop

for t in np.arange(0,2e-3, 5e-6):
	sim.advance(t)

	states.append(r.thermo.state, t=t*1e3)

	for i in range(N):
		s = sim.sensitivity('temperature', i)

		if np.abs(s_max[i]) <= np.abs(s):
			s_max[i] = s


s_abs = np.abs(s_max)

#Zipping data to extract reactions with max sensitivity

reactions = [p for q, p in sorted(zip(s_abs, reactions),reverse = True)]
reaction_number = [p for q, p in sorted(zip(s_abs,reaction_number), reverse = True)]
s_max = [p for q, p in sorted(zip(s_abs, s_max), reverse = True)]

n = 10
Reactions = reactions[0:n]
max_reactions = reaction_number[0:n]
max_sensitivity = s_max[0:n]

# Printing top 10 most sensitive reactions

print('nTop'+str(n)+'maximum sensitive reactions in GRI3 mechanism in first '+str(N)+'reactions are as follows:')
for i in range(n):

	print(max_reactions[i],Reactions[i],max_sensitivity[i])

plt.figure(1)
plt.barh(Reactions, max_sensitivity, 0.4, color='blue')
plt.xlabel('Sensitivity')
plt.ylabel('Reactions')
plt.title('Top 10 most Sensitive Reactions with respect to temperature')
plt.gca().invert_yaxis()
plt.grid()
plt.tight_layout()

plt.figure(2)
plt.subplot(2,2,1)
plt.plot(states.t, states.T)
plt.xlabel('Time in ms')
plt.ylabel('Temperature in K')
plt.title('Plot of Temperature vs Time')
plt.subplot(2,2,2)
plt.plot(states.t, states('OH').X)
plt.xlabel('Time in ms')
plt.ylabel('OH mole fraction')
plt.title('Plot of OH concentration vs Time')
plt.subplot(2,2,3)
plt.plot(states.t, states('H').X)
plt.xlabel('Time')
plt.ylabel('H mole fraction')
plt.title('Plot of H concentration vs Time')
plt.subplot(2,2,4)
plt.plot(states.t, states('CH4').X)
plt.xlabel('Time')
plt.ylabel('CH4 mole fraction')
plt.title('Plot of CH4 concentration vs Time')
plt.tight_layout()
plt.show()
Results -
Plots -
Observations -
Sensitivity has positive as well as negative values. Meaning increase in temperature will cause sensitivity to increase in positive as well as negative direction. Positive sensitivity means higher reaction rate and negative sensitivity indicates lower reaction rate.
Species concentration remains stable for approximately 1.1 mili-seconds and then suddenly jumps or falls before becoming stable. This indicates the ignition delay which takes place before combustion starts. When temperature and species concentration becomes stable, equilibrium is reached.
- Conclusion :
- As studied previously, initial temperature affects the sensitivity of reactions. If initial temperature is increased the reactions with positive sensitivties will have higher reaction rates.
- By varying 'n', sensitivity analysis can be done for more or less number of reactions depending upon the requirement.
- To obtain desired ignition delays, sensitivity analysis should be done.
- Emission control can be achieved by performing sensitivity analysis for different fuels under different working conditions.