Week 9 - Senstivity Analysis Assignment
Week 9 - Sensitivity Analysis Assignment
Aim: Sensitivity analysis of GRI-3.0 mechanism
Objectives:
- Determine 10 most sensitive reactions from the GRI-3.0 mechanism
- Determine sensitivity with respect to temperature
- Output the reactions in decreasing order of sensitivity
Theory:
In any reaction mechanism, multiple intermediate reactions also occur which affects the rate of the entire mechanism. These reactions depend on the operating conditions and can be controlled to achieve the desired state. In order to control the reactions, we can change parameters like temperature, pressure, species, concentration, etc. that have a direct impact on the rate of the particular reaction. This impact is studied by sensitivity analysis. Hence, we get the relationship between the input and output parameters of the system. Higher the sensitivity, the greater the impact of any change in the parameter on the output. Suppose, `x` is the input parameter and `y` is the output, then if `x` is incremented, and thus becomes `x + deltax` then the output is deviated by `deltay`. Then, the sensitivity is given as:
Sensitivity `= (partialy)/(partialx)`
Hence, based on this sensitivity, we can vary the input to obtain the desired output.
Code:
- We need to initialize the gas instance from the gri30 mechanism fileand set initial temperature to 1500K, the pressure to 1atm and species concentration according to stoichiometric coefficients. `CH_4 + 2(O_2 + 3.76N_2) -> CO_2 + 2H_2O + 7.52N_2`.
- Create an ideal gas constant pressure reactor 'r' from the gas instance and a reactor network 'sim' from the 'r' instance. Setting tolerances for the solvers.
- Initialize a solution array to store the thermodynamic state of gas at each time step (and hence, initializing a time step).
- Further, the reaction is passed through each time step and thermodynamic state variables are appended in the solution variable. The sensitivity of each reaction is evaluated and the maximum of the result is stored.
- The above data is sorted and the top ten values are displayed
"""
Program to identify top 10 temperature-sensitive reactions for the GRI 3.0 mechanism
by Saurabh

"""
import numpy as np
from numpy import *
import cantera as ct
import matplotlib.pyplot as plt
from matplotlib.pyplot import *

# Initial conditions for the reaction mechanism
gas = ct.Solution('gri30.xml')
T0 = 1500
P0 = ct.one_atm
gas.TPX = T0, P0, {'CH4':1, 'O2':2, 'N2':7.52}

# Initializing the reactor and the reactor network
r = ct.IdealGasConstPressureReactor(gas)
sim = ct.ReactorNet([r])
reactions = gas.reaction_equations()

# Extracting and adding reactions from the mechanism to sensitivity analysis
n = gas.n_reactions
rid = linspace(1,n,n).astype(int)
N = 10  # Number of sensitive reactions to be displayed
for i in range(n):
	r.add_sensitivity_reaction(i)

# Setting the relative and absolute tolerances for the solver
sim.rtol = 1e-06
sim.atol = 1e-15
sim.rtol_sensitivity = 1e-06
sim.atol_sensitivity = 1e-06

# Initializing the maximum temperature sensitivities of each reaction
sT_max = [0]*n

# Initializing a solution array to store the reaction properties at each time-step
states = ct.SolutionArray(gas, extra=['t_in_ms'])

# Creating the time domain for the reactor network
t = linspace(0, 2e-3, 401)

# Outer time loop
for i in range(len(t)):
	sim.advance(t[i])
	states.append(r.thermo.state, t_in_ms=t[i]*1e3)
	# Storing the maximum sensitivities of each reaction
	for j in range(n):
		sT = sim.sensitivity('temperature',j)
		if abs(sT) >= abs(sT_max[j]):
			sT_max[j] = sT

# Sorting the reactions and reaction IDs based on absolute value of sensitivities
reactions = [r for s,r in sorted(zip(np.abs(sT_max),reactions), reverse=True)]
rid = [r for s,r in sorted(zip(np.abs(sT_max),rid), reverse=True)]
sT_max = [sT for abs_sT, sT in sorted(zip(np.abs(sT_max),sT_max), reverse=True)]

# Extracting the top 10 sensitive reactions
rplot = reactions[0:N]
rid_plot = rid[0:N]
splot = sT_max[0:N]

# Printing the results
print("The top %d temperature sensitive reactions are:" % (N))
print("-------------------------------------------------------------")
print("%8s %4s %18s %12s %12s" % ('Reaction ID','|','Reaction','|','Sensitivity'))
print("-------------------------------------------------------------")
for i in range(N):
	print("%7d %8s %26s %4s %10.4f" % (rid_plot[i],'|',rplot[i],'|',splot[i]))
print("-------------------------------------------------------------")

# Extracting mole fractions of OH, H and CH4
OH = states.X[:, states.species_index('OH')]
H = states.X[:, states.species_index('H')]
CH4 = states.X[:, states.species_index('CH4')]

# Plotting the results
fig1, ax1 = subplots()
y_pos = arange(len(rplot))
plt.grid('both',linestyle='--',linewidth=1.2)
ax1.set_axisbelow(True)
ax1.barh(y_pos, splot, 0.5, align='center', color='blue')
ax1.set_yticks(y_pos)
ax1.set_yticklabels(rplot, rotation=0, fontweight='bold')
ax1.invert_yaxis()
xticks = [-20, -15, -10, -5, 0, 5, 10, 15, 20]
ax1.set_xticklabels(xticks, rotation=0, fontsize = 12)
ax1.set_xlabel('Temperature Sensitivity', fontsize = 18, fontweight='bold')
title('10 most temperature sensitive reactions for the GRI 3.0 mechanism of CH4 combustion', fontsize=20, fontweight = 'bold')
savefig('Sensitivity_reactions.png')
plt.show()

fig2, ax2 = subplots(2,2)
plt.subplot(2,2,1)
plt.plot(states.t_in_ms,states.T,linewidth=2)
plt.grid('both',linestyle='--',linewidth=0.8)
plt.xlabel('Time [ms]',fontweight='bold')
plt.ylabel('Temperature [K]',fontweight='bold')
plt.subplot(2,2,2)
plt.plot(states.t_in_ms,OH,linewidth=2)
plt.grid('both',linestyle='--',linewidth=0.8)
plt.xlabel('Time [ms]',fontweight='bold')
plt.ylabel('OH Mole Fraction',fontweight='bold')
plt.subplot(2,2,3)
plt.plot(states.t_in_ms,H,linewidth=2)
plt.grid('both',linestyle='--',linewidth=0.8)
plt.xlabel('Time [ms]',fontweight='bold')
plt.ylabel('H Mole Fraction',fontweight='bold')
plt.subplot(2,2,4)
plt.plot(states.t_in_ms,CH4,linewidth=2)
plt.grid('both',linestyle='--',linewidth=0.8)
plt.xlabel('Time [ms]',fontweight='bold')
plt.ylabel('CH4 Mole Fraction',fontweight='bold')
plt.tight_layout()
plt.savefig('Sensitivities.png')
plt.show()
Results :
The following table is obtained as the result and shows the top 10 sensitivity reactions.
The top 10 temperature sensitive reactions are:
-------------------------------------------------------------
Reaction ID    |           Reaction            |  Sensitivity
-------------------------------------------------------------
    155        |      CH3 + O2 <=> CH3O + O    |    16.8475
    158        |   2 CH3 (+M) <=> C2H6 (+M)    |   -13.6183
     38        |          H + O2 <=> O + OH    |    13.1037
     53        |       CH4 + H <=> CH3 + H2    |   -10.1573
    156        |     CH3 + O2 <=> CH2O + OH    |     6.7799
    119        |    CH3 + HO2 <=> CH3O + OH    |     6.2705
    159        |         2 CH3 <=> C2H5 + H    |     4.3453
    161        |   CH2O + CH3 <=> CH4 + HCO    |     4.0290
     32        |    CH2O + O2 <=> HCO + HO2    |     4.0263
    118        |     CH3 + HO2 <=> CH4 + O2    |     3.4371
-------------------------------------------------------------
[Finished in 36.0s]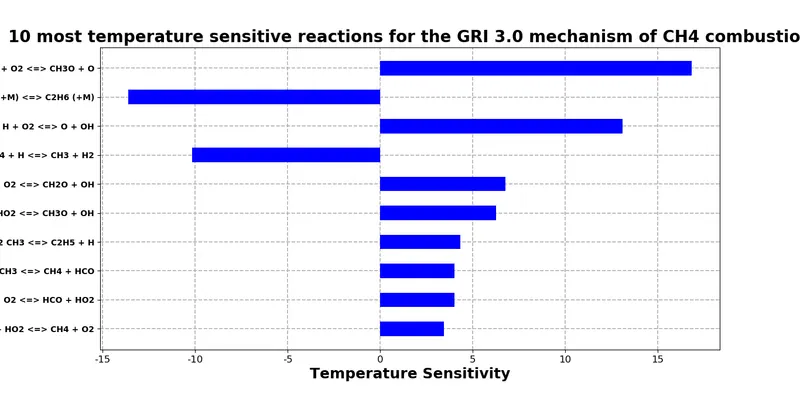
-
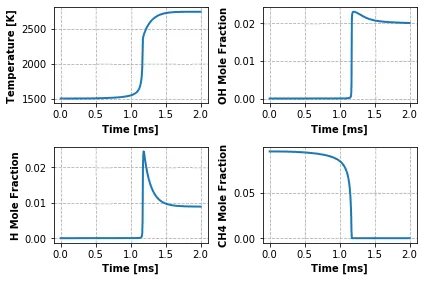
The sensitivity indicates the influence of the reaction on the output parameter such as Temperature or molar fraction of species. In the bar graph, the positive sensitivity indicates that the increase in sensitivity will increase the rate of increase of the temperature of combustion and hence will decrease the ignition delay, i.e. the fuel mixture ignites faster if the positive sensitivities reaction is used.
-
On the other hand, if we want to increase the ignition delay time, then the sensitivities of reaction with negative sensitivity behavior should be used
For example: By increasing the Sensitivities of second and fourth reactions (from the bar graph), the ignition delay will be increased. While increasing the sensitivities of the rest of the reactions will lead to a decrease in ignition delay